
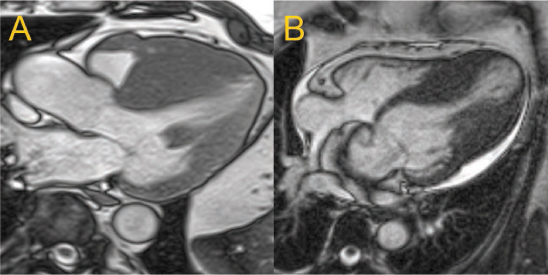
Figure 1.
(A) A 3-chamber long-axis view at end diastole in one individual with asymmetric septal hypertrophy (A) with septal thickness > 3 cm. (B) A 4-chamber long-axis view at end diastole in another patient with mid and apical ventricular hypertrophy with apical thinning suggestive of an apical aneurysm.
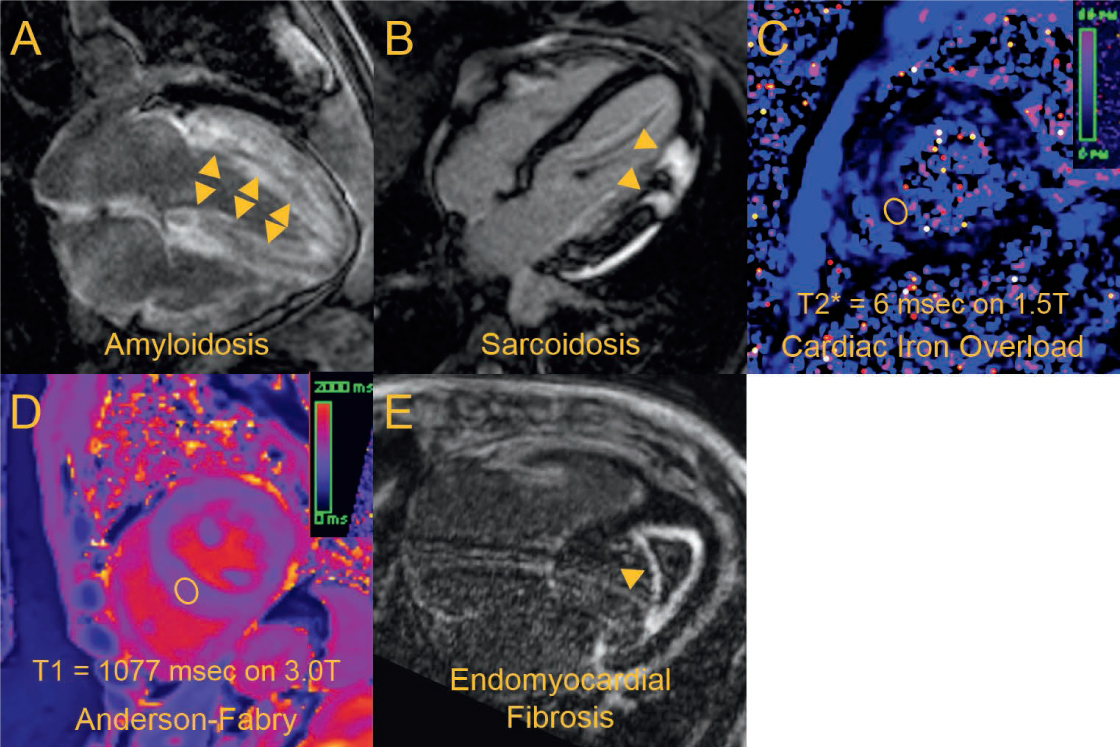
Figure 2.
Each panel corresponds to a different patient with a different form of restrictive cardiomyopathy. (A) A 4-chamber view showing diffuse late gadolinium enhancement (arrows) consistent with amyloidosis. (B) A 4-chamber view showing focal thickening and late gadolinium enhancement of the lateral wall (arrows) in a nonischemic pattern suggestive of sarcoidosis. (C) Midventricular short-axis T2* parametric map showing very low T2* times in the left ventricle (sampled in ellipsoid region of interest) suggestive of cardiac iron overload. (D) Midventricular short-axis native T1 parametric map in an individual with confirmed Anderson-Fabry and no cardiac iron overload, with T1 times (sampled in ellipsoid region of interest) found to be significantly reduced compared with a reference healthy group (mean T1 1167 ± standard deviation 33 msec at 3.0 T). (E) A 4-chamber view showing an apical thrombus with surrounding fibrotic material by late gadolinium enhancement (arrow), consistent with endomyocardial fibrosis.
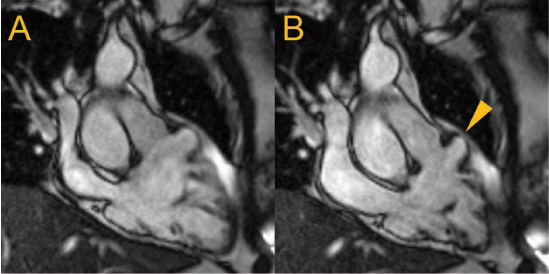
Figure 3.
Cardiac magnetic resonance (CMR) right ventricular (RV) 3-chamber long-axis views are shown at (A) end-diastole and (B) end-systole with an anterior lateral free wall aneurysm (arrow) in an individual with previously unexplained frequent ventricular ectopy. Along with RV dilatation (115 mL/m2) and depressed systolic function (RV ejection fraction 38%), these findings fulfilled major CMR criteria for arrhythmogenic RV cardiomyopathy.
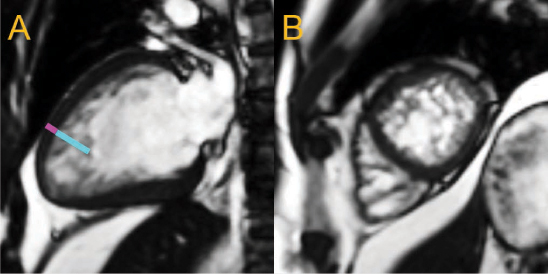
Figure 4.
2-chamber long-axis (A) and apical short-axis (B) views of the same heart at end diastole show prominent, apical trabeculae in an individual with depressed left ventricular (LV) systolic function (LV ejection fraction 42%). The noncompacted (cyan line)-to-compacted (magenta line) myocardial thickness ratio was estimated to be 4.
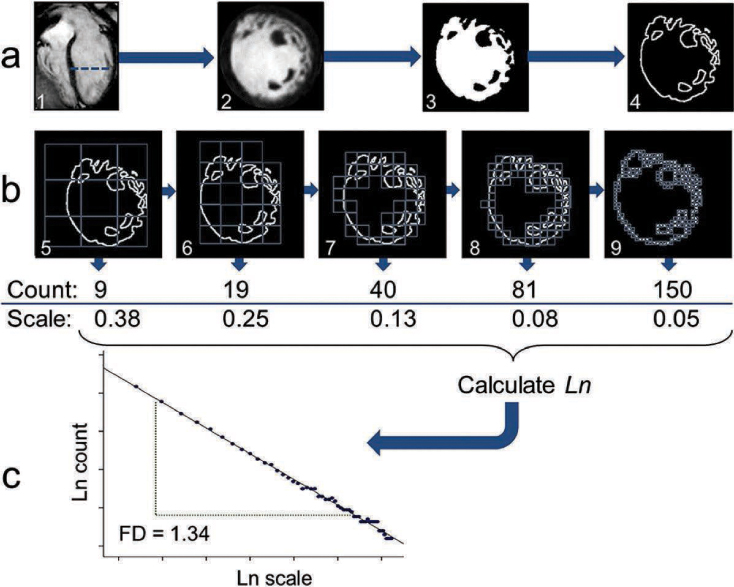
Figure 5.
Steps are shown for fractal analysis of left ventricular (LV) trabeculae in a patient with established LV noncompaction. (A) The endocardial border of the LV in short-axis is segmented out, (B) progressively smaller boxes in grids (scale relative to total image size) are used to count boxes containing the border (boxes with any white pixel), (C) and the box count versus box scale are plotted using logarithmic scale and fitted with a regression line. The regression coefficient of the fitted line becomes the fractal dimension (FD), with higher values suggesting a more trabeculated endocardial border and lower values suggesting a smoother, less trabeculated border. (J Cardiovasc Magn Reason. 2013;10;15:36). Reproduction of the original, unmodified figure is permitted under a Creative Commons License as per BioMed Central copyright policies.
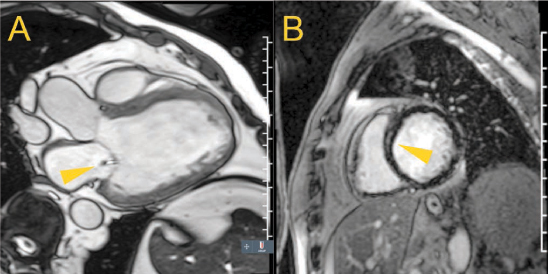
Figure 6.
(A) A 3-chamber view of a heart with dilated cardiomyopathy in systole, illustrating tenting of the mitral valve with functional mitral regurgitation (arrow), (B) and a mid-ventricular short-axis view showing mid-mural scar (arrow) of the interventricular septum on late gadolinium enhancement imaging.
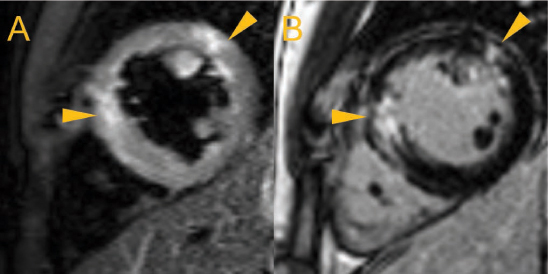
Figure 7.
(A) Mid-ventricular short-axis views of an individual with known active myocarditis showing increased signal intensity suggestive of myocardial edema (white, arrows) on a dark blood T2-weighted image with fat suppression and (B) myocardial scar in the same mid-mural regions (white, arrows) on late gadolinium enhancement imaging.