
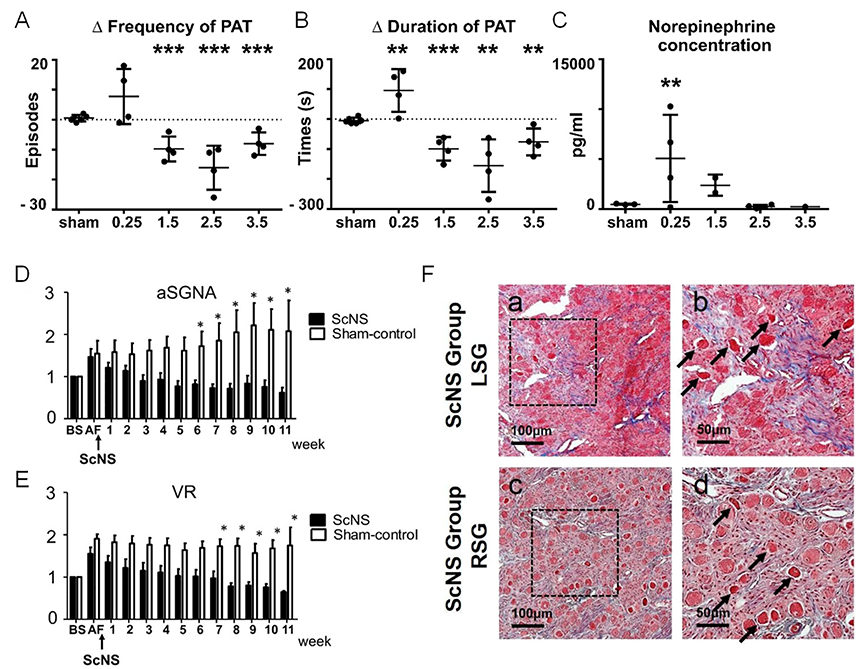
Figure 1.
Effects of subcutaneous nerve stimulation in an ambulatory canine model. (A) The delta PAT frequency per 48 hours and (B) PAT durations between baseline and after ScNS protocol among the 5 groups: sham, 0.25 mA, 1.5 mA, 2.5 mA, and 3.5 mA output of ScNS. (C) The plasma norepinephrine concentrations among the 5 groups. Asterisks indicate significantly (P < .009) higher concentrations in the 0.25 mA group (n = 4) than in all other dogs (n = 10). (D, E) Temporal changes of the aSGNA and VR, respectively, at different times after persistent AF in the ScNS group (filled columns) and in the sham stimulation group (unfilled columns). Compared with baseline (BS), there are significant decreases in aSGNA after 6 weeks and in VR after 7 weeks of ScNS. (F) Examples of Masson’s trichrome staining in stellate ganglion (SG) after ScNS, indicating damaged region with increased fibrosis in both the left SG (LSG in a and b) and right SG (RSG in c and d). High-power views in the dotted square (b and d), indicate abnormal morphology of damaged neurons with eosinophilic staining (arrows). *P < .05, **P < .01, ***P < .001. A-C modified from Wan et al., Heart Rhythm, with permission.21 D-F modified from Yuan et al. Heart Rhythm, with permission.23 PAT: paroxysmal atrial tachycardia; ScNS: subcutaneous nerve stimulation; aSGNA: average stellate ganglion nerve activity; VR: ventricular rate; AF: atrial fibrillation