
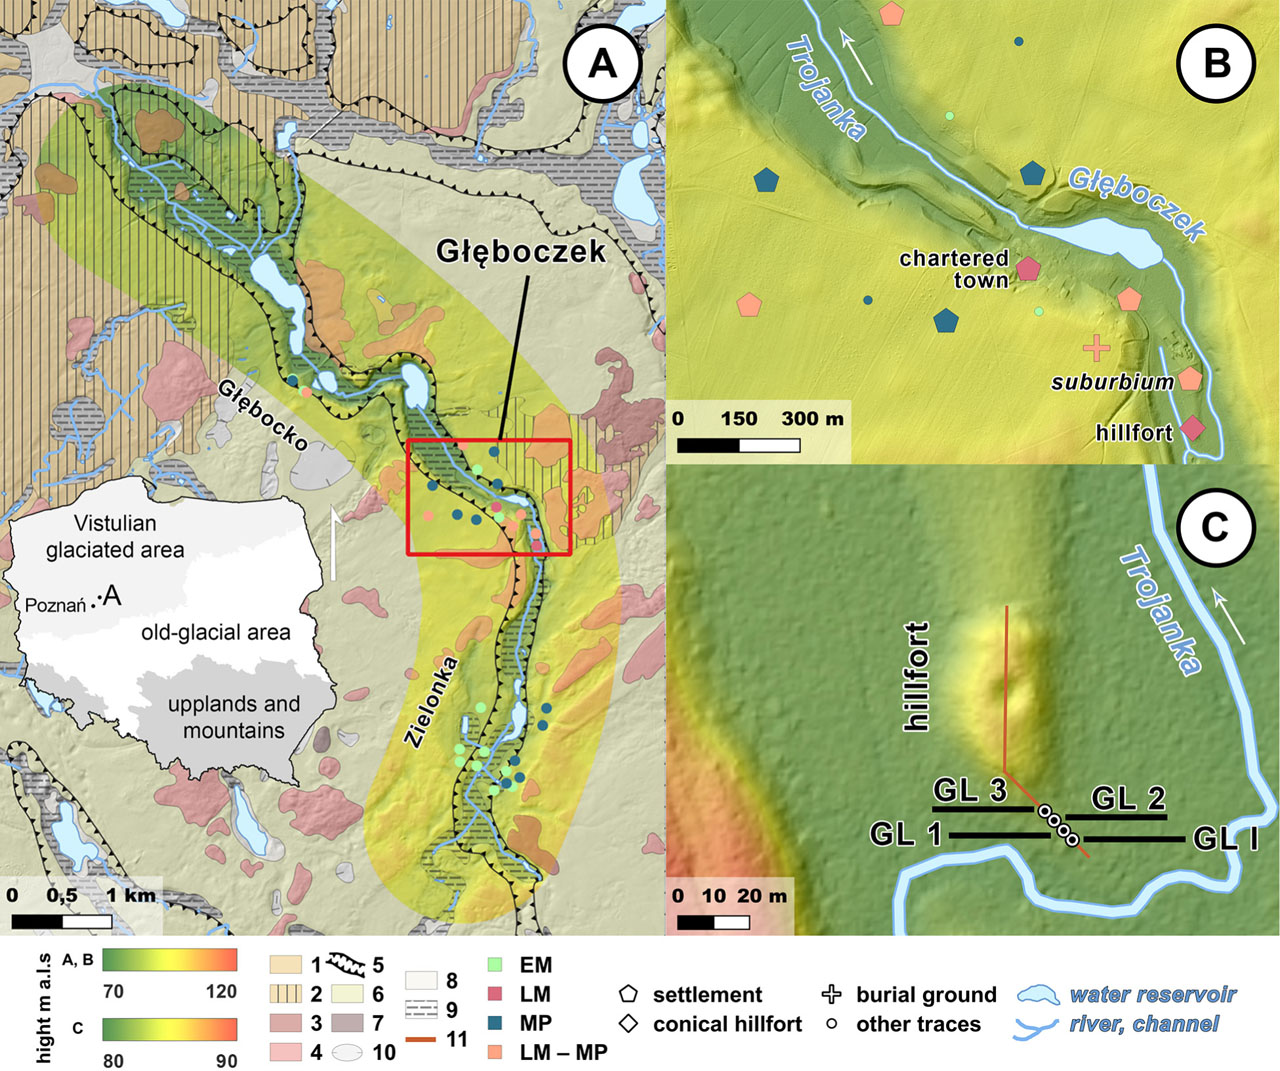
Fig. 1.
Maps of the studied area: A – the upper Trojanka valley, B – close-up view of Głęboczek sites, C – the conical hillfort and locations of the studied profiles. 1 – flat morainic plateau; 2 – undulating morainic plateau; 3 – terminal moraine (mostly depositional); 4 – terminal moraine (mostly pushed); 5 – edges of subglacial valley; 6 – outwash plain; 7 – kames; 8 – depression formed by the exarative activity of the ice sheet; 9 – valleys floor; 10 – peat plain; 11 – cross-section; EM – Early Middle Ages; LM – Late Middle Ages; MP – Modern Period.
Table 1.
AMS radiocarbon dating of the GL I profile.
| Sample name | Depth | Age 14C | Calibration | Material dated |
|---|---|---|---|---|
| [cm] | [14C BP] | [cal. AD] | ||
| Poz-171294 | 51–52 | 285 ± 30 |
| Alnus sp.: fruit, three seeds |
| Poz-171295 | 62–63 | 345 ± 30 | 1470–1637 (95.4%) | Alnus glutinosa: small twigs, seed |
| Poz-171330 | 94–95 | −347 ± 24 |
| Bud scale, seed |
| Poz-174243 | 125–126 | 330 ± 30 | 1480–1640 (95.4%) | Plant remains |
| Poz-174556 | 134–135 | 710 ± 30 |
| Plant remains |
| Poz-170386 | 146–147 | 355 ± 30 |
| Alnus sp.: leaves, bark; coal |
| Poz-170388 | 148–149 | 350 ± 30 |
| Plant remains |
| Poz-170389 | 150–151 | 850 ± 30 |
| Alnus sp.: bark, twig |
| Poz-170390 | 166–167 | 340 ± 30 | 1474–1638 (95.4%) | Alnus sp.: bud scale, leaf, bark, fruit |
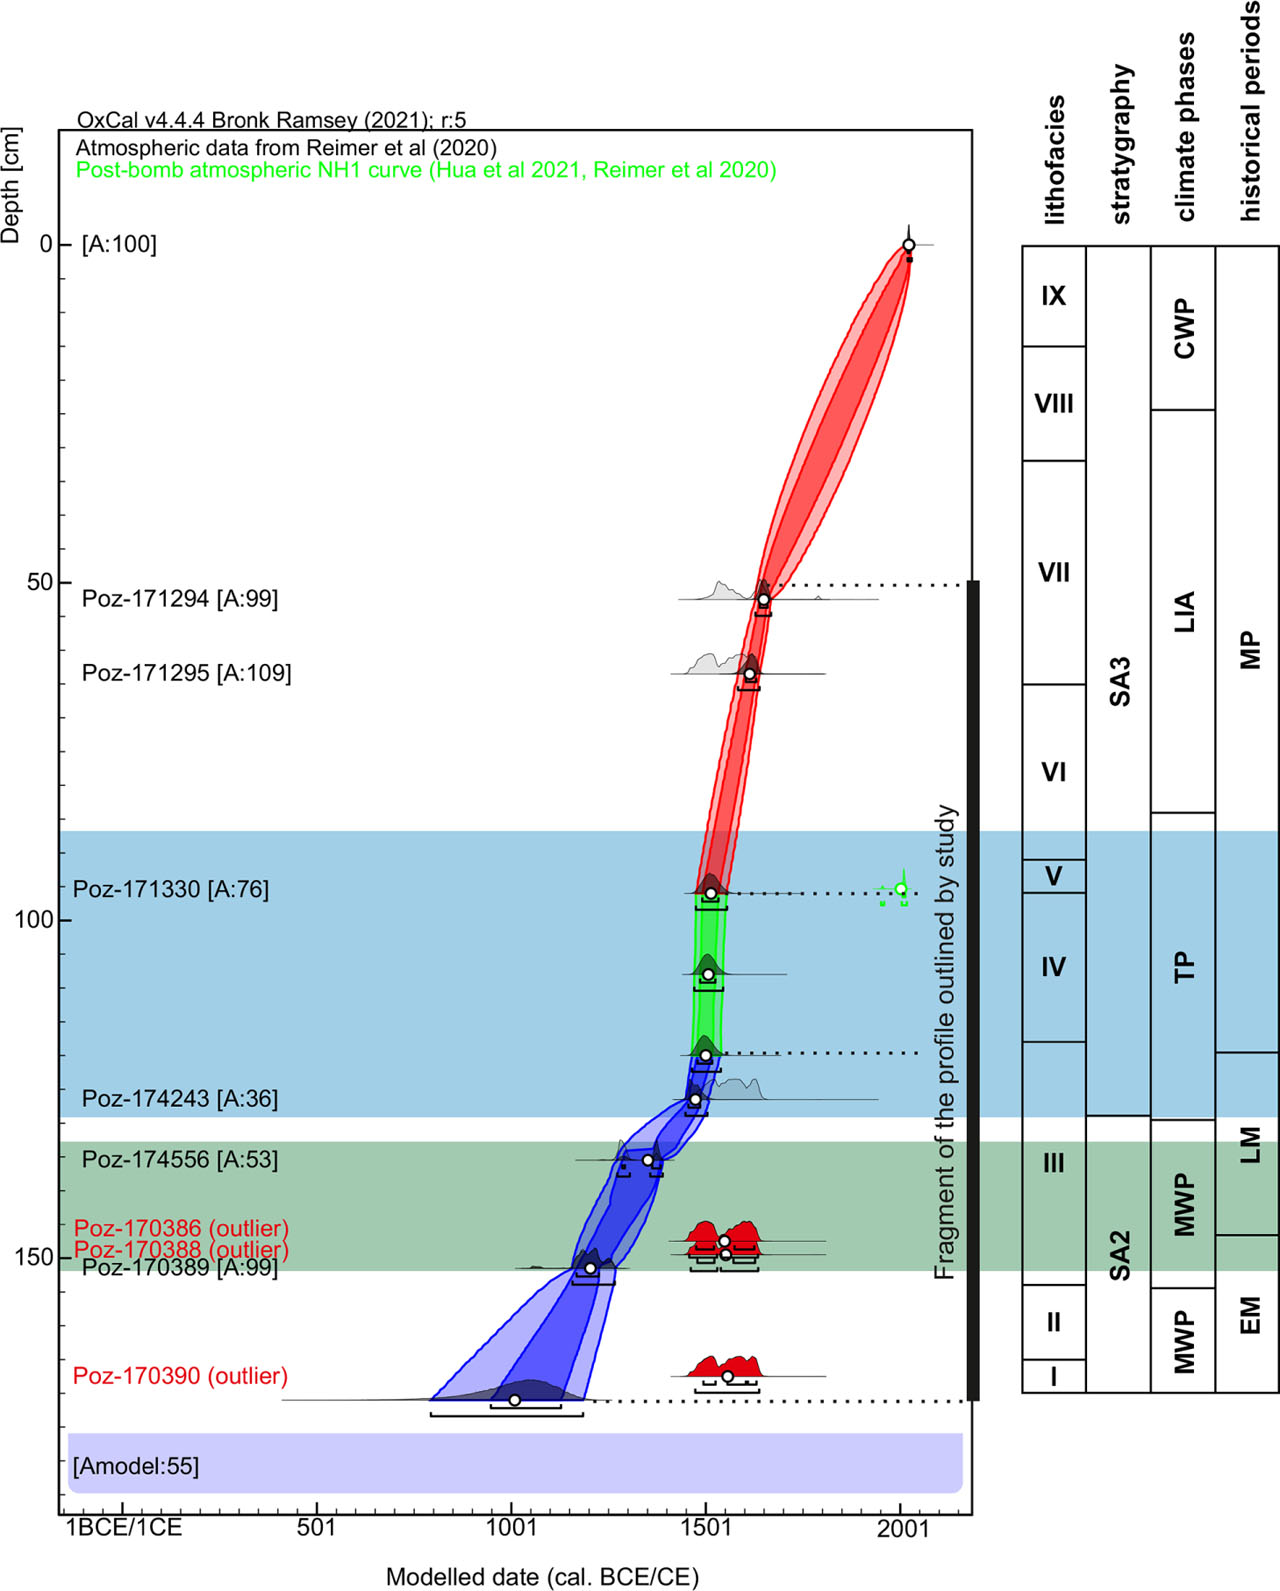
Fig. 2.
Lithological diagrams of studied profiles including: grain-size parameters of Folk and Ward (1957), LOI results, particle classes (Udden 1914, Wentworth 1922) and calibrated age. The course of the cross-section is marked on Figure 1C.
Table 2.
Characteristics of GL I litofacies.
| Facies | Depth | Age | Sediment accumulation ratio | Organic matter content LOI550 | CaCO3 content LOI950 | Gravel | Sand | SiltFs | ClayFc |
|---|---|---|---|---|---|---|---|---|---|
| [cm] | [cal. AD] | [cm ∙ yr−1] | [%] | ||||||
| I | 165–170 | 1020–1070 | 0.30 | 16.06–46.30 | 0.48–6.47 | 0.00 | 13.21–45.41 | 54.59–86.79 | 0.03–0.74 |
| II | 154–165 | 1070–1180 | 0.15 | 32.13–47.82 | 1.86–9.39 | 0.00 | 17.55–36.12 | 63.88–82.45 | <0.60 |
| III | 118–154 | 1180–1502 | 0.10 | 54.69–88.06 | 0.47–10.81 | 0.00 | 23.20–46.00 | 54.00–76.80 | <0.45 |
| IV | 96–118 | 1502–1533 | 0.84 | 0.69–7.29 | 0.18–4.58 | <2.83 | 24.42–85.95 | 14.05–75.58 | <0.06 |
| V | 91–96 | 1533–1541 | 0.63 | 20.06–43.40 | 0.48–5.52 | 0.00 | 55.25–69.05 | 30.95–44.75 | <0.22 |
| VI | 65–91 | 1541–1610 | 0.32 | 6.88–74.87 | 0.26–0.88 | <0.17 | 14.73–93.25 | 6.75–85.27 | <0.01 |
| VII | 32–65 | 1610–1800 | 0.19 | 58.32–82.16 | 0.73–2.04 | 0.00 | 2.78–27.25 | 72.75–97.22 | <0.01 |
| VIII | 15–32 | 1800–1918 | 0.09 | 71.75–85.02 | 0.71–1.33 | 0.00 | 3.35–32.46 | 67.54–96.65 | <0.16 |
| IX | 0–15 | 1918 to present | 0.05 | 66.47–74.42 | 1.10–2.01 | <2.59 | 30.81–84.49 | 15.51–69.19 | <0.01 |
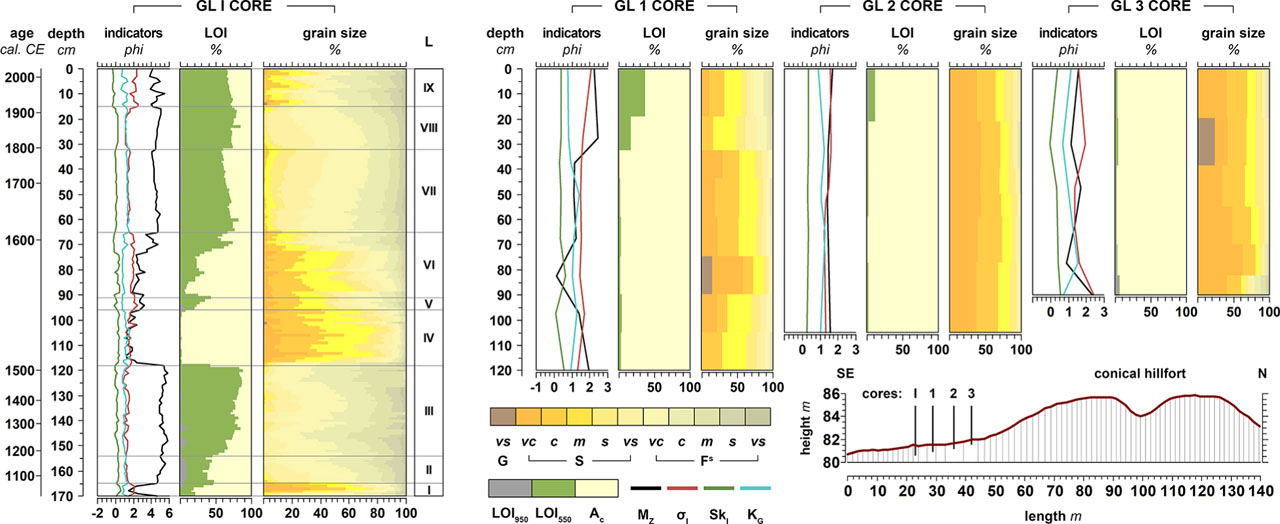
Fig. 3.
Age-depth model of the GL I profile with lithofacies (I–IX) and periodisation (Starkel et al. 2013, Przybylak 2011). SA2, SA3 – Subatlantic and its sub-zones; MWP – Medieval Warm Period; TP – Transitional Period; LIA – Little Ice Age; CWP – contemporary warming period; EM – Early Middle Ages; LM – Late Middle Ages; MP – Modern Period; green area – time conical hillfort was in active use (Jasnosz 1980); blue area – time-chartered town was in active use (Chmielewski et al. 1986).
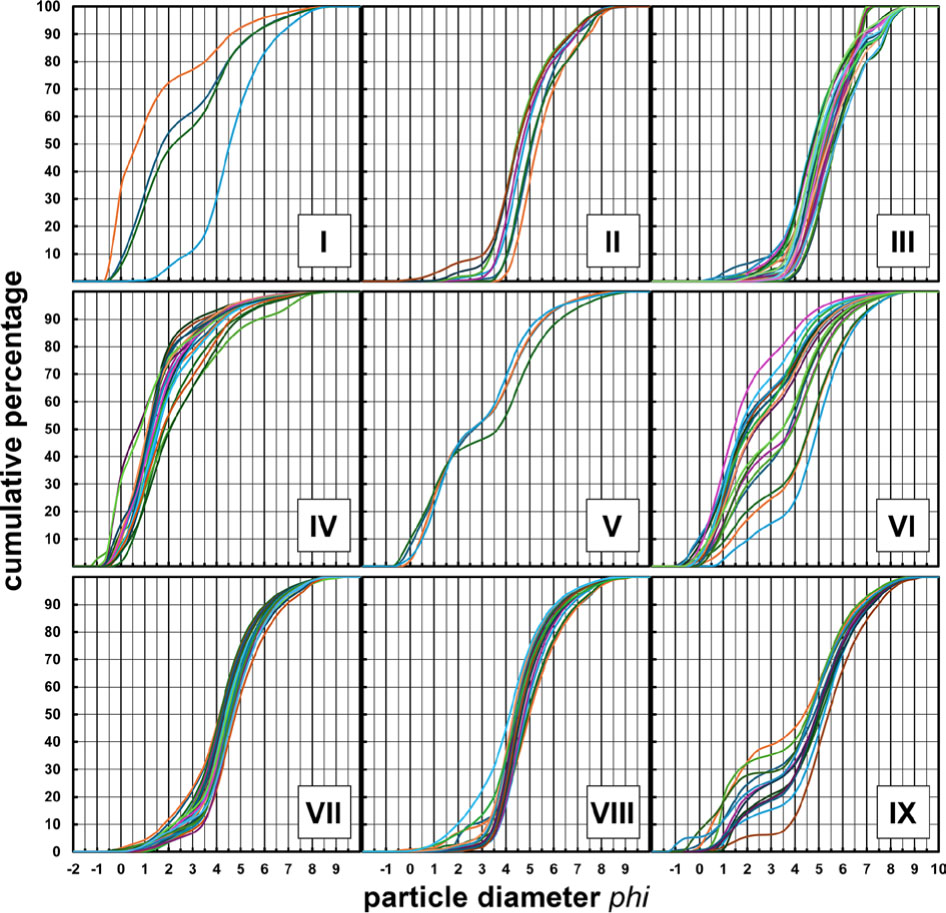
Fig. 4.
Cumulative curve of mean grain-size distribution of the GL I lithofacies at the arithmetic scale.
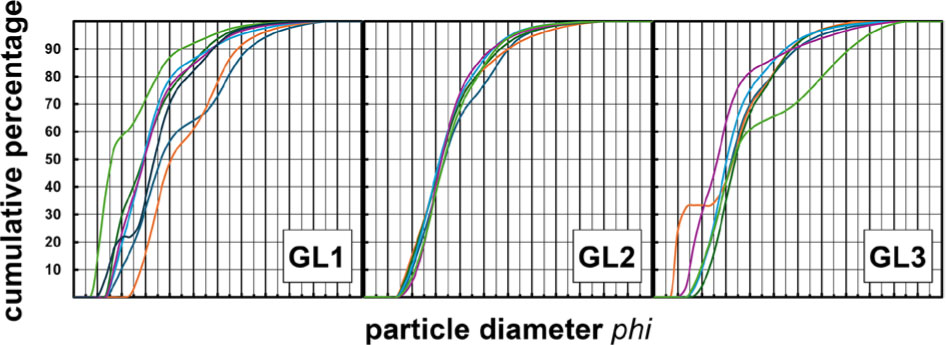
Fig. 5.
Cumulative curve of mean grain-size distribution of the GL 1 to 3 profiles at the arithmetic scale.
Table 3.
Characteristics of the GL 1, GL 2 and GL 3 profiles.
| Core | Depth | Organic matter content LOI550 | CaCO3 content LOI950 | Gravel | Sand | Silt Fs | Clay Fc |
|---|---|---|---|---|---|---|---|
| [cm] | [%] | ||||||
| GL 1 | 0–120 | 1.07–36.69 | 0.28–1.01 | <14.88 | 73.11–93.65 | 4.19–26.89 | <0.01 |
| GL 2 | 0–105 | 0.67–9.920 | 0.20–1.62 | 0.00 | 89.70–94.38 | 5.62–10.30 | <0.01 |
| GL 3 | 0–90 | 0.67–36.69 | 0.60–5.21 | <24.07 | 68.32–93.25 | 6.75–29.03 | <0.01 |
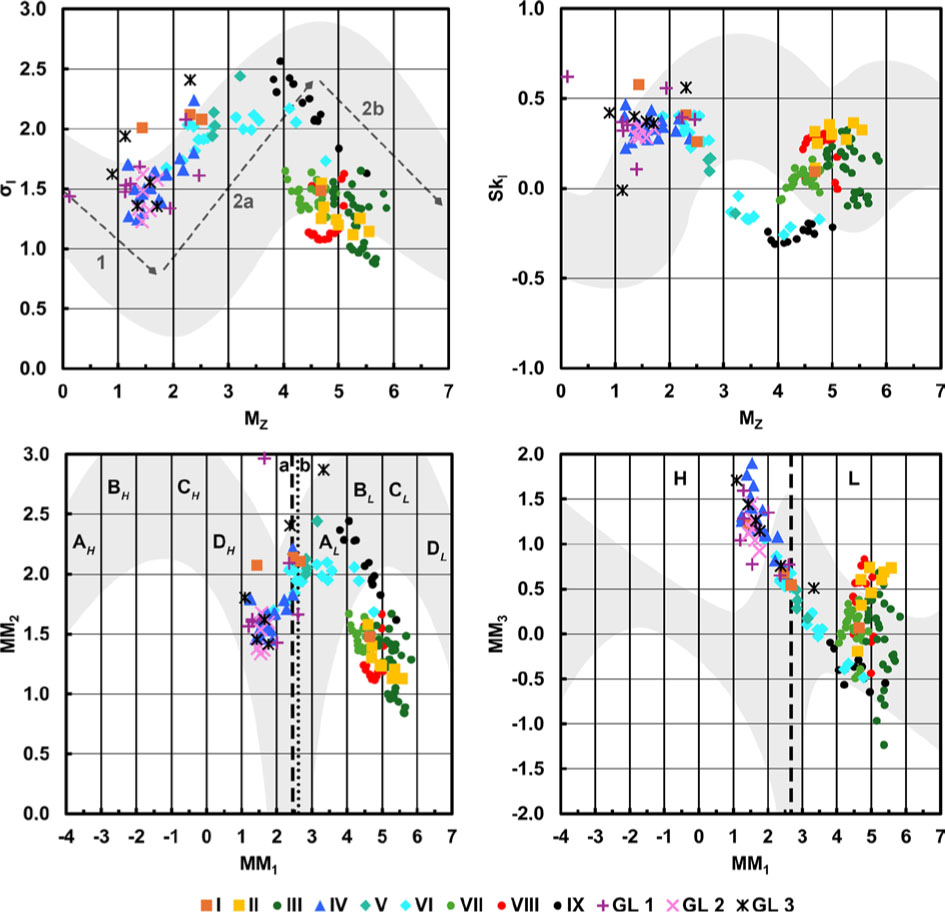
Fig. 6.
Grain-size parameter relationship plots for the GL I lithofacies (I–IX) and the GL 1 to 3 profiles. (Upper row) Coordinate systems (Mycielska-Dowgiałło Ludwikowska-Kędzia 2011), (lower row Lithodynamics interpretation (Sly et al. 1983). Graphical indicators at the phi scale: MZ – mean grain-size; σI – sorting; SkI – skewness; moments indicators at the phi scale: MM1 – mean grain-size; MM2 – sorting; MM3 – skewness; 1 – channel deposits (1st syst.); 2a – overbank deposits (2nd syst.); 2b – overbank-pool deposits (1st syst.); A – accumulation conditions; B, C – transport conditions; D – erosion conditions; H – high energy regime; L – low energy regime; a – skewness divide; b – max kurtosis; gray – distribution of samples researched by Mycielskiej-Dowgiałło (2007).
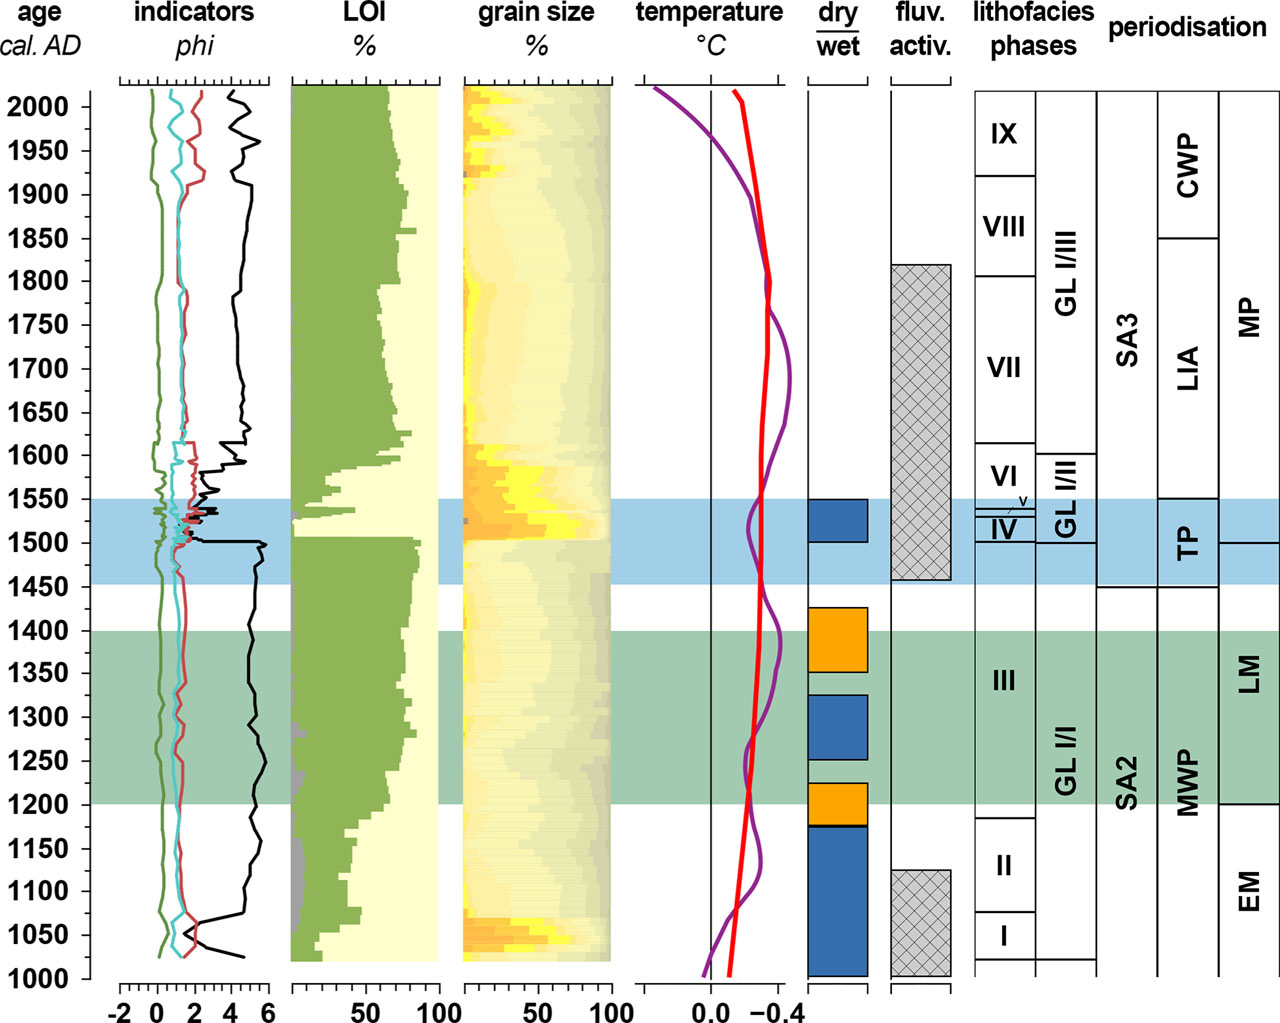
Fig. 7.
Comparison of lithological diagrams of the GL I core (symbols explanation at Fig. 2) with: Esper et al. (2025) mean temperature (red line) and Luterbacher et al. (2010) temperature reconstruction (magenta line); dry (orange boxes) and wet (blue boxes) climate phases (Starkel et al. 2013); periods of increased fluvial activity (Starkel 2011). Periodisation and blue/green areas explained at Figure 2. SA2, SA3 – Subatlantic and its sub-zones; MWP – Medieval Warm Period; TP – Transitional Period; LIA – Little Ice Age; CWP – contemporary warming period; EM – Early Middle Ages; LM – Late Middle Ages; MP – Modern Period.