
Introduction
Mires are an important component of ecosystems worldwide, serving as a habitat for many species and playing a key role in both the water and CO2 cycles. Their position at the interface between aquatic and terrestrial environments makes them excellent archives of geomorphological processes and water-level changes caused by climate change (e.g., Domińczak, Okupny 2010, Twardy et al. 2010, Forysiak et al. 2012, Kittel 2014, Gałka et al. 2015, Okupny et al. 2016, Pietruczuk 2016, Ishii et al. 2017, Forysiak 2018, Kittel et al. 2021, Pleskot et al. 2022, Poolma et al. 2025). Interest in mires as palaeoecological research objects stems from their specific microclimates, anoxic conditions that preserve organic matter and their significance for ecosystems (Tobolski 2000, Ilnicki 2002, Czerwiński et al. 2019, Marcisz et al. 2024).
Modern palaeoecological research methods of the Holocene combining research approaches derived from Earth sciences, chemistry, biology and physics. Such an approach allows for a broader view of environmental evolution and the processes linked to it (Dybova-Jachowicz, Sadowska 2003, Czerwiński et al. 2019, Boyle 2024, Marcisz et al. 2024). The lithological aspect of palaeoeco-logical mire research is usually marginal and limited to general descriptions of sediments with rare grain-size parameters such as mineral admixtures within organic sediments, including peat.
In studies of settlement history, the palaeoecological approach expands knowledge even when no cultural remains or written records have survived to the present day (Hildebrandt-Radke et al. 2011b). The history of human settlement was strongly influenced by environmental conditions (Pounds 2005). At the same time, humans became a significant factor shaping the environment. Therefore, the mutual relationship between humans and nature is an important aspect of studies on past settlement systems. The settlement history of the Zielonka Forest (central-western Poland) reflects these human–environment interactions. Numerous archaeological traces are concentrated mainly in valleys and near lakeshores and wetlands (Fig. 1; Krzepkowski et al. 2017). The distribution of these findings indicates that the area was inhabited and cultivated since prehistoric times.
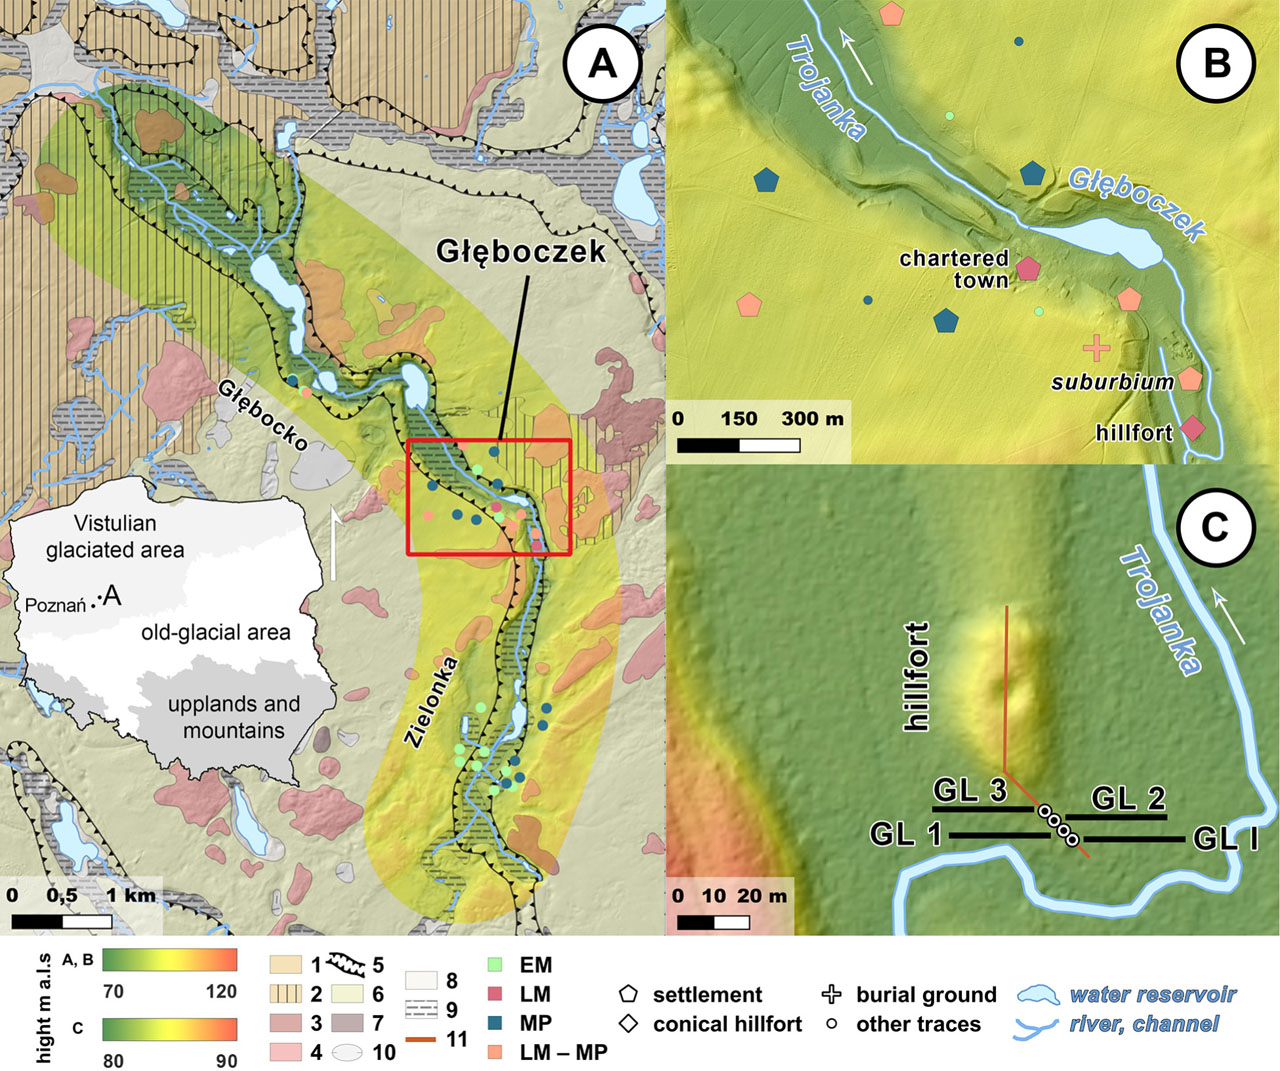
Fig. 1.
Maps of the studied area: A – the upper Trojanka valley, B – close-up view of Głęboczek sites, C – the conical hillfort and locations of the studied profiles. 1 – flat morainic plateau; 2 – undulating morainic plateau; 3 – terminal moraine (mostly depositional); 4 – terminal moraine (mostly pushed); 5 – edges of subglacial valley; 6 – outwash plain; 7 – kames; 8 – depression formed by the exarative activity of the ice sheet; 9 – valleys floor; 10 – peat plain; 11 – cross-section; EM – Early Middle Ages; LM – Late Middle Ages; MP – Modern Period.
The objective of this paper is to identify the processes and conditions governing mire evolution in the subglacial valley of the Trojanka River in the Zielonka Forest using a lithological approach. The research is based on sediment cores from the base of a medieval conical hillfort (site ID: PL.1.9.ZIPOZ.NID_A_30_AR.37787). The scale and significance of natural factors and the potential human impact on lithological records are assessed.
Research area
The studied core materials were collected in Głęboczek, a village in the Zielonka Forest, in the Murowana Goślina municipality, 25 km northeast of Poznań (the capital city of the region), on the Gniezno Lakeland (central-western Poland). The forested environment contrasts with the rest of the Lakeland area, which has been highly transformed by anthropogenic factors (Kondracki 2013). This contrast results from the establishment of the Zielonka Forest Landscape Park in 1992, which protects the Vistulian Glaciation landforms, forest, wetlands and aquatic habitats within its environs.
The Zielonka Forest is located in the SzczecinŁódź-Miechowo synclinorium, which is covered by Quaternary deposits. The modern young-glacial relief of the area is a summary of Late Vistulian and Holocene processes, together with human-induced environmental changes (Kostrzewski et al. 2021). Glaciotectonic activity formed push-moraines composed of glacial till, gravel and sand, whereas fluvioglacial processes created outwash plains and a system of subglacial valleys with an NW–SE orientation, infilled with Holocene sediments (Sydow 2004). The glacial deposits are approximately 30 m thick. Fluvioglacial landforms dominate the southern, central and northern parts of the forest. The plains are dissected by glacial valleys and moraines. Głęboczek is situated in the Trojanka River sub-glacial valley, between two moraine systems of the Dzwonowo-Lednogóra and Skoki-Janowiec oscillations, oriented SW–NE (Fig. 1A). The detailed morphogenesis of the glacial landforms in the area is difficult to reconstruct (Ewert-Krzemieniewska 2014). To the west of the valley, kames and depressions formed by the exarative activity of the ice sheet occur. Holocene lacustrine, alluvial and wetland deposits predominantly fill negative landforms (Sydow 2004). The Trojanka River subglacial valley is composed of peat and gyttjas up to 5.19 m thick (Ilnicki et al. 2017). Following the retreat of the ice sheet, the morphogenic activity of rivers, lakes and wind became more prominent. Deluvial deposits within the valley consist of sands and clays eroded from moraines and outwash plains. Land denivelation reaches up to 50 m. The highest elevations occur on push moraines, whereas the lowest are located in valleys and closed depressions. Human activity, particularly land cultivation and deforestation, contributed to land denudation. The development of hydrotechnical infrastructure, residential buildings and recreational areas has also influenced natural morphometric features. At the same time, nature protection measures, forest policies and afforestation since the 1940s have helped preserve landforms in the more remote parts of the forest (Macias et al. 2022).
The Trojanka River is a natural right-bank tributary of the Warta River, approximately 20 km in length. Its spring is located south of the Zielonka village (Fig. 1A). The river is supplied by rainfall and snowmelt (Kocięcka et al. 2023). The average runoff equals approximately 1 l ∙ s−1 ∙ km−2, which is three times lower than the regional average (Liberacki, Stachowski 2008).
Today, Głęboczek is surrounded by fresh mixed forests and temperate coniferous forest cover higher parts of the uplands and subglacial valley slopes. These forests developed on rusty soils. The floors of the subglacial valleys are dominated by alder forests that grow on the peat soils of bogs. Overall, the forest ecosystem is currently not strongly degraded.
Historical settlement in Głęboczek
The oldest known traces of human activity in the area date to the Late Neolithic period (Krzepkowski et al. 2017). Additional evidence comes from the IV–V period of the Bronze Age, associated with funeral findings such as urns, vessels and bone tools, alongside anthropological material. In the Trojanka valley, there are also Przeworsk culture settlements, though no remains from the Roman period have been documented.
Most archaeological traces in Głeboczek comprise 12 sites dating from the Early Middle Ages (EM) to the Modern Period (MP; Jasnosz 1982). The most significant is the Late Middle Ages settlement complex (Krzepkowski et al. 2017). Most of these sites are located on the left slope of the subglacial valley. The settlement complex includes: two left-bank and three right-bank settlements, a former chartered town, a burial ground, a parish church of unknown patronage and a conical hillfort with a suburbium (site ID: PL.1.9.ZIPOZ.NID_E_30_AR.2533370) on the peninsula in a subglacial valley southeast of the village (Fig. 1B). In contrast, most archaeological findings in the neighbouring Zielonka village are dated to the EM, some to the MP with none to the LM, and overall fewer sites from each period than in Głęboczek (Fig. 1A; Jasnosz 1982).
The main historiography source for Głęboczek is the publication by Chmielewski et al. (1982). The first written mention of the area is from AD 1354 and refers to the village of Glamboyczecz. From the 15th to the mid-16th centuries, a chartered town existed there (site ID: PL.1.9.ZIPOZ. NID_E_30_AR.2533313), although neither the location act nor the withdrawal have survived. Regardless, medieval citizens of Głęboczek held rights to cultivation and grazing, and a mill also functioned there. The land was deforested, and timber was sold, as documented by records of the construction of a castle in Kórnik (Kaczor 2021). The parish church functioned from the first half of the 14th century until AD 1793 (Kozierowski 1935). The reasons for the town’s cessation remain unclear, as historical and archaeological records do not provide sufficient explanation (Brust 2019).
The previously mentioned conical hillfort (Fig. 1C) functioned approximately from the 13th to 15th centuries as a small guardhouse (Jasnosz 1982). Today, the remaining conical embankment is overgrown with trees and surrounded by mire. According to the landscape changes map (Hładyłowicz 1932), woodland succession occurred during the MP on previously cleared lands. It is probable that the peninsula initially was an island that was later connected to the mainland by a dyke during the hillfort’s occupation (Brust 2019). To the north on the same dyke, a settlement adjoining the hillfort was established (Jasnosz 1982).
Materials and methods
Fieldwork and laboratory analysis
This research was based on sediment cores taken from the mire and from the base of the conical hillfort in Głęboczek. Prior to coring, the area was probed by a 1 m geological rod. The most representative site was located southeast of the hillfort near the river (Fig. 1C).
During fieldwork, four sediment cores were collected. An instorf sampler (Eijkelkamp) was used to retrieve the first core, employing two chamber sizes: 100 cm × 10 cm (for material from 0 cm to 100 cm) and 50 cm × 5 cm (for material from 100 cm to 170 cm). The core was designated GL I (Fig. 1C). The remaining three cores were taken from the base of the hillfort along a NW–SE transect using a soil auger (chamber size: 10 cm × 5 cm). These cores were designated GL 1 (depth: 120 cm), GL 2 (depth: 105 cm), GL 3 (depth: 90 cm). The distances between the cores, starting from GL I, were 3 m, 4 m and 3.5 m, respectively.
High-resolution laboratory analyses were conducted. The first step involved submitting the samples of GL I for radiocarbon (14C) dating to establish an absolute chronological framework. Subsequently, cores GL I and GL 1 to 3 were analysed for loss-on-ignition (LOI) and grain-size distribution for the mineral fraction. These analyses aimed to characterise the lithology of the sediments, which allows the course and conditions of how the studied deposits evolved to be reconstructed. The Troels-Smith method (1955) was conducted to classify peat type by identification of humicity and components.
Absolute chronology
Samples of plant macroremains were collected at 4 cm intervals from the GL I core, and nine of the most representative samples were submitted for 14C dating (Table 1). The analyses were performed in the Poznan Radiocarbon Laboratory using the Accelerator mass spectrometry (AMS) method (Goslar 2015). A Bayesian age-depth model was compiled based on 5 of the 9 samples, using OxCal 4.4 software (Bronk 1995). Four dates were excluded because they did not align with the model trajectory. The P_Sequence function was used with the following parameters: k0 = 0.5, log10 (k/k0) = 1, interpolation = 0.5 cm (Bronk 2008).
Table 1.
AMS radiocarbon dating of the GL I profile.
| Sample name | Depth | Age 14C | Calibration | Material dated |
|---|---|---|---|---|
| [cm] | [14C BP] | [cal. AD] | ||
| Poz-171294 | 51–52 | 285 ± 30 |
| Alnus sp.: fruit, three seeds |
| Poz-171295 | 62–63 | 345 ± 30 | 1470–1637 (95.4%) | Alnus glutinosa: small twigs, seed |
| Poz-171330 | 94–95 | −347 ± 24 |
| Bud scale, seed |
| Poz-174243 | 125–126 | 330 ± 30 | 1480–1640 (95.4%) | Plant remains |
| Poz-174556 | 134–135 | 710 ± 30 |
| Plant remains |
| Poz-170386 | 146–147 | 355 ± 30 |
| Alnus sp.: leaves, bark; coal |
| Poz-170388 | 148–149 | 350 ± 30 |
| Plant remains |
| Poz-170389 | 150–151 | 850 ± 30 |
| Alnus sp.: bark, twig |
| Poz-170390 | 166–167 | 340 ± 30 | 1474–1638 (95.4%) | Alnus sp.: bud scale, leaf, bark, fruit |
Loss-on-ignition
This analysis (Heiri et al. 2001) determines the percentage of organic matter (LOI550), calcium carbonate (LOI950) and ash without CaCO3 (Ac). The method is characterised by a low susceptibility to external factors. The results are used to identify peat and mineral sediments (Okruszko 1994) and gyttjas (Ilnicki 1979). The classification of peat and mineral sediments is as follows: mineral deposits (MM; LOI550: < 10%), organic-mineral deposits (O-M; LOI550: 10–20%), unsilted peat (Ta; LOI550: >75%), slightly silted peat (Tb; LOI550: 50–75%), very silted peat (Tc; LOI550: 20– 50%); while gyttja classes used in this paper were marked as: organic gyttja (Gya; LOI950: <20%, Ac: <60%), organic-clay gyttja (Gyb; LOI950: <20%, Ac: 60–80%). The marking is an original proposal developed by the author.
The analysis was performed on 1 cm3 samples taken at 1 cm intervals from the GL I core and on each stratum of cores GL 1 to 3. Wet material was dried at 105°C for 24 h in an oven. Organic materials were combusted at 550°C for 4 h, and CaCO3 at 950°C for 2 h in a muffle furnace. Subsequently, chilled samples were weighed using a laboratory balance with an accuracy of 0.001 g. The remaining ash was subjected to grain-size analysis.
Grain-size analysis
The mineral admixtures of the GL I and GL 1 to 3 cores were cleared of organic matter and CaCO3 by LOI. Grain-size analysis was then performed using the laser diffraction method with a Mastersizer Hydro 2000 by Malvern Instruments. Dry samples were immersed in distilled water in closed polypropylene containers and left to soak for 24 h. The suspended material was then introduced into the analyser with distilled water as a dispersant. Diffraction was conducted under the following conditions: ultrasonic displacement of 16 µm, pump speed of 2500 rpm and an obscuration range of 5–15%.
The grain-size indicators were calculated using Gradistat v.8.0. (Blott, Pye 2001), an MS Excel macro. Statistical formulas were derived using the graphical method (Folk, Ward 1957): mean grain size (MZ), sorting (σI), skewness (SkI) and kurtosis (KG); as well as the methods of moments: mean grain size (MM1), sorting (MM2) and skewness (MM3). The Krumbein formula (Racinowski et al. 2001) was used to present grain-size values on the phi scale. Sediments were classified following the Udden (1914) and Wentworth (1922) systems. Mineral sediments and admixture components were designated using the symbols proposed by Szmańda (2011): gravel (G), sand (S), silt (Fs) and clay (Fc); with textural qualifiers indicated by prefixes denoting: very fine (vs), fine (s), medium (m), coarse (c) and very coarse (vc). For example, very fine sand is donated as: vsS. The lithotype classification of mineral overbank alluvium was adopted from Szmańda (2011).
Cartographic and graphical materials
Cartographic materials and cross-section data were obtained from the Head Office of Geodesy and Cartography (GUGiK) and the Polish Geological Institute (PGI). Maps were prepared using QGIS 3.40.12 Bratislava. Lithological diagrams were created using C2 Data Analysis v.1.8.0 (Juggins 2007). All tables, scatter plots, and cross-sections were created in MS Excel.
Results
The GL I core is composed of deposits rich in organic matter. Based on LOI, several sediment classes were identified (Ilnicki 1979, Okruszko 1994): mineral (MM, 17.39%), organic-mineral (O-M, 2.17%), peat (Ta, 17.39%), slightly silted peat (Tb, 43.48%), very silted peat (Tc, 10.87%), organic gyttja (Gya, 5.80%) and organic-clay gyttja (Gyb, 2.90%). Nine lithofacies were distinguished based on grain-size indicators and LOI results (Table 2, Fig. 2).
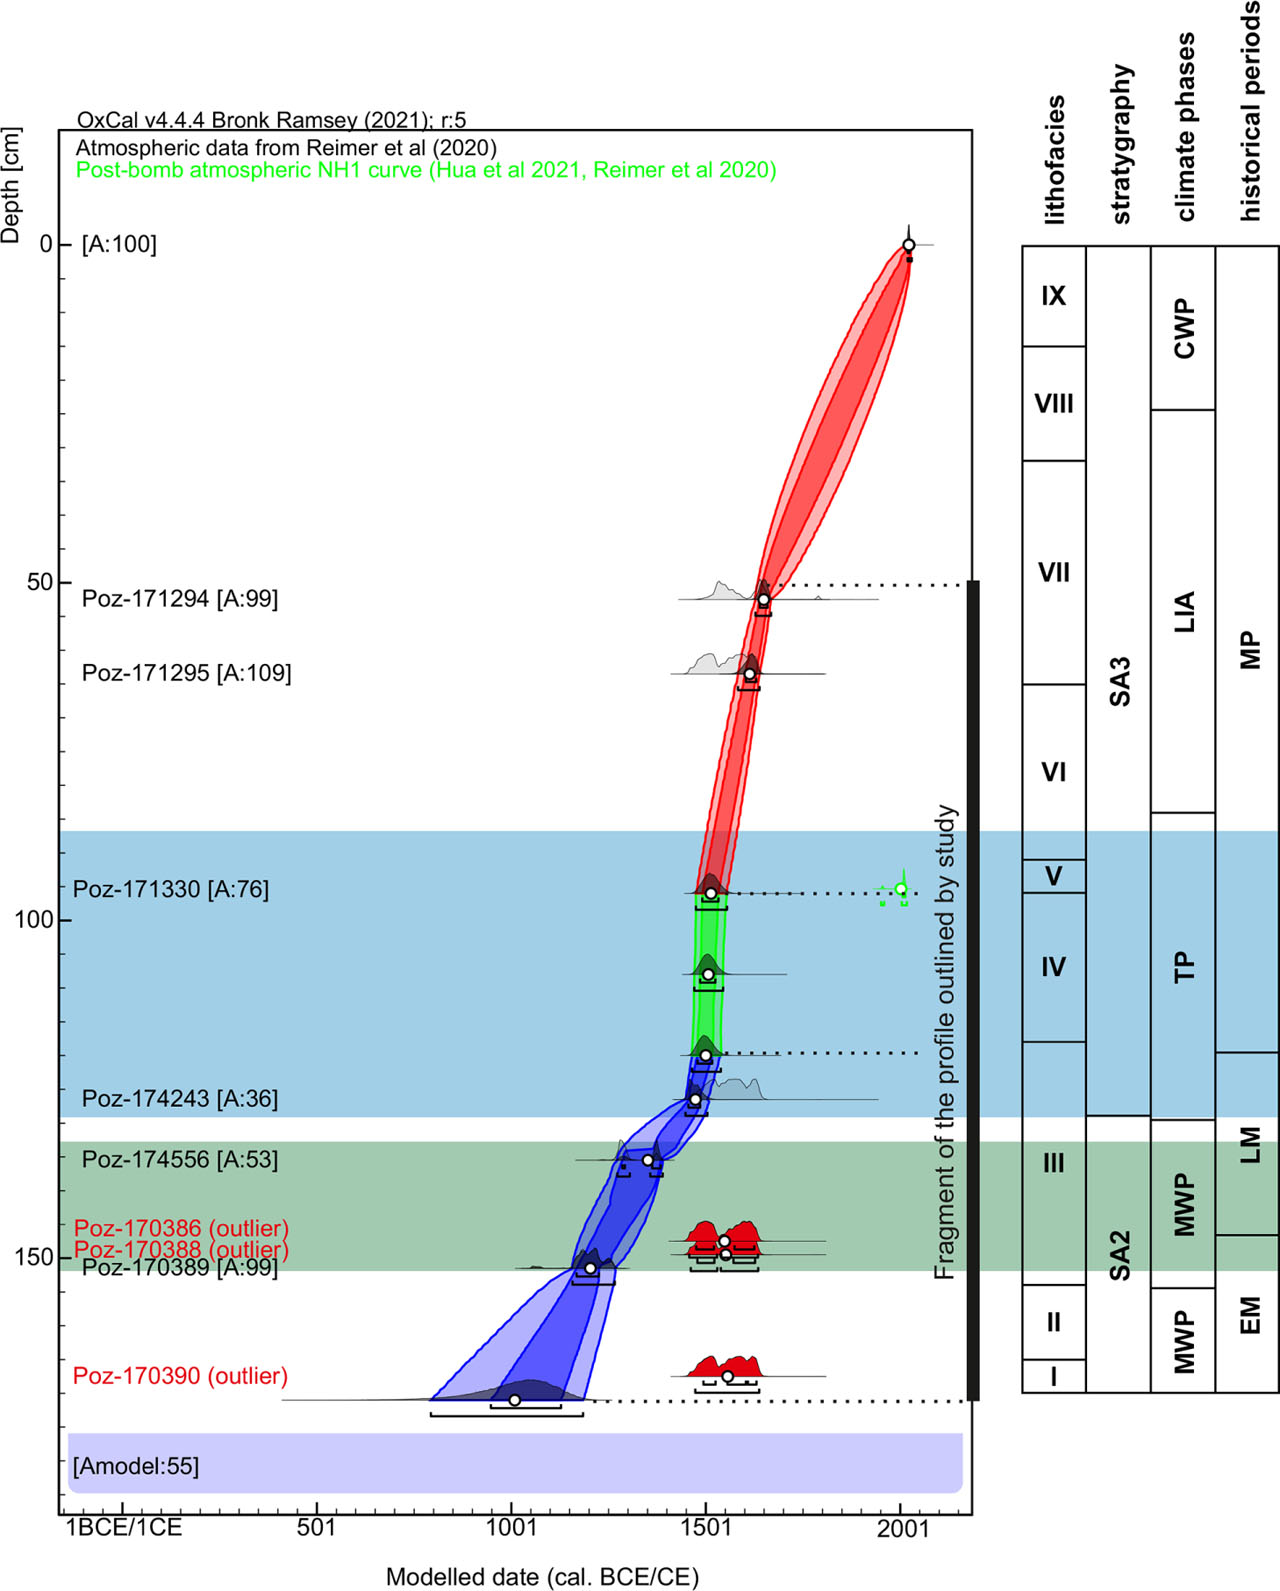
Fig. 2.
Lithological diagrams of studied profiles including: grain-size parameters of Folk and Ward (1957), LOI results, particle classes (Udden 1914, Wentworth 1922) and calibrated age. The course of the cross-section is marked on Figure 1C.
Table 2.
Characteristics of GL I litofacies.
| Facies | Depth | Age | Sediment accumulation ratio | Organic matter content LOI550 | CaCO3 content LOI950 | Gravel | Sand | SiltFs | ClayFc |
|---|---|---|---|---|---|---|---|---|---|
| [cm] | [cal. AD] | [cm ∙ yr−1] | [%] | ||||||
| I | 165–170 | 1020–1070 | 0.30 | 16.06–46.30 | 0.48–6.47 | 0.00 | 13.21–45.41 | 54.59–86.79 | 0.03–0.74 |
| II | 154–165 | 1070–1180 | 0.15 | 32.13–47.82 | 1.86–9.39 | 0.00 | 17.55–36.12 | 63.88–82.45 | <0.60 |
| III | 118–154 | 1180–1502 | 0.10 | 54.69–88.06 | 0.47–10.81 | 0.00 | 23.20–46.00 | 54.00–76.80 | <0.45 |
| IV | 96–118 | 1502–1533 | 0.84 | 0.69–7.29 | 0.18–4.58 | <2.83 | 24.42–85.95 | 14.05–75.58 | <0.06 |
| V | 91–96 | 1533–1541 | 0.63 | 20.06–43.40 | 0.48–5.52 | 0.00 | 55.25–69.05 | 30.95–44.75 | <0.22 |
| VI | 65–91 | 1541–1610 | 0.32 | 6.88–74.87 | 0.26–0.88 | <0.17 | 14.73–93.25 | 6.75–85.27 | <0.01 |
| VII | 32–65 | 1610–1800 | 0.19 | 58.32–82.16 | 0.73–2.04 | 0.00 | 2.78–27.25 | 72.75–97.22 | <0.01 |
| VIII | 15–32 | 1800–1918 | 0.09 | 71.75–85.02 | 0.71–1.33 | 0.00 | 3.35–32.46 | 67.54–96.65 | <0.16 |
| IX | 0–15 | 1918 to present | 0.05 | 66.47–74.42 | 1.10–2.01 | <2.59 | 30.81–84.49 | 15.51–69.19 | <0.01 |
The absolute chronology of the profile spans from 850 ± 30 BP (1157–1267 cal. CE) to modern times). The age-depth model (Fig. 3) has a model agreement index (Amodel) of 55%. It is slightly below the recommended minimum (Bronk 1995, 2008) due to two samples (Poz-174243, Poz-174556). However, the high Amodel values of the remaining samples justify the use of the model. Measurement uncertainty increases with increasing depth. Outliers (Poz-170386, Poz-170388, Poz-170390) can be addressed by bioturbation or redeposition of eroded material (cf. Piotrowska 2009).
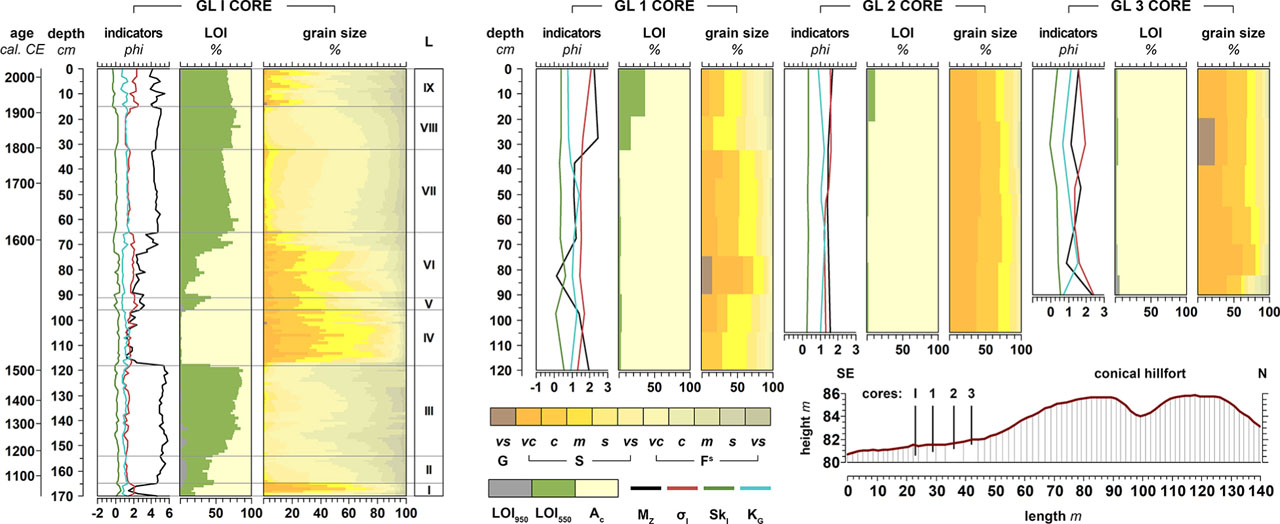
Fig. 3.
Age-depth model of the GL I profile with lithofacies (I–IX) and periodisation (Starkel et al. 2013, Przybylak 2011). SA2, SA3 – Subatlantic and its sub-zones; MWP – Medieval Warm Period; TP – Transitional Period; LIA – Little Ice Age; CWP – contemporary warming period; EM – Early Middle Ages; LM – Late Middle Ages; MP – Modern Period; green area – time conical hillfort was in active use (Jasnosz 1980); blue area – time-chartered town was in active use (Chmielewski et al. 1986).
Lithofacies I (LI, Fig. 2) – organic-mineral series with a thin layer of Tc at the base, and Gya at the top. The mineral matter consists of cS i mS (1.44–4.68 phi) with a coarser Fs admixture (Fig. 4). The sediments are predominantly poorly sorted (1.48–2.12 phi), right-skewed (0.09–0.58 phi) and platykurtic (0.81–1.32 phi).
Lithofacies II (LII, Fig. 2) – gyttja series (Lf41, Sh3) contains Gya and Gyb and Tc, at the top. The mineral matter consists of vcFs i cFs (4.68–5.55 phi) with finer Fs admixture (Fig. 4). The sediments are predominantly poorly sorted (1.12–1.55 phi), right-skewed (0.11–0.37 phi) and platykurtic (0.94–1.42 phi).
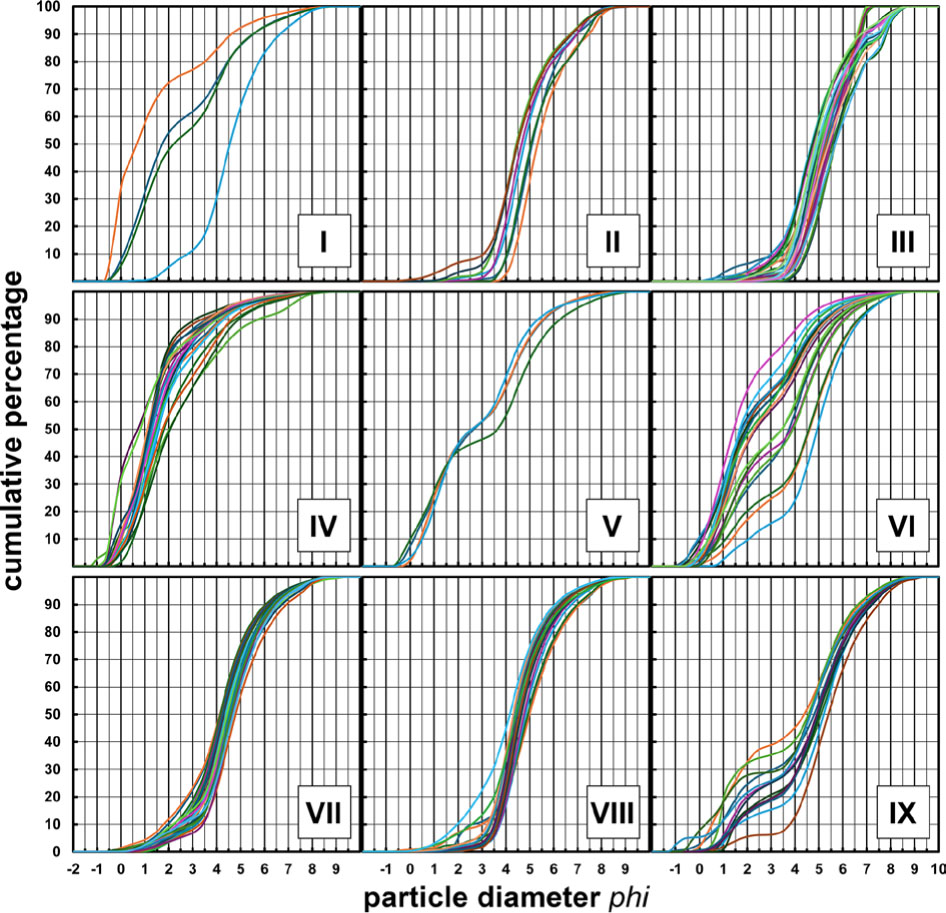
Fig. 4.
Cumulative curve of mean grain-size distribution of the GL I lithofacies at the arithmetic scale.
Lithofacies III (LIII, Fig. 2) – peat series (154–138 cm: Sh3, Th42; 122–138 cm: Sh2, Th42, Tb+; 118–122 cm: Sh1, Th32, Gmin1) contains Tb gradually replaced with Ta at the top. There are two thin layers of Gya. The mineral matter resembles that of LII (4.89–5.86 phi). The sediments are predominantly poorly sorted (0.88–1.56 phi), right-skewed (−0.10 to 0.33 phi) and predominantly mezokurtic (0.78–1.44 phi).
Lithofacies IV – sand series (LIV, Fig. 2). Three lithotypes were indicated: S (54.55%), SFs (40.91%), FsS (4.55%). The main fraction is mS (1.17–5.40 phi) mixed with sS, vsS and vcFs (Fig. 4). The sediments are predominantly poorly sorted (1.25–2.24 phi), very finely skewed (−0.06 to 0.47 phi), and a transition in kurtosis from meso- to very platykurtic (0.89–1.65 phi).
Lithofacies V (LV, Fig. 2) – peat series (Sh3, Th41) contains Tc with Gyb at the base. The mineral matter consists of sS (2.71–3.21 phi) with mS, cS and cvFs admixture (Fig. 4). The sediments are very poorly sorted (1.94–2.44 phi), left-skewed (−0.14 to 0.17 phi) and platykurtic (0.72–0.80 phi).
Lithofacies VI (LVI, Fig. 2) – sand/peat series (91–71 cm: Sh3, Th41, Gmin+; 71–65 cm: Sh2, Th42) covers the transition between the mineral base (MM, O-M) and organic top (Tb, Tc). The mineral matter (Fig. 4) consists of sS and vsS and recedes to vcFs at the top (1.88–4.77 phi). The sediments are predominantly poorly and very poorly sorted (1.67–2.17 phi), very fine and coarse skewed (−0.26 to 0.40 phi) and platykurtic (0.76–1.39 phi).
Lithofacies VII (LVII, Fig. 2) – peat series (Sh3, Th41) contains Tb and two thin layers of Ta. The mineral matter consists of vcFs (4.03–4.95 phi) with finer S and Fs admixtures (Fig. 4). Sediments are predominantly poorly sorted (1.27–1.65 phi), symmetrical (−0.07 to 0.16 phi) and leptokurtic (1.21–1.50 phi).
Lithofacies VIII (LVIII, Fig. 2) – peat series (Sh3, Th41) contains Tb that transforms into Tc at the top. The mineral matter consists of vcFs (4.46–5.09 phi) with finer Fs admixture (Fig. 4). The sediments are predominantly poorly sorted (1.08–1.63 phi), varying between symmetrical and fine distribution (−0.002 to 0.304 phi) and leptokurtic (1.10–1.42 phi).
Lithofacies IX (LIX, Fig. 2) – peat series (Sh4) contains Tb. The mineral matter consists of vcFs (3.81–5.51 phi) with coarser S and finer Fs admixture (Fig. 4). The sediments are mainly very poorly sorted (1.63–2.56 phi), coarsely skewed (<–0.02 phi) and leptokurtic (0.64–1.40 phi).
Profile GL 1 – sand core (Fig. 2, Table 3) contains MM and O-M, and Tc at the top. The mineral matter are mainly poorly sorted (1.34–2.08 phi), very finely skewed (0.11–0.62 phi) meso-, leptokurtic and platykurtic in the roof (0.78–1.40 phi). The sediments are made of mS and sS (0.12–2.7 phi), are fine to the top, and are enriched with multifractional admixtures (Fig. 5).
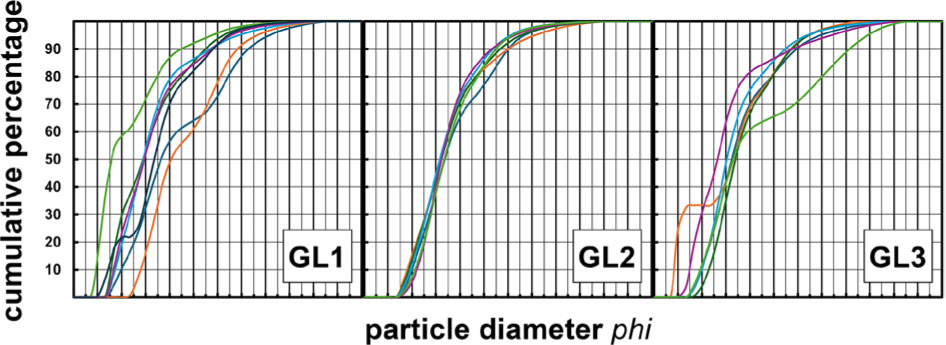
Fig. 5.
Cumulative curve of mean grain-size distribution of the GL 1 to 3 profiles at the arithmetic scale.
Table 3.
Characteristics of the GL 1, GL 2 and GL 3 profiles.
| Core | Depth | Organic matter content LOI550 | CaCO3 content LOI950 | Gravel | Sand | Silt Fs | Clay Fc |
|---|---|---|---|---|---|---|---|
| [cm] | [%] | ||||||
| GL 1 | 0–120 | 1.07–36.69 | 0.28–1.01 | <14.88 | 73.11–93.65 | 4.19–26.89 | <0.01 |
| GL 2 | 0–105 | 0.67–9.920 | 0.20–1.62 | 0.00 | 89.70–94.38 | 5.62–10.30 | <0.01 |
| GL 3 | 0–90 | 0.67–36.69 | 0.60–5.21 | <24.07 | 68.32–93.25 | 6.75–29.03 | <0.01 |
Profile GL 2 – sand core (Fig. 2, Table 3) contains MM, and is poorly sorted (1.23–1.62 phi), right-skewed (0.28–0.37 phi) and meso- to leptokurtic (0.89–1.26 phi). The sediments comprise mS (0.89–1.26 phi) with sS, vsS and Fs admixture (Fig. 5).
Profile GL 3 – sand core (Fig. 2, Table 3) contains MM and is poorly sorted (1.35–2.41 phi) and very finely skewed (−0.01 to 0.56 phi), with an uneven kurtosis (0.68–1.52 phi). The sediments are composed of mS, cS and sS (0.90–2.31 phi) with multifractional admixture (Fig. 5).
Interpretation and discussion
The studied profiles from the mire and conical hillfort near Głęboczek represent peat deposits with fluviogenous mineral admixtures (GL I) and slope residues (GL 1-3). This differentiation reflects the valley’s morphology, the fluvial activity of the Trojanka River, peat sedentation and the presence of the hillfort. The impact of these factors varied under different climatic conditions, such as the Medieval Warm Period (MWP, from the 11th to mid-15th c.) and the Little Ice Age (LIA, from the mid-16th to mid-19th c.).
In the GL I profile, organic sediments dominate (LIII, LVII–LIX and partially LV–VI). Based on LOI results, the peat is predominantly silted (Okruszko 1994). The variation in organic matter content and grain-size parameters suggests transformations of the depositional environment (Tobolski 2000, Racinowski et al. 2001, Głowacki 2006, Davies-Vollum, Smith 2008). The increase in Ac values reflects either enhanced water flow and water-level fluctuations in the river or an increased supply of fine slope material from the hillfort (Rydelek 2005, Borówka, Brzozowska 2010, Borówka, Tomkowiak 2010, Domińczak, Okupny 2010, Twardy 2011, Kittel 2014, Okupny et al. 2016, Piech et al. 2018, 2024, Kittel et al. 2021), with values approximately 10–15% higher than in other parts of the Trojanka River Valley (Ilnicki et al. 2017).
Mineral admixtures within the organic series of the GL I profile exhibit similar MZ and σI values (i.e., poorly sorted coarser Fs). Decreasing grain-size with diminishing sorting (Fig. 6) resembles an overbank deposit of the 1st system, suspended palaeochannel deposits (Mycielska-Dowgiałło, Ludwikowska-Kędzia 2011), or levee deposits formed during flood-wave recession (Szmańda 2011) under a low-energy regime (Sly et al. 1983). Sediment asymmetry varies in the organic series. The increase in SkI values indicates enrichment of the fine-grain mineral matter (e.g., Folk, Ward 1957, Mycielska-Dowgiałło, Ludwikowska-Kędzia 2011, Piech et al. 2018, 2024, Ginter et al. 2023), which reflects a reduced velocity of the sediment-transporting medium (Racinowski et al. 2001). In contrast, the coarse-skewed values of LIX occur despite the presence of finer-grained admixtures. This pattern may result from a rapid rise in water level followed by a slow recession (e.g., Szmańda 2011, Szmańda et al. 2025). Temporal flooding is expressed as “jumping” MZ between extreme values and a concurrent increase in Ac values (Fig. 2), indicating frequent water-level fluctuations. The abrupt flattening of KG (Fig. 2) suggests rapid sediment deposition, whereas the mineral matter of younger-peat layers (e.g. LVII, LVIII) is leptokurtic, indicating homogeneous depositional conditions but simultaneously lower lithodynamic stability, that is, higher susceptibility to energetic changes (Racinowski et al. 2001, ).
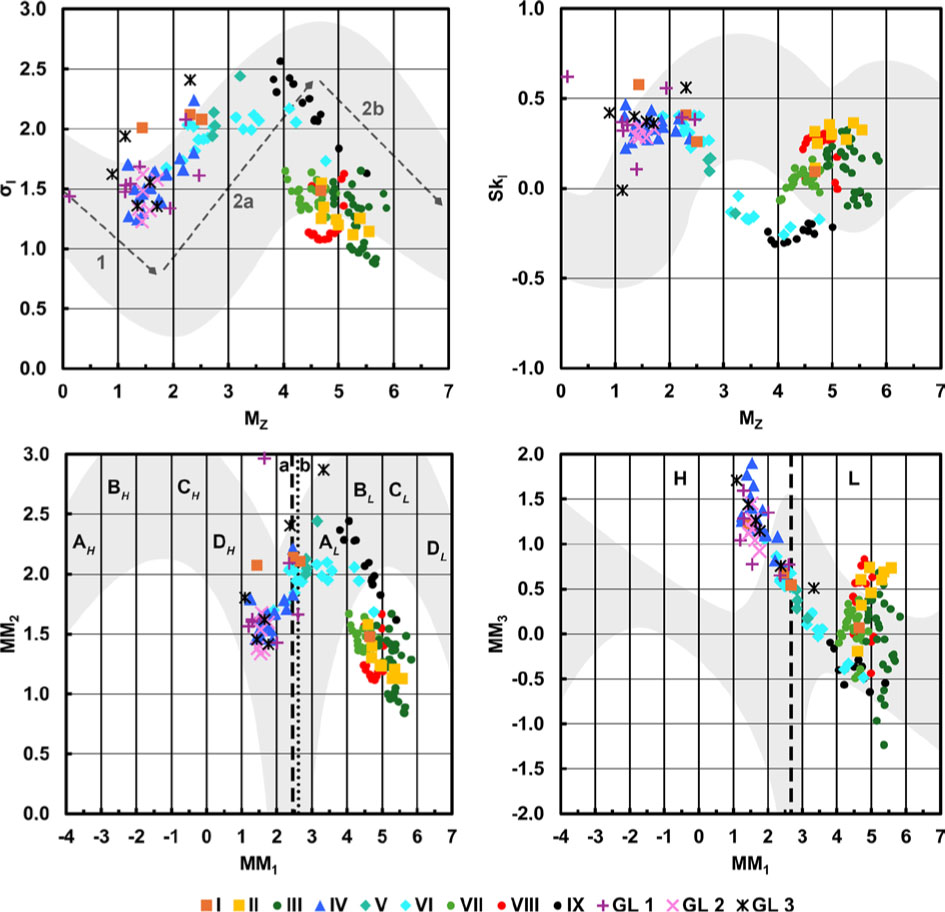
Fig. 6.
Grain-size parameter relationship plots for the GL I lithofacies (I–IX) and the GL 1 to 3 profiles. (Upper row) Coordinate systems (Mycielska-Dowgiałło Ludwikowska-Kędzia 2011), (lower row Lithodynamics interpretation (Sly et al. 1983). Graphical indicators at the phi scale: MZ – mean grain-size; σI – sorting; SkI – skewness; moments indicators at the phi scale: MM1 – mean grain-size; MM2 – sorting; MM3 – skewness; 1 – channel deposits (1st syst.); 2a – overbank deposits (2nd syst.); 2b – overbank-pool deposits (1st syst.); A – accumulation conditions; B, C – transport conditions; D – erosion conditions; H – high energy regime; L – low energy regime; a – skewness divide; b – max kurtosis; gray – distribution of samples researched by Mycielskiej-Dowgiałło (2007).
The mineral series (LIV), characterised by low organic matter and CaCO3 content (Table 2), formed during an abrupt environmental change in the valley. The rapid transition from Ta at the top of LIII to MM with cS at the base of LIV suggests the occurrence of an extreme event. According to the literature, the high composition of minerals in peat may result from slope and aeolian processes, flooding or anthropopres-sure (Rydelek 2005, Borówka, Brzozowska 2010, Twardy 2011, Kittel 2014, Okupny et al. 2016, Pietruczuk 2016, Kittel et al. 2021 Piech et al. 2024). Considering the proximity of the GL I site to the river channel, which may have been similar in position in the 16th century (due to topographic narrowing of the valley in this section), the mineral series is most likely of alluvial origin. Increasing MZ values accompanied by decreasing sorting (Fig. 6) resemble the 2nd system of overbank alluvium (Mycielska-Dowgiałło, Ludwikowska-Kędzia 2011), which may reflect deposition by saltation and/or grading suspension under a low-energy regime (Szmańda 2011). These processes produced the rhythmic (pansymmetrical) structure of the sediments. Probably during this period, several high-water stages or floods occurred (Twardy 2011, Szmańda et al. 2025). In the subsequent cycles (LV and LVI) grain size reduces alongside increasing LOI550 values (Fig. 2). This indicates a successive decrease in the magnitude of flood cycles, although the trend is not entirely uniform. These processes occur rapidly over a short time span, as reflected in the highest sediment accumulation ratio (SAR) values (>0.63 cm·yr−1; Table 1) observed in the entire profile. However, the thin gyttja layer in the base of LV (alongside a peak in LOI550 from 1.78% to 14.53%; Fig. 2) may suggest water stagnation (Rydelek 2005, Hildebrandt-Radke et al. 2011a, b, Pietruczuk 2016). The record of increased fluvial activity corresponds well with a phase of enhanced precipitation in the first half of the 16th century (Luterbacher et al. 2010, Przybylak et al. 2023, Wanner et al. 2022,), during which higher flood frequency has also been documented (Mudelsee et al. 2004, Ghazi et al. 2023, 2025).
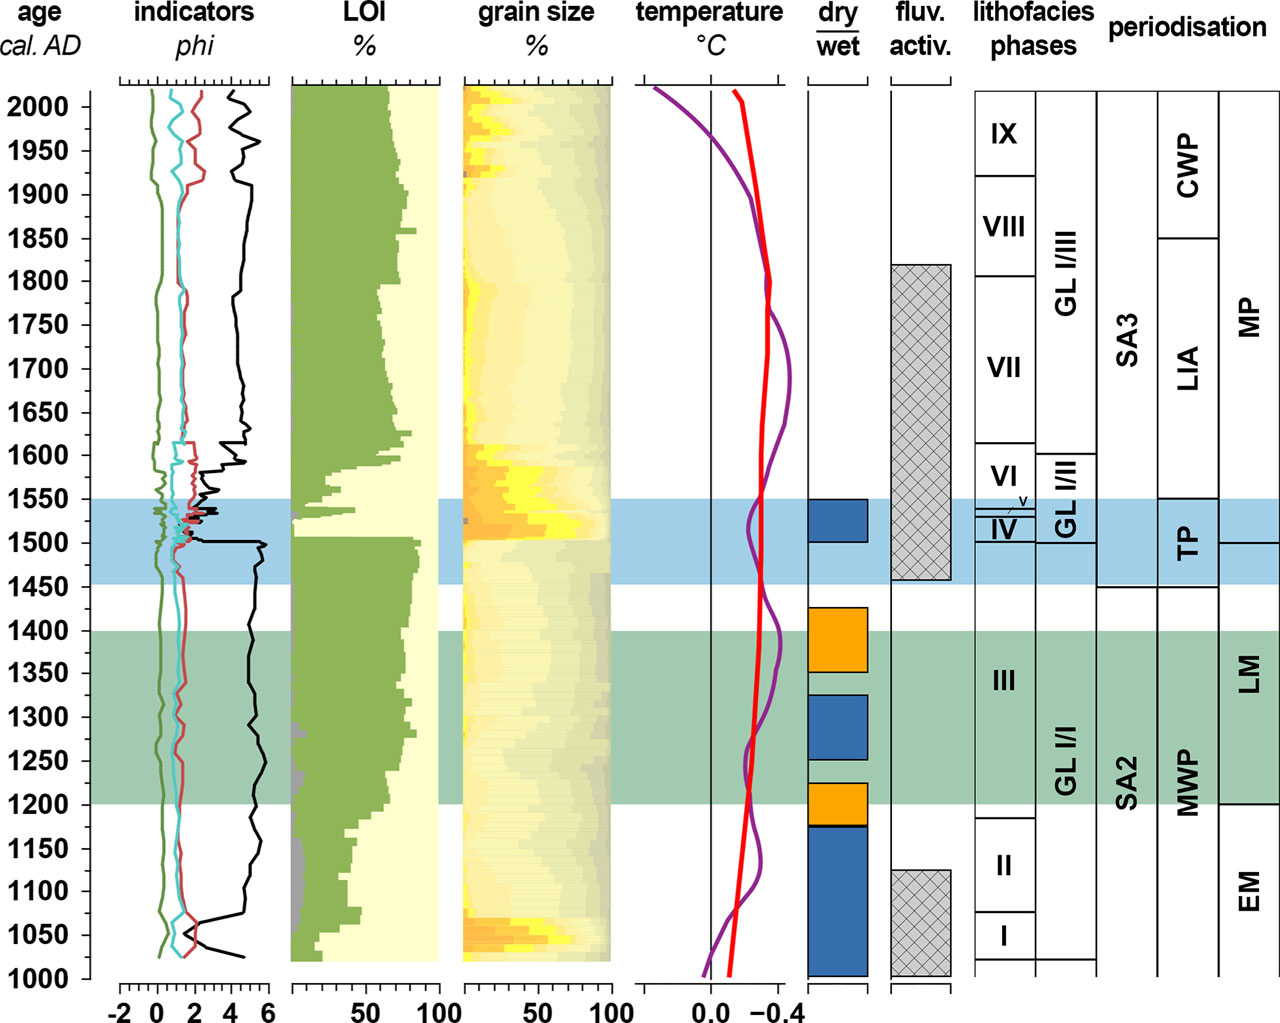
Fig. 7.
Comparison of lithological diagrams of the GL I core (symbols explanation at Fig. 2) with: Esper et al. (2025) mean temperature (red line) and Luterbacher et al. (2010) temperature reconstruction (magenta line); dry (orange boxes) and wet (blue boxes) climate phases (Starkel et al. 2013); periods of increased fluvial activity (Starkel 2011). Periodisation and blue/green areas explained at Figure 2. SA2, SA3 – Subatlantic and its sub-zones; MWP – Medieval Warm Period; TP – Transitional Period; LIA – Little Ice Age; CWP – contemporary warming period; EM – Early Middle Ages; LM – Late Middle Ages; MP – Modern Period.
The two oldest lithofacies may show yet another phase of evolution of the environment. LI consists of organic-mineral sediments characterised by a variable grain-size distribution (Fig. 4). Abrupt shifts in grain-size parameters and increased Ac values (Fig. 2) may indicate a change in competence of the sediment-transporting medium, resulting in rapid deposition of clastic material within the organic series (Davies-Vollum, Smith 2008, Borówka, Brzozowska 2010, Domińczak, Okupny 2010, Ishii et al. 2017, Sabatier et al. 2022). The relationship among grain-size parameters (Fig. 6) resembles sediments of the 2nd system (Mycielska-Dowgiałło, Ludwikowska-Kędzia 2011). However, the right-skewed distribution does not correspond well with typical overbank alluvium (Szmańda 2011). This may suggest a heterogeneous sediment origin without a single dominant process. The occurrence of gyttja indicates reduced fluvial activity or water stagnation, associated with higher humidity, elevated water levels and increased temperatures (Dean, Megard 1993, Tobolski 2000, Ilnicki 2002, Hildebrandt-Radke et al. 2011a, b, Okupny et al. 2016, Pietruczuk 2016, Sabatier et al. 2022). The mineral matter (LI) were transported mainly in suspension (Fig. 6), similar to the deposition of the 1st system (Mycielska-Dowgiałło, Ludwikowska-Kędzia 2011) and palaeochannel infills (Szmańda 2011). During this phase, water levels were higher and flow dynamics weaker. It is likely that a lake or small body of water developed as a result of water impoundment during flood-wave recession (LI), creating conditions favourable for CaCO3 accumulation. Over time, this water body became overgrown and gradually transformed into a mire.
Cores GL 1 to 3 exhibit a different lithogenesis from that of GL I. LOI550 values are low, and the dominant fraction is S (Table 3). This reflects the presence of the conical hillfort, from which material eroded and accumulated at the base of the slope. Similar LOI among these cores (Fig. 2) indicate relatively homogeneous depositional conditions (Twardy 2008, Piech et al. 2018, 2024, Ginter et al. 2023). However, the uppermost layer of core GL 1 is enriched in organic matter. This may be attributed to its greater distance from the hillfort and closer proximity to the mire, which favoured the formation and preservation of littoral organic matter (Smolska 2008, Domińczak, Okupny 2010).
The sedimentary features of GL 1 to 3 indicate a diluvial origin (Racinowski et al. 2001, Smolska 2008, Twardy 2008, Piech et al. 2018, 2024). The sands in these cores are poorly sorted (Fig. 6), suggesting energy instability of the transporting medium. The SkI and KG values (Fig. 6) are typical of non-current deposits, with a tendency towards pulsatory drops of transport velocity relative to the average. This results in enrichment of the material with finer grains. MZ values differ within cores GL 1 and GL 3, whereas GL 2 appears relatively monofractional (Fig. 2). These parameters also indicate a dominance of transport by saltation, while suspension transport occurred mainly in layers enriched in organic matter. The relationships among grain-size parameters (Fig. 6) resemble those of the 2nd system (Mycielska-Dowgiałło, Ludwikowska-Kędzia 2011). Although the deposits may initially resemble diluvial sands, they display more characteristics of diluvial sandy silts, as emphasised by decreasing Ski values (GL1 and GL3) accompanied by increasingly finer grain size (Twardy 2008). Grain size also decreases with increasing LOI550 values (Twardy 2003). The origin of the slope accumulation may be linked to rainfall events of varying intensity, with a predominance of infiltration or rainsplash and occasional weak, dispersed sheetwash, particularly after the hillfort was abandoned and vegetation subsequently overgrew its slopes (Smolska 2008, 2010, Majewski 2020). In addition, material eroded from the hillfort may have influenced the mire by supplying Fs and small increases in Ac values (Borówka, Brzozowska 2010, Domińczak, Okupny 2010).
Based on these results, the following three phases of environmental evolution can be distinguished in the Trojanka Valley in the vicinity of the conical hillfort.
Phase GL I/I (11th–16th c.; Fig. 7): sediments of this phase correspond to conditions of the second phase of the Subatlantic period (Starkel et al. 2013), including the MWP. Enhanced fluvial activity compared to the present day was recorded during the 11th century (LI), which is consistent with observations from other sites in Central Europe (Macklin et al. 2006, Starkel et al. 2013, Hoffmann et al. 2008, Starkel 2011) and resulted in the deposition of overbank alluvium. The presence of gyttja indicates the existence of a shallow water body, while increased Ac values in the 12th century may reflect higher precipitation levels (Przybylak 2011). Subsequent overgrowing of the reservoir and peat succession were likely driven by both natural processes and the active activity of the hillfort (13th–15th c.). The presence of the hillfort may also have triggered slope processes (Kittel 2014), supplying fine mineral admixtures to the peat. During this period, reduced fluvial activity is observed.
Phase GL I/II (16th–17th c.; Fig. 7): this phase is documented by written sources that describe agricultural activity and deforestation. It represents a transitional period between the MWP and LIA. The first half of the 16th century was characterised by increased precipitation (Przybylak 2011), which led to intensified fluvial activity and soil erosion across Central Europe (Macklin et al. 2006, Starkel et al. 2013, Dotterweich 2008, Starkel 2011) and in Poland as well (Mudelsee et al. 2004, Ghazi et al. 2023, 2025). These environmental conditions are recorded in the LIV mineral series of the GL I profile, which is rich in sand and poor in organic matter and CaCO3. In the second half of the 16th century, a more chaotic succession of organic substrate accompanied by an increase in fine-grained material (LV, LVI) is observed, likely reflecting reduced environmental dynamics. The increase in organic matter may be related to declining anthropogenic pressure on the hillfort peninsula (after the 15th century) and the decline of the chartered city (after the mid-16th century). During the MP, reduced human activity promoted afforestation (Hładyłowicz 1932), which may also have enhanced the supply and preservation of organic matter (Pietruczuk 2016, Czerwiński et al. 2019).
Phase GL I/III (from the 17th century to present; Fig. 7): This is a time of relatively undisturbed mire development, characterised by low-energy river flow and the absence of pronounced fluvial activity. Anthropopressure is not evident in the sedimentary record; the village and the parish (both functioning up to the 18th century) probably had limited impact on the catchment. Since the 17th century, an increase of coarser grain in the mineral admixture corresponds with general climatic cooling that culminated in the early 19th century (Przybylak 2011). From the 20th century onwards, distinct changes in grain-size parameters are observed, although increases in Ac values do not initially correspond to these changes. During this time, minor water-level rises likely occurred and/or were influenced by human activities such residential and recreational construction, and hydroengineering work within the catchment (Miler et al. 2001, Ilnicki et al. 2017, Okoński 2024).
Conclusions
Lithological research of the mire at the base of the conical hillfort (13th–15th centuries) in the subglacial valley of the Trojanka River provided information about the evolution of the environment. The analysed profiles represent slope sediments (GL 1 to 3) and fluviogenous matter in peat (GL I). LOI analysis allowed for the classification of the material, and sedimentological analysis allowed grain-size parameters to be recognised. Subsequently, the recognition of processes and conditions that lead to sediment accumulation was performed. Based on the reconstruction of the evolution of the mire, the main conclusions of this study are:
the present-day mire has been developing since 17th century and lies on an overbank alluvial series (16th–17th centuries) that covers an underlying peat series (12th–16th centuries) overlying the residues that developed during the overgrowth of a shallow palaeodepresion (11th–12th centuries);
two periods of higher fluvial activity were distinguished in the first half of the 11th century (LI) and from the 16th–17th centuries (LIV–LVI). The first period fits conditions of higher fluvial activity during the 11th century (Starkel et al. 2013). The second period is associated with the transition between the MWP and LIA, where the peak of activity is dated to the first half of the 16th century and is characterised by higher precipitation frequency (Przybylak 2011, Ghazi et al. 2023, 2025);
an increase in organic material content (LOI550) associated with the increasingly finer grain size of mineral admixtures (MZ values increase, SkI, KG values decrease) suggests stable sedimentary conditions (as in 13th, mid-15th and 19th century);
the MWP has been recorded as an overall increase in organic matter (LOI550) with a transformation from organic-mineral sediments through gyttja to peat residue. Mineral matter is characterised as poorly sorted fine grains (MZ > 4 phi) that are usually enriched by a finer grain admixture (positive SkI values);
the beginning of the LIA (mid-16th century; Przybylak 2011) is marked by alternating increases of peat and mineral series, with the former having an advantage, suggesting unstable sedimentological conditions probably caused by temporal changes in river activity and erosion in the catchment;
after the 17th century (LVII), the environment reflects a lower diversity of catchment processes and climatic cooling, which favoured coarsening of the mineral matter until the 19th century (LVIII), a period characterised by stable lithodynamic conditions that enabled peat poor in silt;
the mineral admixture of the present-day peat (LIX) is distinguished by variability in grain-size indicators and a gradual increase of mineral matter caused by anthropogenic factors in the catchment and climate fluctuations since the 20th century;
the Trojanka River is a critical factor in the formation of mire. It is vulnerable to climate change, which leads to water-level changes and differing scales of mineral matter deposition (Ac values changes); and
the conical hillfort (13th–15th centuries) functions right transition between lake and mire phases. However, material from the hillfort is not clearly reflected in the peat deposits. This suggests a low slope process intensity, which is usually affected by sediment characteristics, hillside slope, landcover, climate and anthropopressure (Twardy 2008, Smolska 2010).
Acknowledgements
The author would like to thank the State Forests National Forest Holding of Poland for granting permission to conduct the fieldwork. The author is also grateful to the members and PhD students of Adam Mickiewicz University in Poznań for their invaluable assistance. Special thanks to Professor Jakub Niebieszczański and to PhD student Milena Zięba for their help during the fieldwork. The author would like to thank Professor Mariusz Lamentowicz for his help in collecting material for radiocarbon dating and Professor Piotr Kołaczek for constructing the age-depth model. The author is grateful to Professor Michał Woszczyk for providing access to the Laboratory of Geochemistry and Palaeoecology. The author would also like to thank Doctor Mariusz Bąk and PhD student Daria Wochal for their guidance in the Troels-Smith method and help in material classification. Finally, special thanks are due to Professor Iwona Hildebrandt-Radke for her support, methodological guidance, assistance during the fieldwork and access to the Sedimentological Laboratory. Her constructive comments and supervision significantly contributed to improving the quality of this paper. Expressions of gratitude to the reviewers for their constructive criticism and helpful suggestions.