
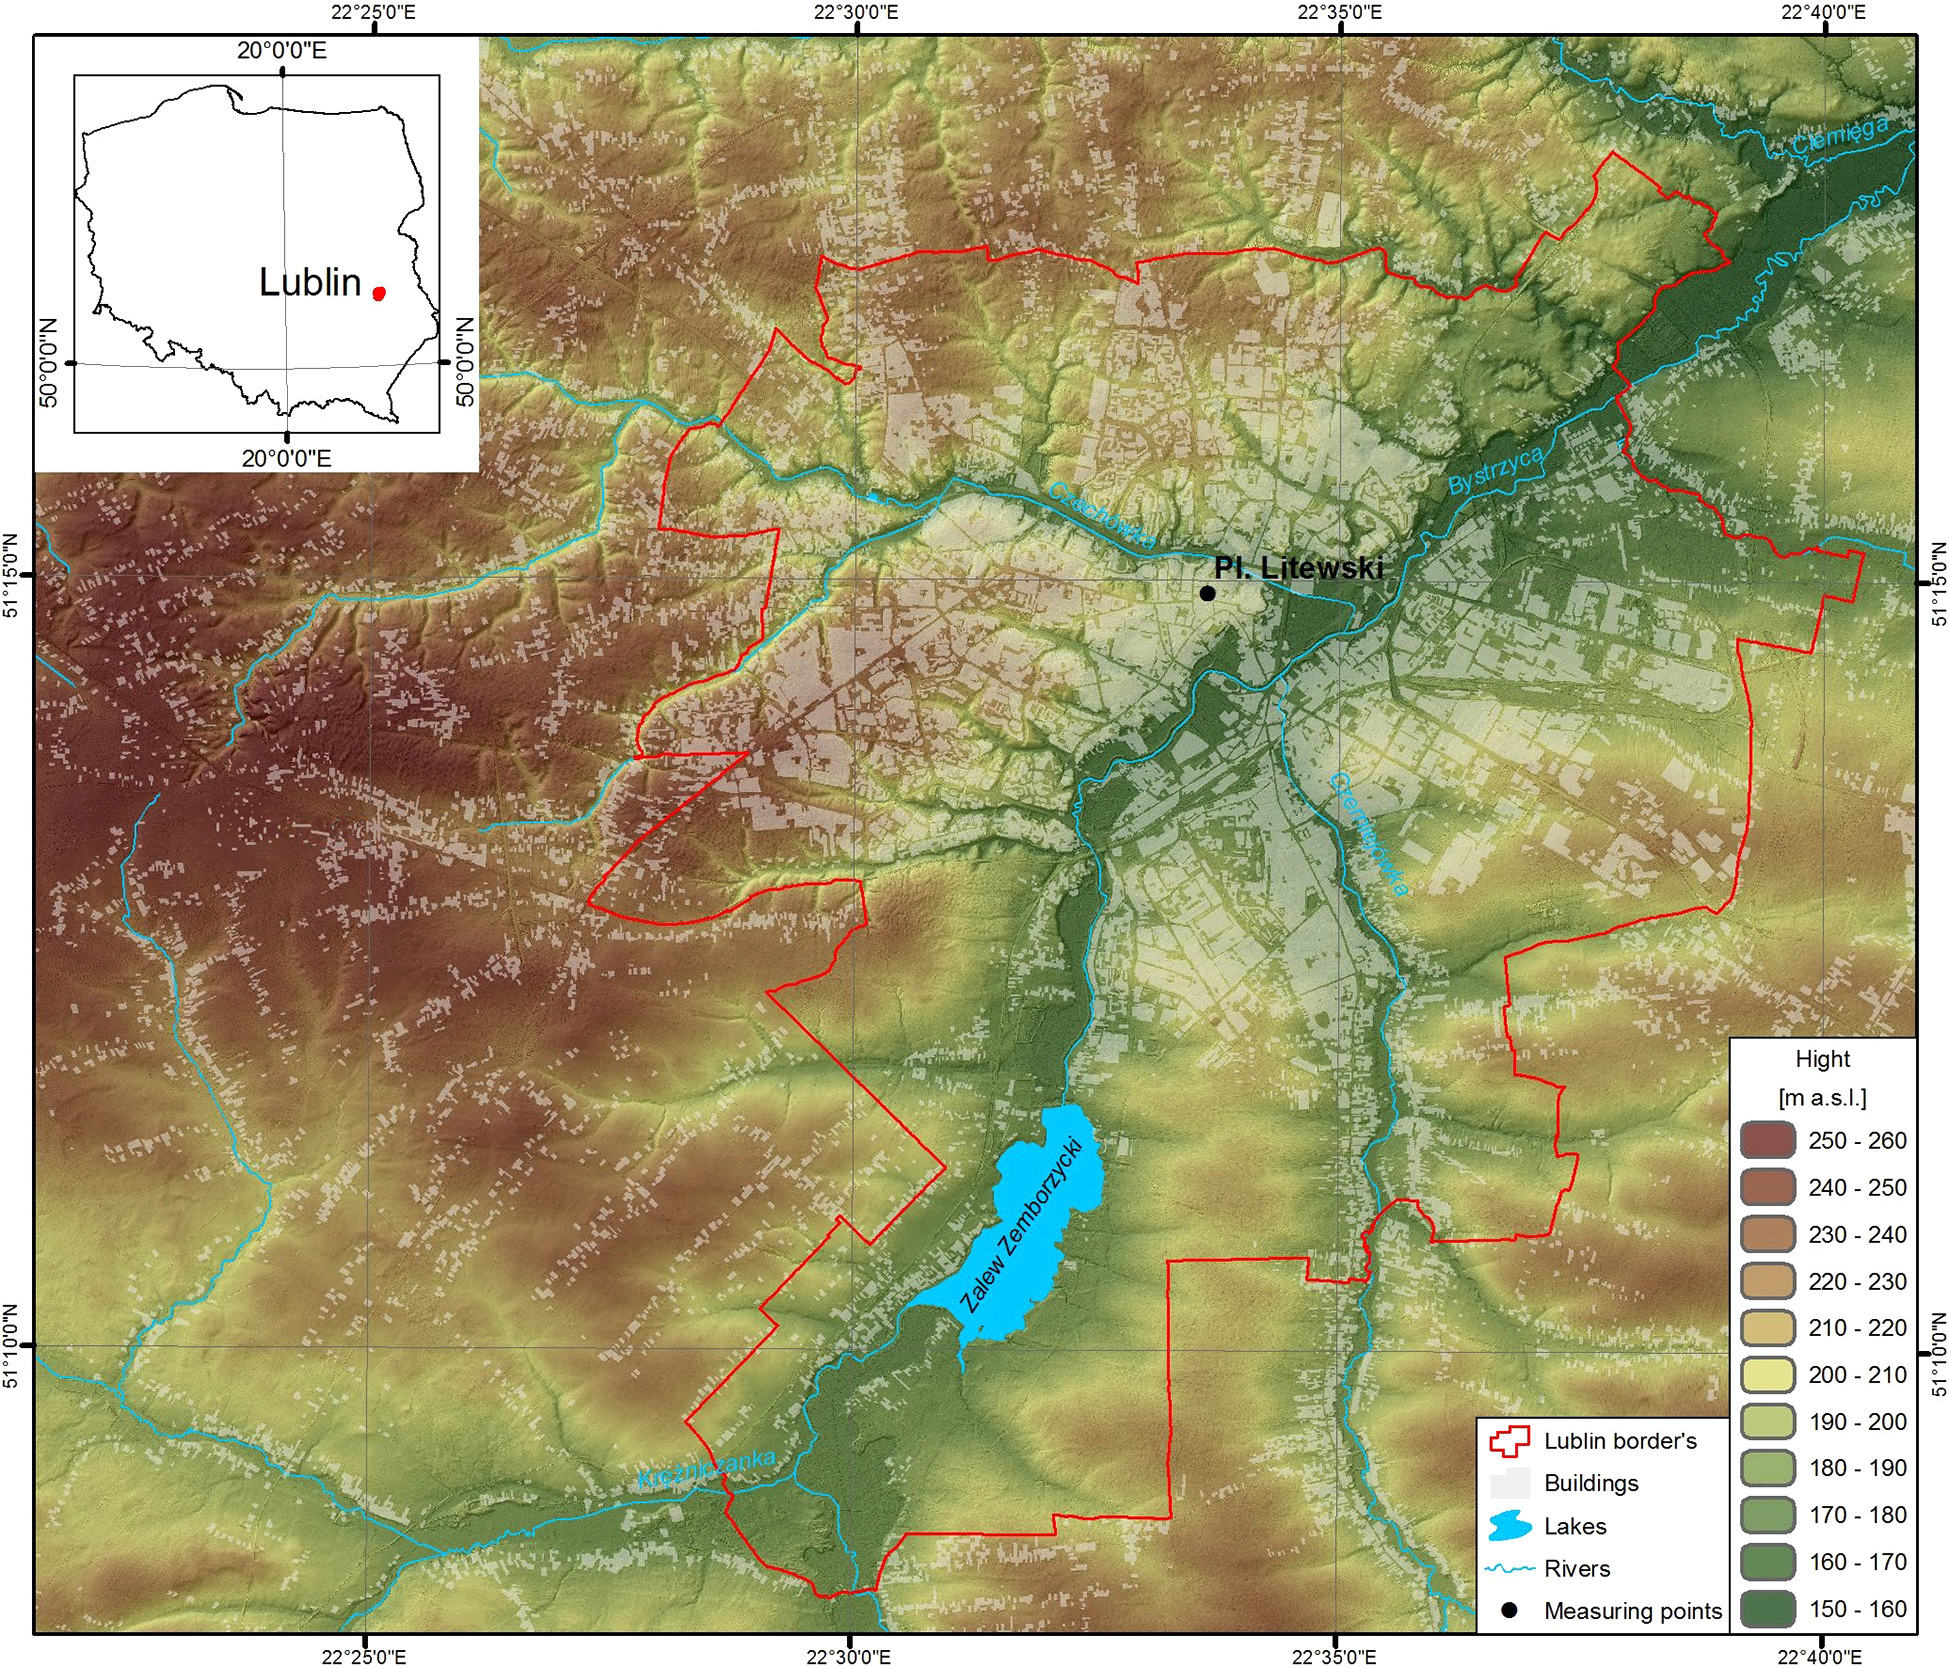
Fig. 1.
Location of the study area and meteorological measurement station (UMCS).
Table 1.
Scale of assessment of thermal stress of the organism according to UTCI, and ways of counteracting unfavourable biothermal conditions from a given class (Błażejczyk et al. 2013).
| Universal Thermal Climate Index [°C] | Stress category | Physiological responses |
|---|---|---|
| >46 | Extreme heat stress | – Increase in rectal temperature (Tre) time gradient – Steep decrease in total net heat loss – Averaged sweat rate >650 g · h−1, steep increase |
| 38.1–46.0 | Very strong heat stress | – Core to skin temperature gradient <1 K (at 30 min) Increase in Tre at 30 min |
| 32.1–38.0 | Strong heat stress | – Dynamic thermal sensation at 120 min >+2 – Averaged sweat rate >200 g · h−1 – Increase in Tre at 120 min – Latent heat loss >40 W at 30 min – Instantaneous change in skin temperature >0 K · min−1 |
| 26.1–32.0 | Moderate heat stress | – Change of slopes in sweat rate, Tre and skin temperature: mean (Tskm), face (Tskfc), hand (Tskhn) – Occurrence of sweating at 30 min – Steep increase in skin wetness |
| 9.1–26.0 | No thermal stress | – Averaged sweat rate >100 g · h−1 – Dynamic thermal sensation TS at 120 min <1 – Dynamic thermal sensation between –0.5 and +0.5 (averaged value) – Latent heat loss >40 W, averaged over time – Plateau in Tre time gradient |
| 0.1–9.0 | Slight cold stress | – Dynamic thermal sensation at 120 min <−1 – Local minimum of Tskhn (use gloves) |
| –12.9 to 0.0 | Moderate cold stress | – Dynamic thermal sensation at 120 min <–2 – Skin blood flow at 120 min lower than at 30 min (vasoconstriction) – Averaged Tskfc <15°C (pain) – Decrease in Tskhn – Tre time gradient <0 K · h−1 – 30 min face skin temperature <15°C (pain) – Tmsk time gradient <−1 K · h−1 (for reference) |
| –26.9 to –13.0 | Strong cold stress | – Averaged Tskfc <7°C (numbness) – Tre time gradient <–0.1 K · h−1 – Tre decreases from 30 min to 120 min – Increase in core to skin temperature gradient |
| –39.9 to –27.0 | Very strong cold stress | – 120 min Tskfc <0°C (frostbite) – Steeper decrease in Tre – 30 min Tskfc <7°C (numbness) – Occurrence of shivering – Tre time gradient <–0.2 K · h−1 – Averaged Tskfc <0°C (frostbite). – 120 min Tskfc <–5°C (high risk of frostbite) |
| <–40.0 | Extreme cold stress | – Tre time gradient <–0.3 K · h−1 – 30 min Tskfc <0°C (frostbite) |
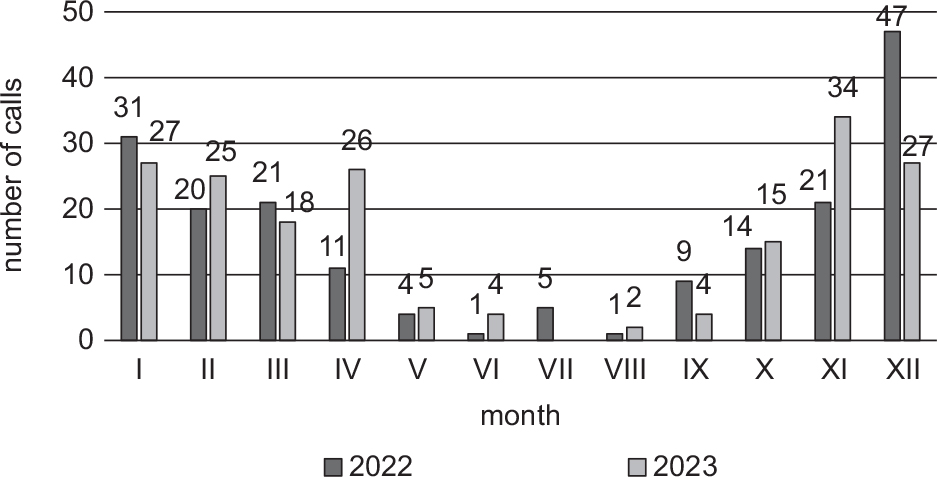
Fig. 2.
Monthly distribution of reported hypothermia cases in Lublin (2022–2023).
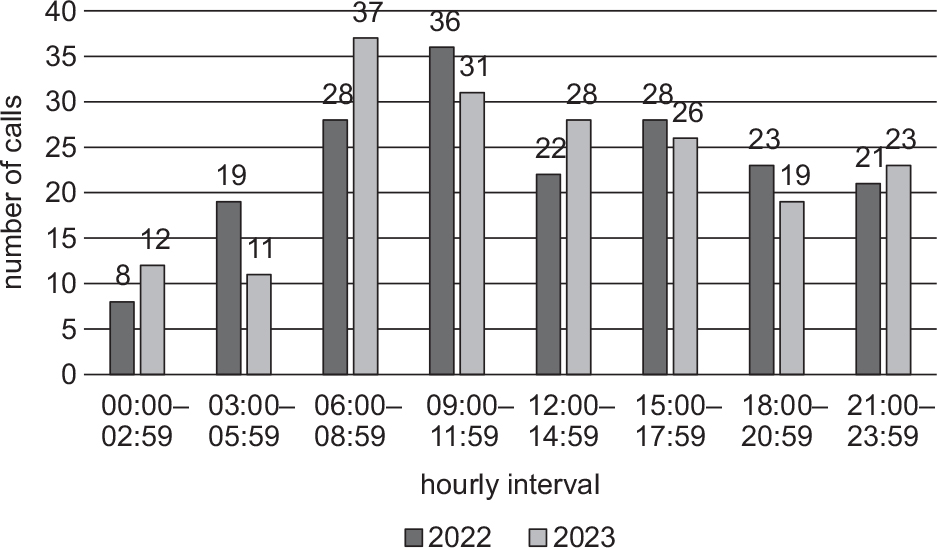
Fig. 3.
Relationship between the number of reported hypothermia cases in Lublin and the time of day (2022–2023).
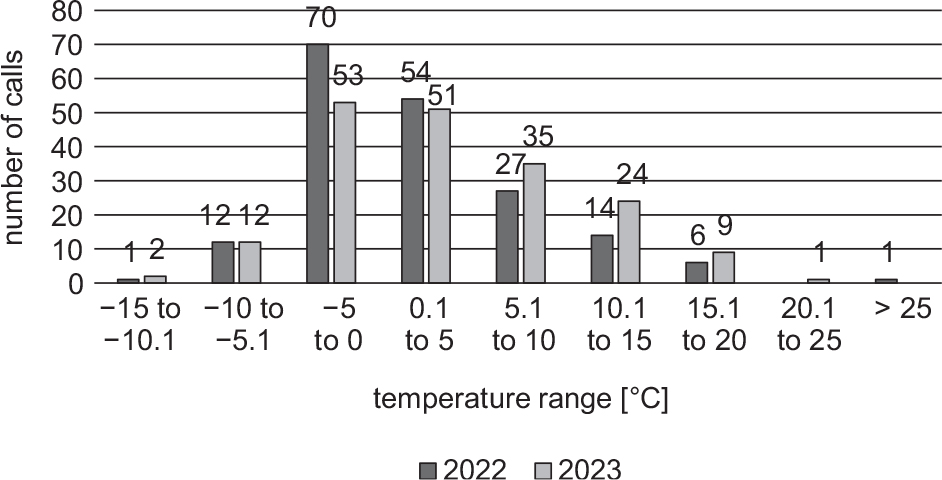
Fig. 4.
Relationship between temperature and the number of reported hypothermia cases in Lublin (2022–2023).
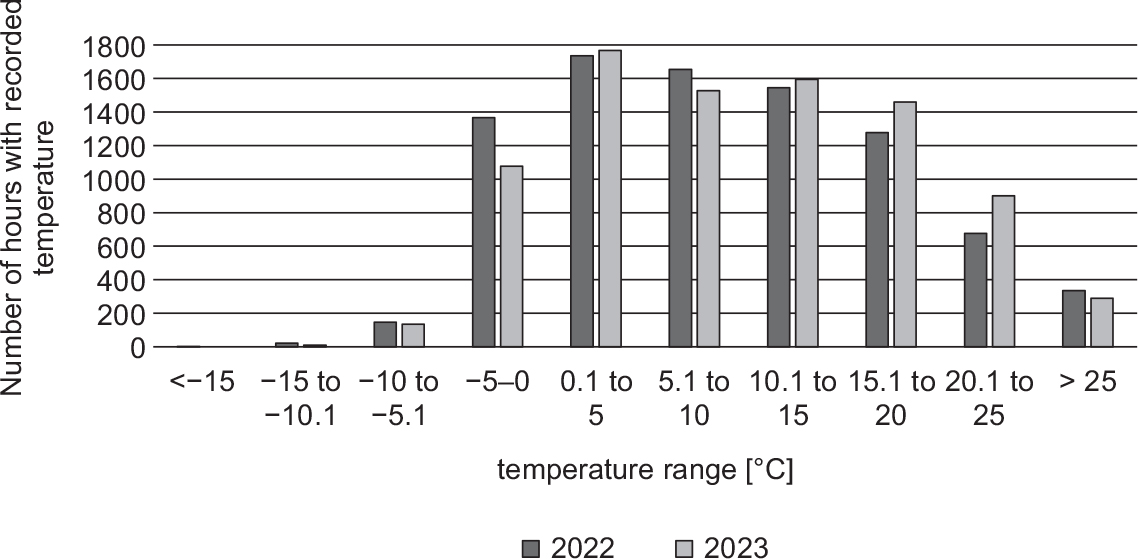
Fig. 5.
Ranges of air temperature values in Lublin (2022–2023).
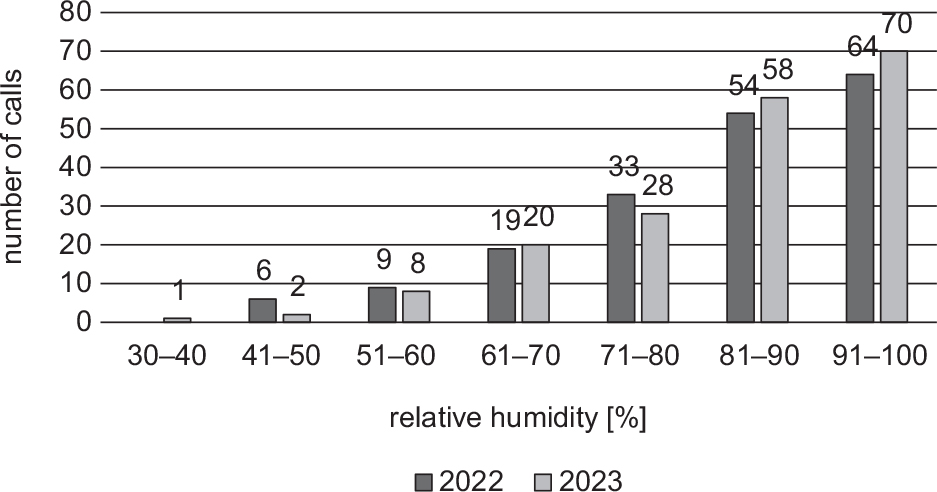
Fig. 6.
Relationship between relative humidity and the number of reported hypothermia cases in Lublin (2022–2023).
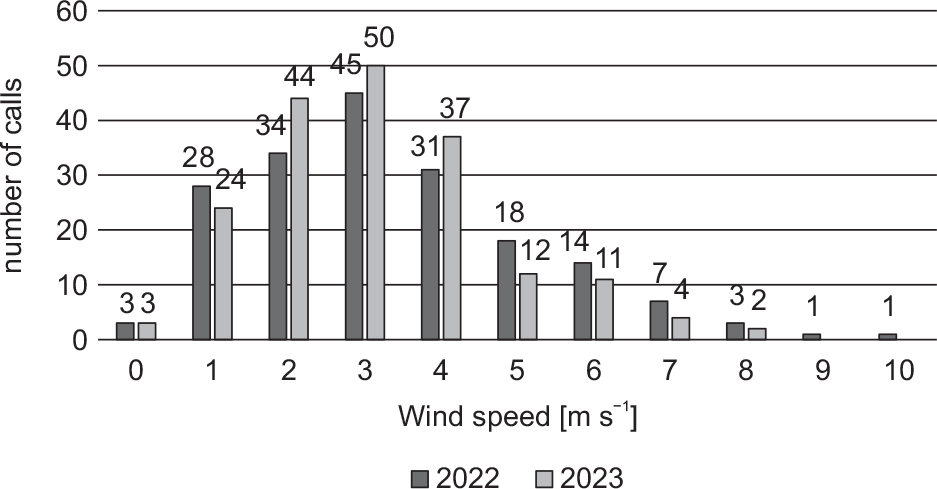
Fig. 7.
Relationship between wind speed and the number of reported hypothermia cases in Lublin (2022–2023).
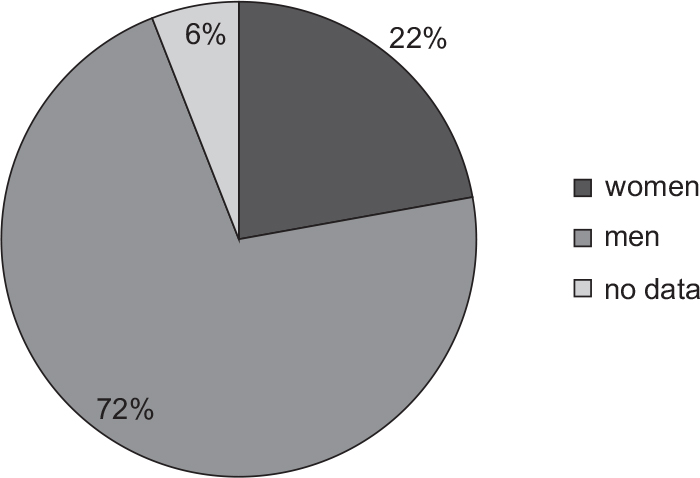
Fig. 8.
Relationship between gender and the number of reported hypothermia cases in Lublin in 2022.
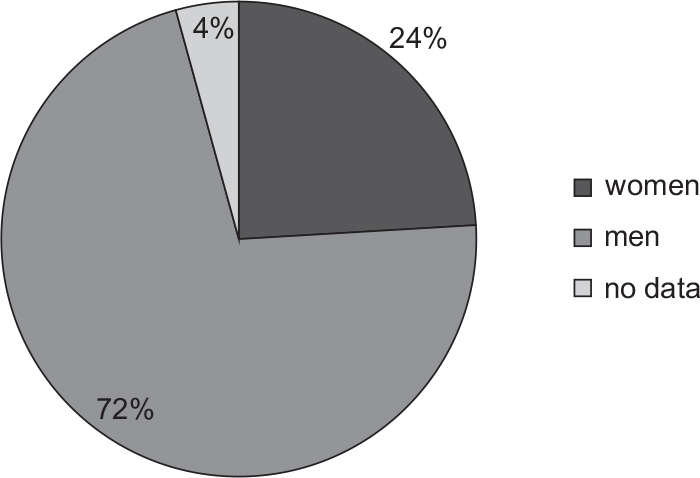
Fig. 9.
Relationship between gender and the number of reported hypothermia cases in Lublin in 2023.
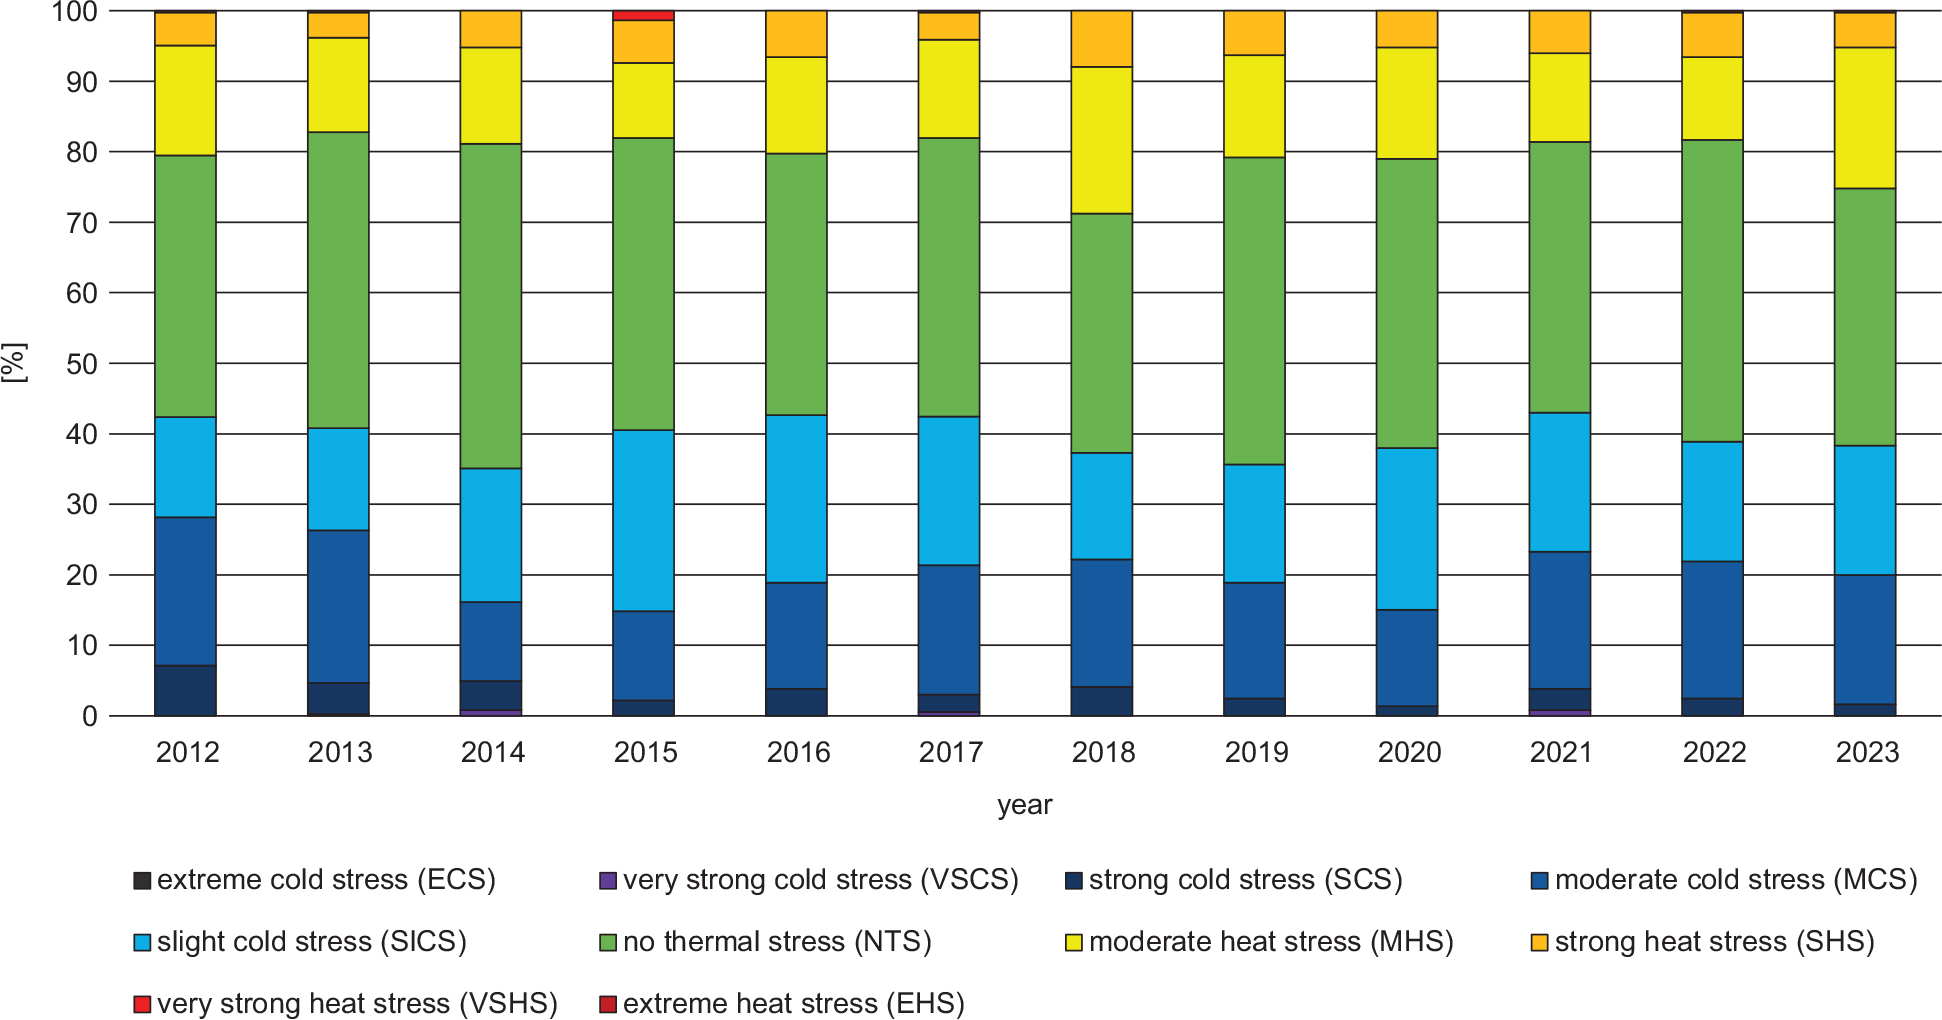
Fig. 10.
Annual frequency of days with specific thermal sensations in Lublin (2012–2023).
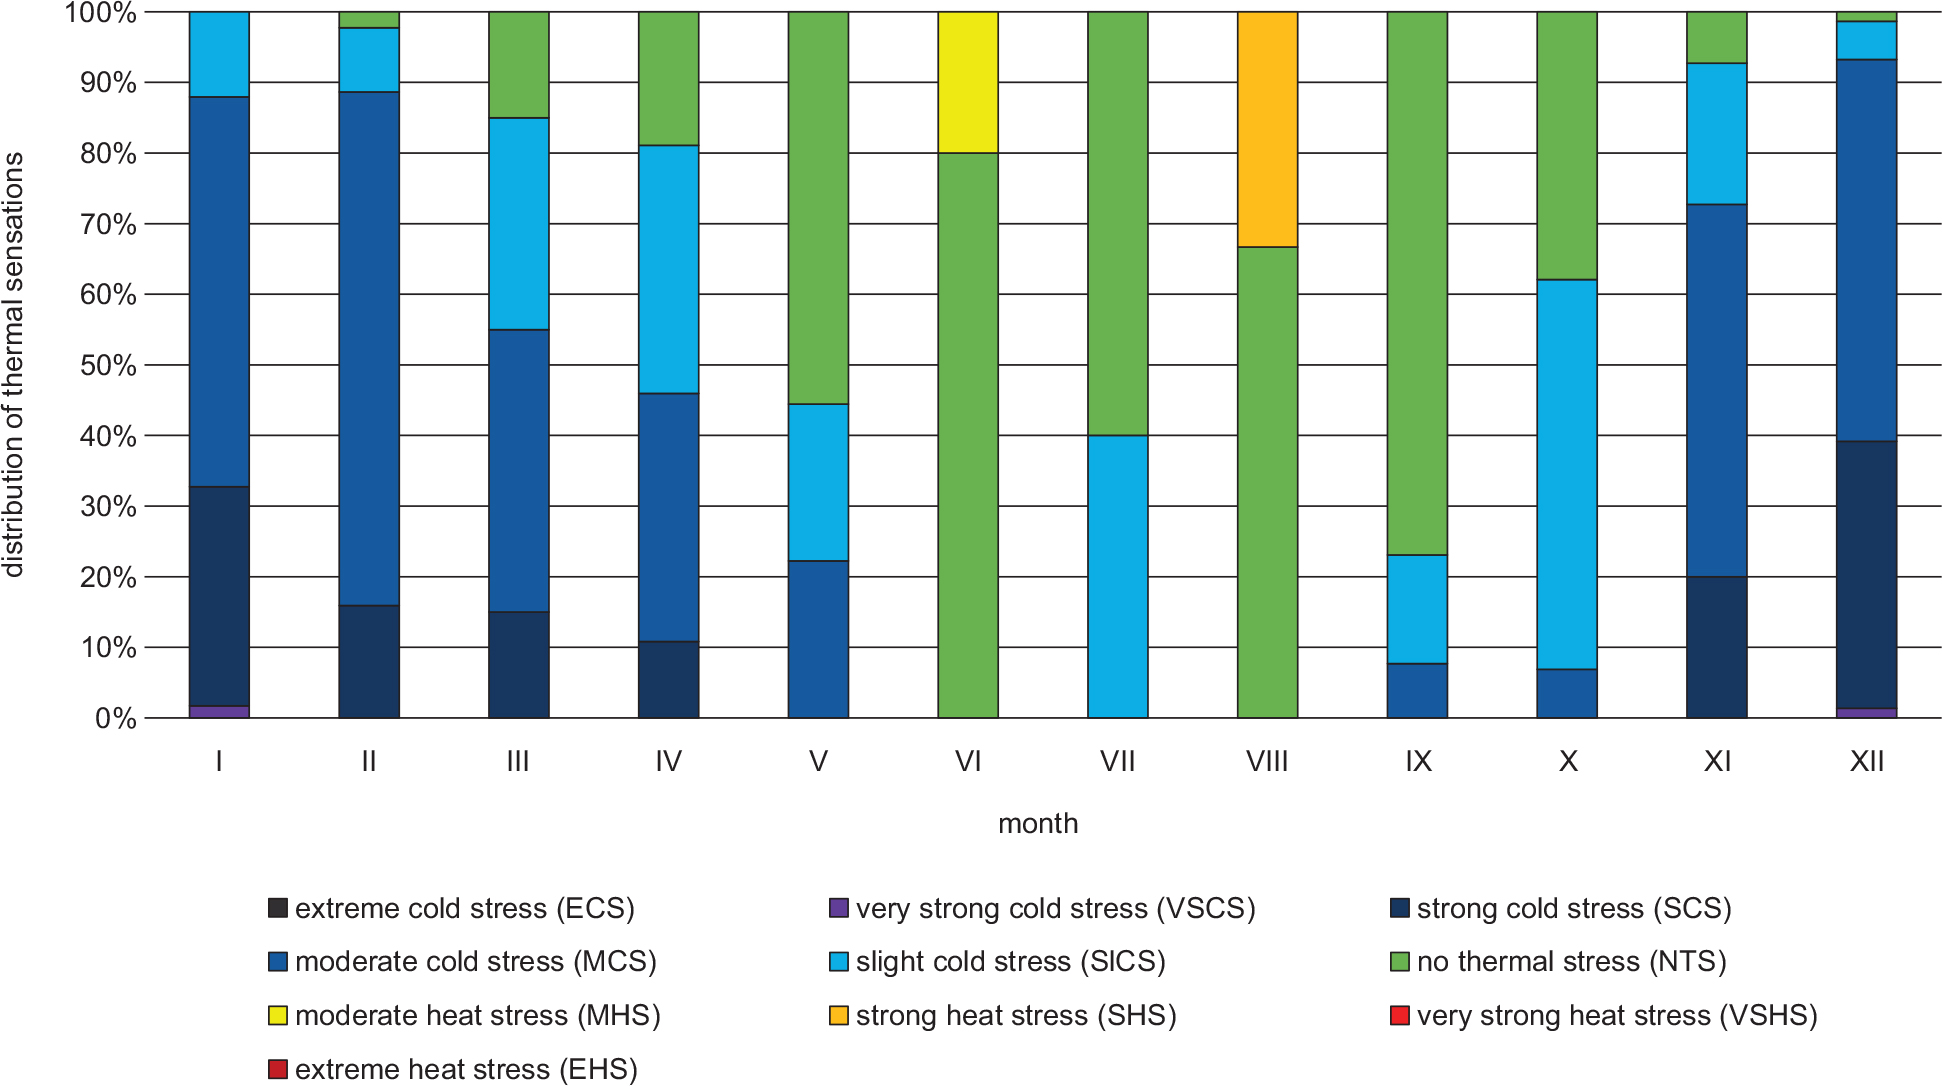
Fig. 11.
Frequency of thermal load classes for the hours when hypothermia calls were received in Lublin (2022–2023).