
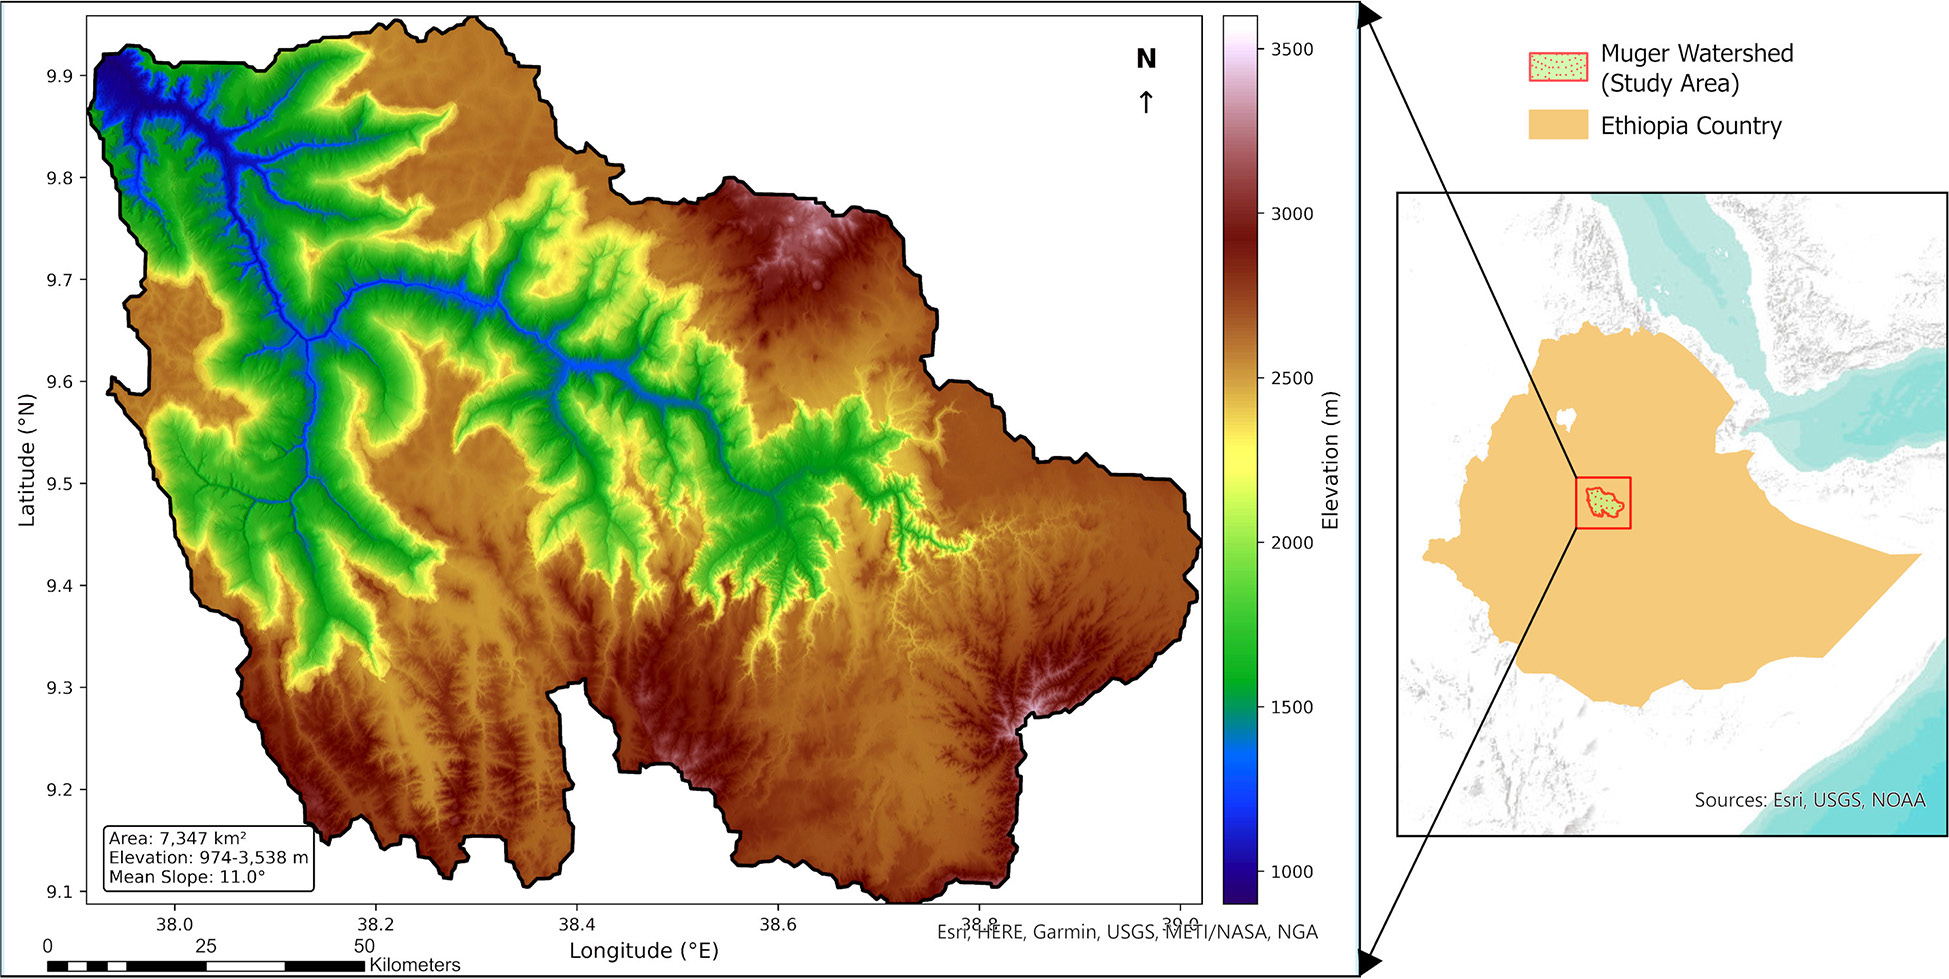
Fig. 1.
Location and topographic characteristics of the Muger River Watershed in the central Ethiopian highlands. The watershed covers approximately 7347 km2 within the Blue Nile (Abay) basin, spanning elevations from 974 to 3538 m above sea level. The map displays the watershed boundary derived from HydroBASINS Level 07, drainage networks, and elevation distribution. Steep terrain (>15-degree slope) comprises approximately 24.5% of the watershed area.
Table 1.
Data sources used for RUSLE model parameterisation.
| Data type | Source | Resolution | Period/year | Used for |
|---|---|---|---|---|
| DEM | Shuttle Radar Topography Mission (SRTM) | 30 m | 2000 | LS factor, slope, P factor |
| Precipitation | CHIRPS | 5 km | 2001–2025 | R factor |
| Soil properties | OpenLandMap | 250 m | Static | K factor |
| Land cover (2001) | MODIS MCD12Q1 | 500 m | 2001 | C factor (2001) |
| Land cover (2025) | Dynamic World | 10 m | 2024–2025 | C factor (2025) |
| Watershed boundary | HydroBASINS Level 07 | Subbasin scale | Static | Study area delineation |
Table 2.
C factor values assigned to land cover classes for 2001 (MODIS) and 2025 (Dynamic World).
| Panel A: MODIS MCD12Q1 classes (2001) | |||
|---|---|---|---|
| MODIS class | Land cover type | C value | Source |
| 1–5 | Forest (all types) | 0.03 | Hurni (1985) |
| 6 | Closed shrubland | 0.03 | Bewket and Teferi (2009) |
| 7 | Open shrubland | 0.05 | Bewket and Teferi (2009) |
| 8 | Woody savannas | 0.05 | Bewket and Teferi (2009) |
| 9 | Savannas | 0.08 | Renard et al. (1997) |
| 10 | Grasslands | 0.01 | Renard et al. (1997) |
| 11 | Permanent wetlands | 0.01 | Renard et al. (1997) |
| 12 | Croplands | 0.21 | Hurni (1985) |
| 13 | Urban and built up | 0.00 | Gelagay and Minale (2016) |
| 14 | Cropland/natural mosaic | 0.15 | Hurni (1985) |
| 16 | Barren or sparsely vegetated | 0.45 | Renard et al. (1997) |
| 17 | Water bodies | 0.00 | N/A |
| Panel B: Dynamic world classes (2025) | |||
|---|---|---|---|
| DW class | Land cover type | C value | Source |
| 0 | Water | 0.00 | N/A |
| 1 | Trees | 0.03 | Hurni (1985) |
| 2 | Grass | 0.01 | Renard et al. (1997) |
| 3 | Flooded vegetation | 0.01 | Renard et al. (1997) |
| 4 | Crops | 0.21 | Hurni (1985) |
| 5 | Shrub and scrub | 0.03 | Bewket and Teferi (2009) |
| 6 | Built up | 0.00 | Gelagay and Minale (2016) |
| 7 | Bare | 0.45 | Renard et al. (1997) |
| 8 | Snow and ice | 0.00 | N/A |
Table 3.
P factor values assigned to slope classes.
| Slope class [%] | P-value | Description |
|---|---|---|
| 0–7 | 0.55 | Gentle slopes with moderate conservation potential |
| 7–11.3 | 0.60 | Moderate slopes with some conservation measures |
| 11.3–17.6 | 0.80 | Moderately steep slopes with limited conservation |
| 17.6–26.8 | 0.95 | Steep slopes with minimal conservation |
| >26.8 | 1.00 | Very steep slopes with no effective conservation measures |
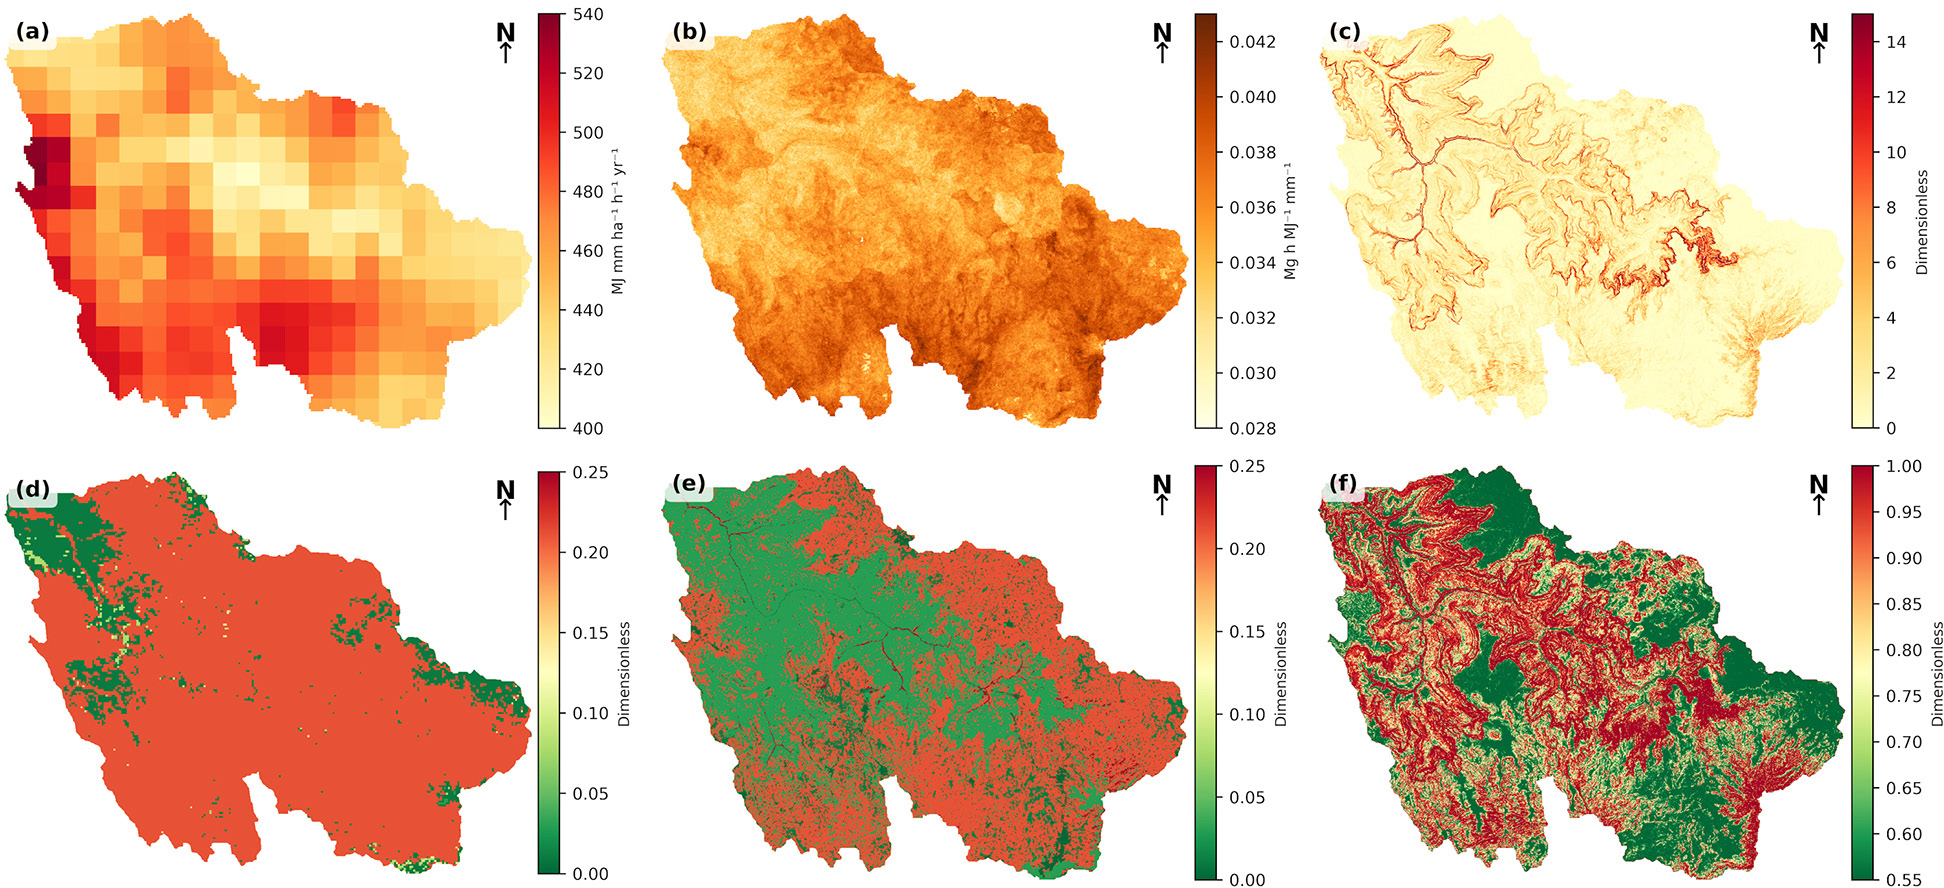
Fig. 2
Spatial distribution of RUSLE model factors across the Muger River Watershed: (a) – rainfall erosivity (R), (b) – soil erodibility (K), (c) – topographic factor (LS), (d) – cover management factor (C) for 2001, (e) – cover management factor (C) for 2025, and (f) – conservation support practice factor (P).
Table 4.
Summary of soil properties in the Muger River Watershed.
| Soil property | Min | Max | Mean | Std dev |
|---|---|---|---|---|
| [%] | ||||
| Sand | 16 | 46 | 32.7 | 4.6 |
| Clay | 26 | 62 | 40.3 | 4.0 |
| Silt | 19 | 39 | 27.0 | 2.9 |
| Organic carbon [g·kg−1] | 1 | 17 | 4.6 | 1.1 |
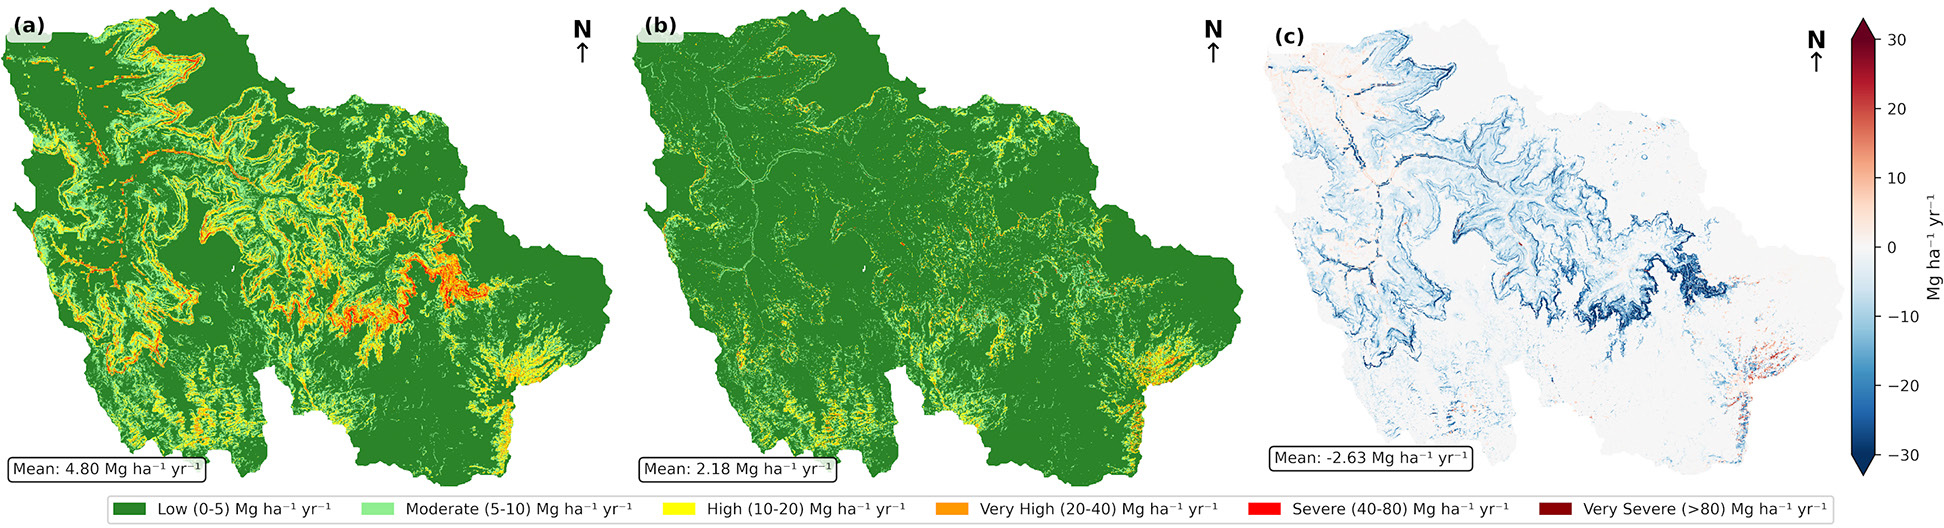
Fig. 3.
Spatial distribution of soil erosion risk in the Muger River Watershed: (a) – 2001, (b) – 2025, and (c) – net change in erosion rates (2025 minus 2001). Negative values in (c) indicate erosion reduction.
Table 5.
Summary statistics of soil erosion rates in 2001 and 2025.
| Statistic | 2001 | 2025 | Absolute change | Percent change |
|---|---|---|---|---|
| [Mg·ha−1·yr−1] | [%] | |||
| Minimum | 0.005 | 0.000 | –0.005 | –100.0 |
| Mean | 4.800 | 2.180 | –2.630 | –54.7 |
| Median | 2.000 | 0.830 | –1.170 | –58.7 |
| Maximum | 117.580 | 156.570 | +38.990 | +33.2 |
| Standard deviation | 7.650 | 3.900 | –3.750 | –49.0 |
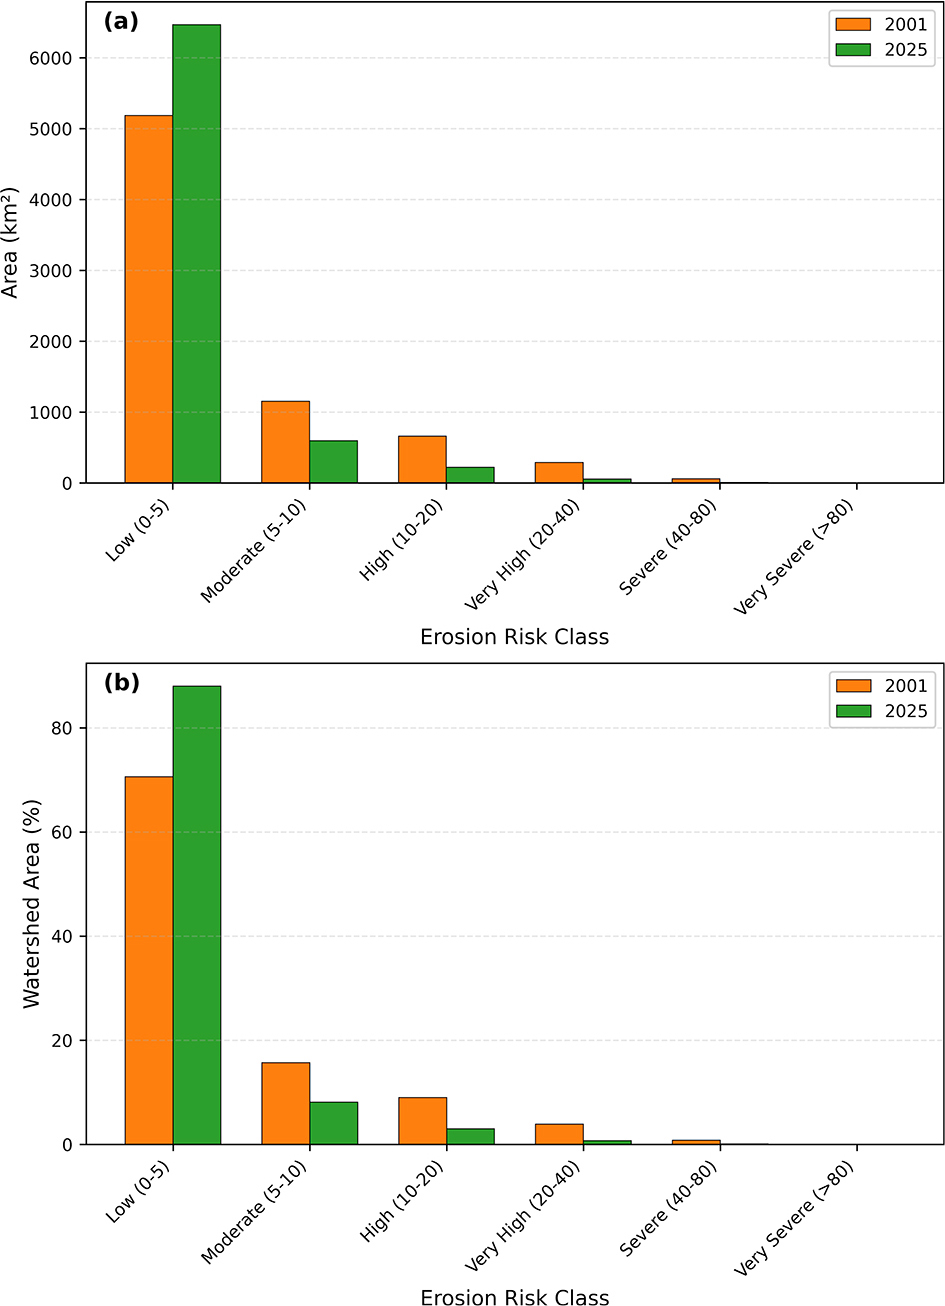
Fig. 4.
Comparison of watershed area under each erosion risk class for 2001 and 2025: (a) – area in km2 and (b) – percentage of watershed area.
Table 6.
Area distribution by erosion risk class in 2001 and 2025.
| Erosion Risk Class | 2001 area | 2001 | 2025 area | 2025 | Change in area | Change |
|---|---|---|---|---|---|---|
| [km2] | [%] | [km2] | [%] | [km2] | [%] | |
| Low (0 to 5) | 5,185.5 | 70.6 | 6,467.6 | 88.0 | +1,282.1 | +24.7 |
| Moderate (5 to 10) | 1,151.8 | 15.7 | 595.8 | 8.1 | –556.0 | –48.3 |
| High (10 to 20) | 660.1 | 9.0 | 221.6 | 3.0 | –438.5 | –66.4 |
| Very high (20 to 40) | 287.7 | 3.9 | 54.4 | 0.7 | –233.3 | –81.1 |
| Severe (40 to 80) | 60.0 | 0.8 | 6.8 | 0.1 | –53.2 | –88.6 |
| Very severe (>80) | 1.4 | <0.1 | 0.3 | <0.1 | –1.1 | –76.4 |
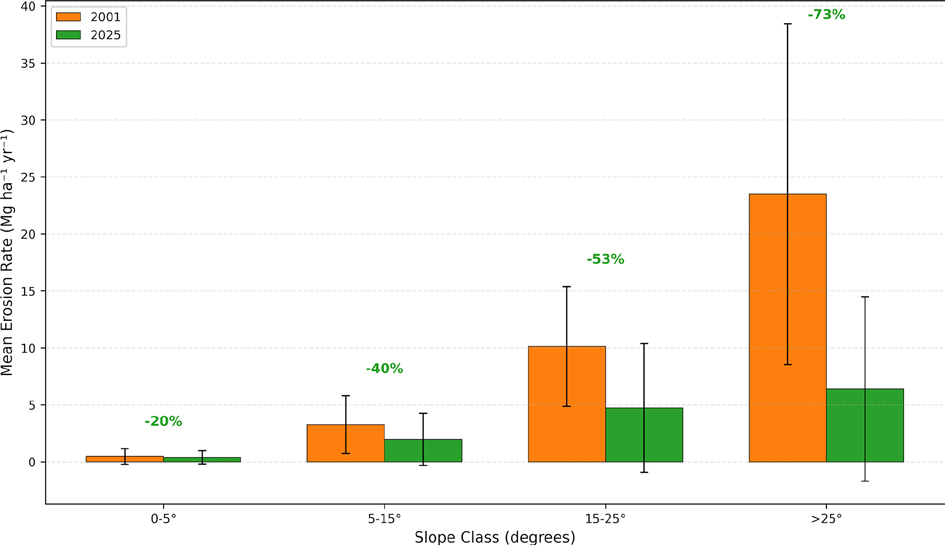
Fig. 5.
Mean annual soil erosion rates by slope class for 2001 and 2025, with error bars representing standard deviation and percentage change annotated above each pair.
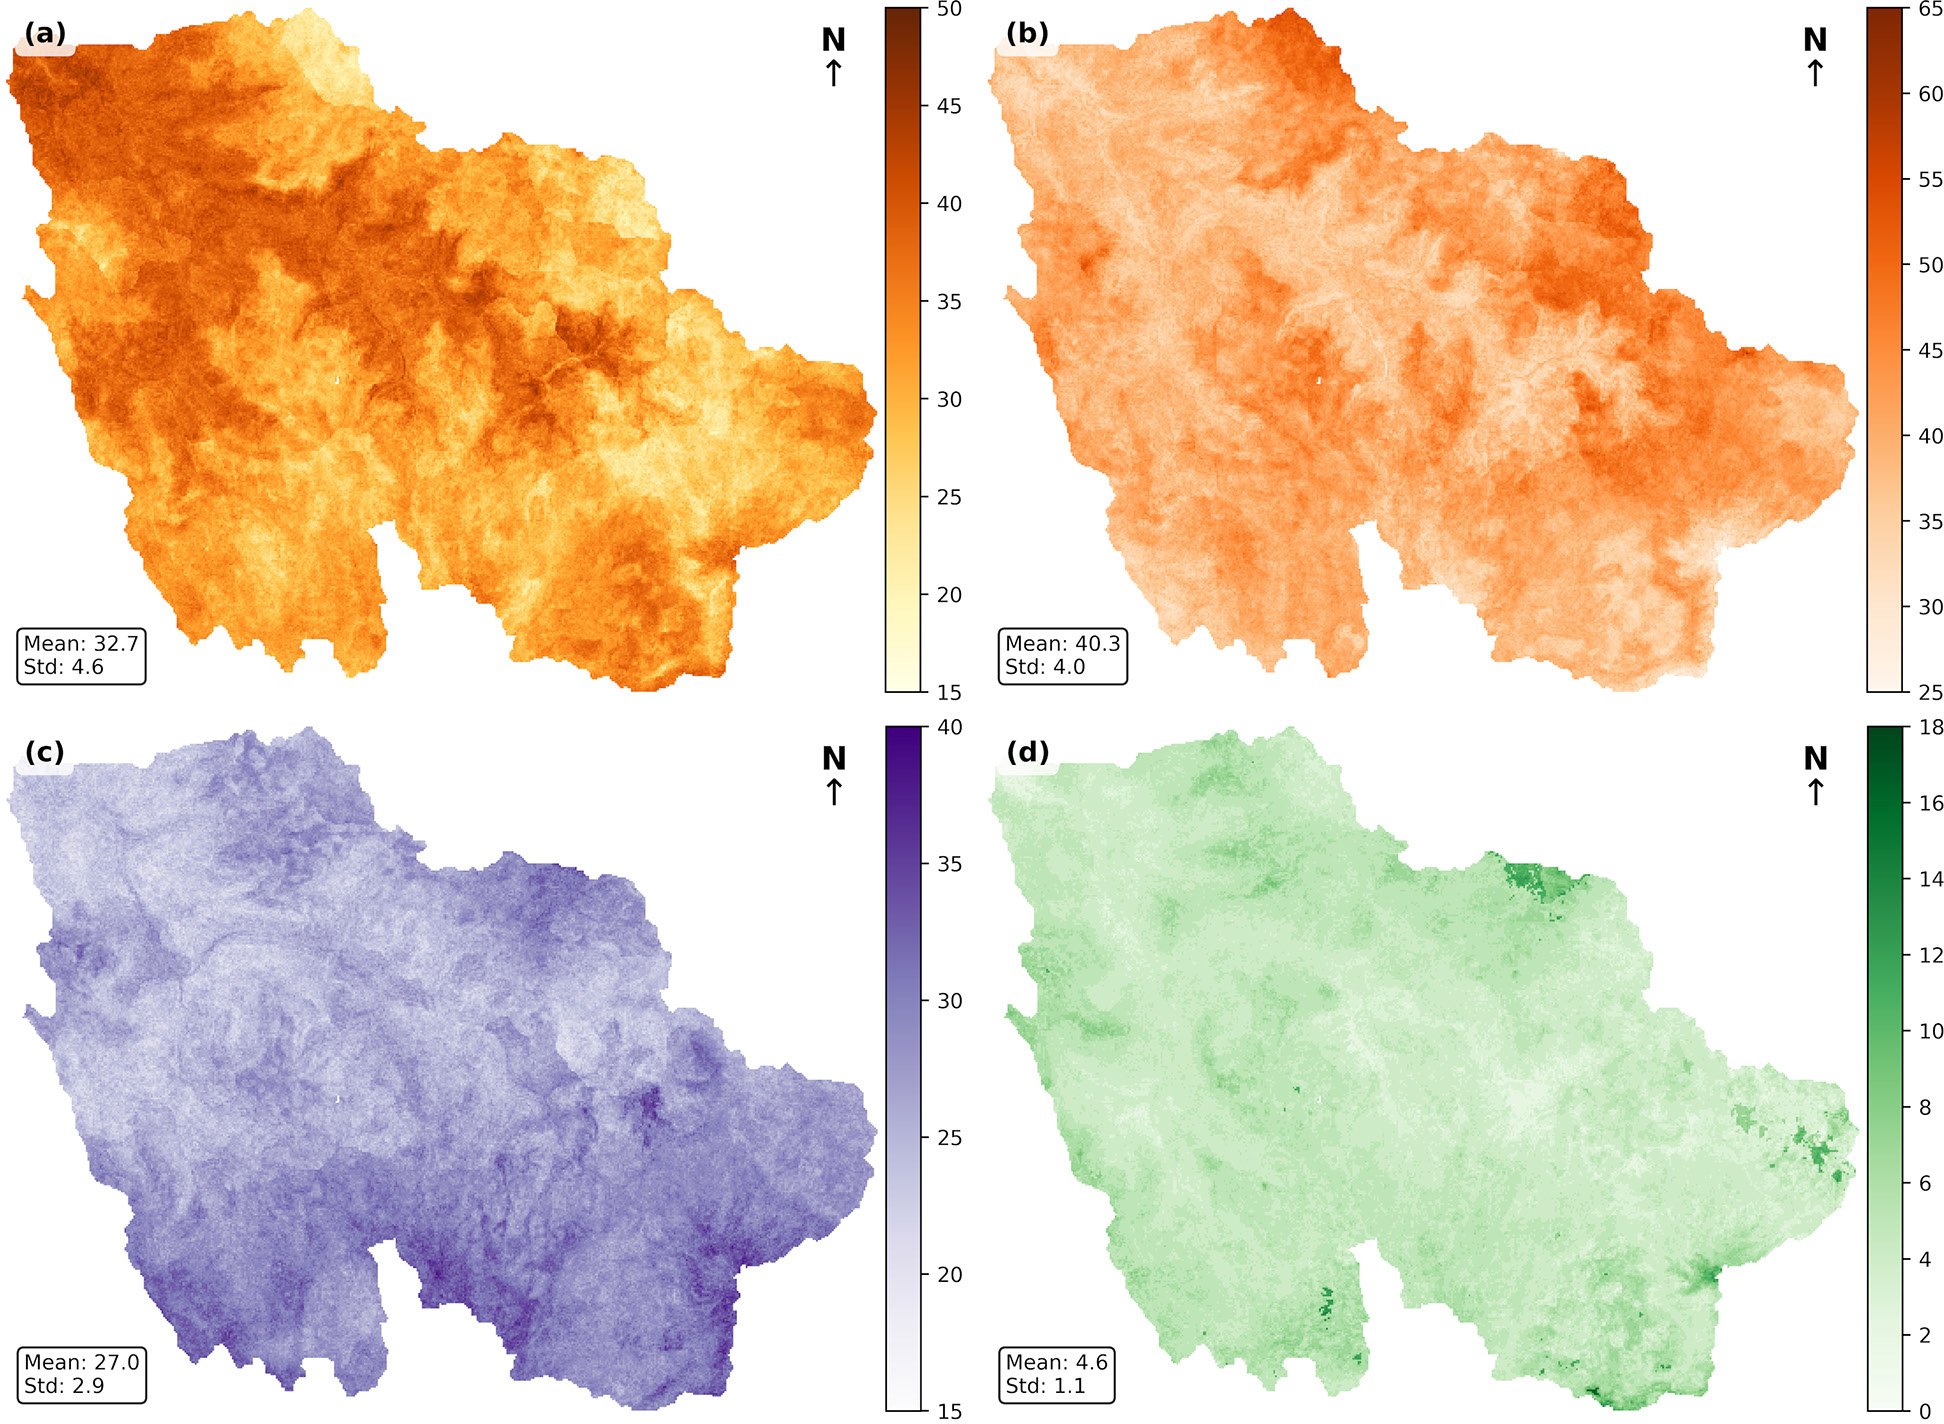
Fig. 6.
Spatial distribution of soil properties across the Muger River Watershed: (a) – sand content (%), (b) – clay content (%), (c) – silt content (%), and (d) – organic carbon content (g·kg−1). Data derived from OpenLandMap at 250 m resolution.
Table 7.
Mean erosion rates by slope class in 2001 and 2025.
| Slope Class | Area | Erosion 2001 | Std dev 2001 | Erosion 2025 | Std dev 2025 | Absolute change | Percent change |
|---|---|---|---|---|---|---|---|
| [°] | [cell grids] | [Mg·ha−1·yr−1] | [Mg·ha−1·yr−1] | [%] | |||
| 0–5 | 243.745 | 0.48 | 0.69 | 0.39 | 0.57 | –0.10 | –20.2 |
| 5–15 | 335.893 | 3.26 | 2.54 | 1.97 | 2.30 | –1.29 | –39.6 |
| 15–25 | 114.306 | 10.13 | 5.26 | 4.72 | 5.65 | –5.41 | –53.4 |
| >25 | 51.575 | 23.49 | 14.95 | 6.39 | 8.09 | –17.10 | –72.8 |