
Table 1.
Selected characteristics of the Vistula River (Łajczak et al. 2021).
| Characteristic of the Vistula River | Value |
|---|---|
| Drainage basin area | 194,424 km2 |
| Valley length | 525 km |
| Average discharge at the mouth | 1,080 m3/s |
| Amount of transported suspended and bedload material | 833,000 t/year |
| River sinuosity | 115% |
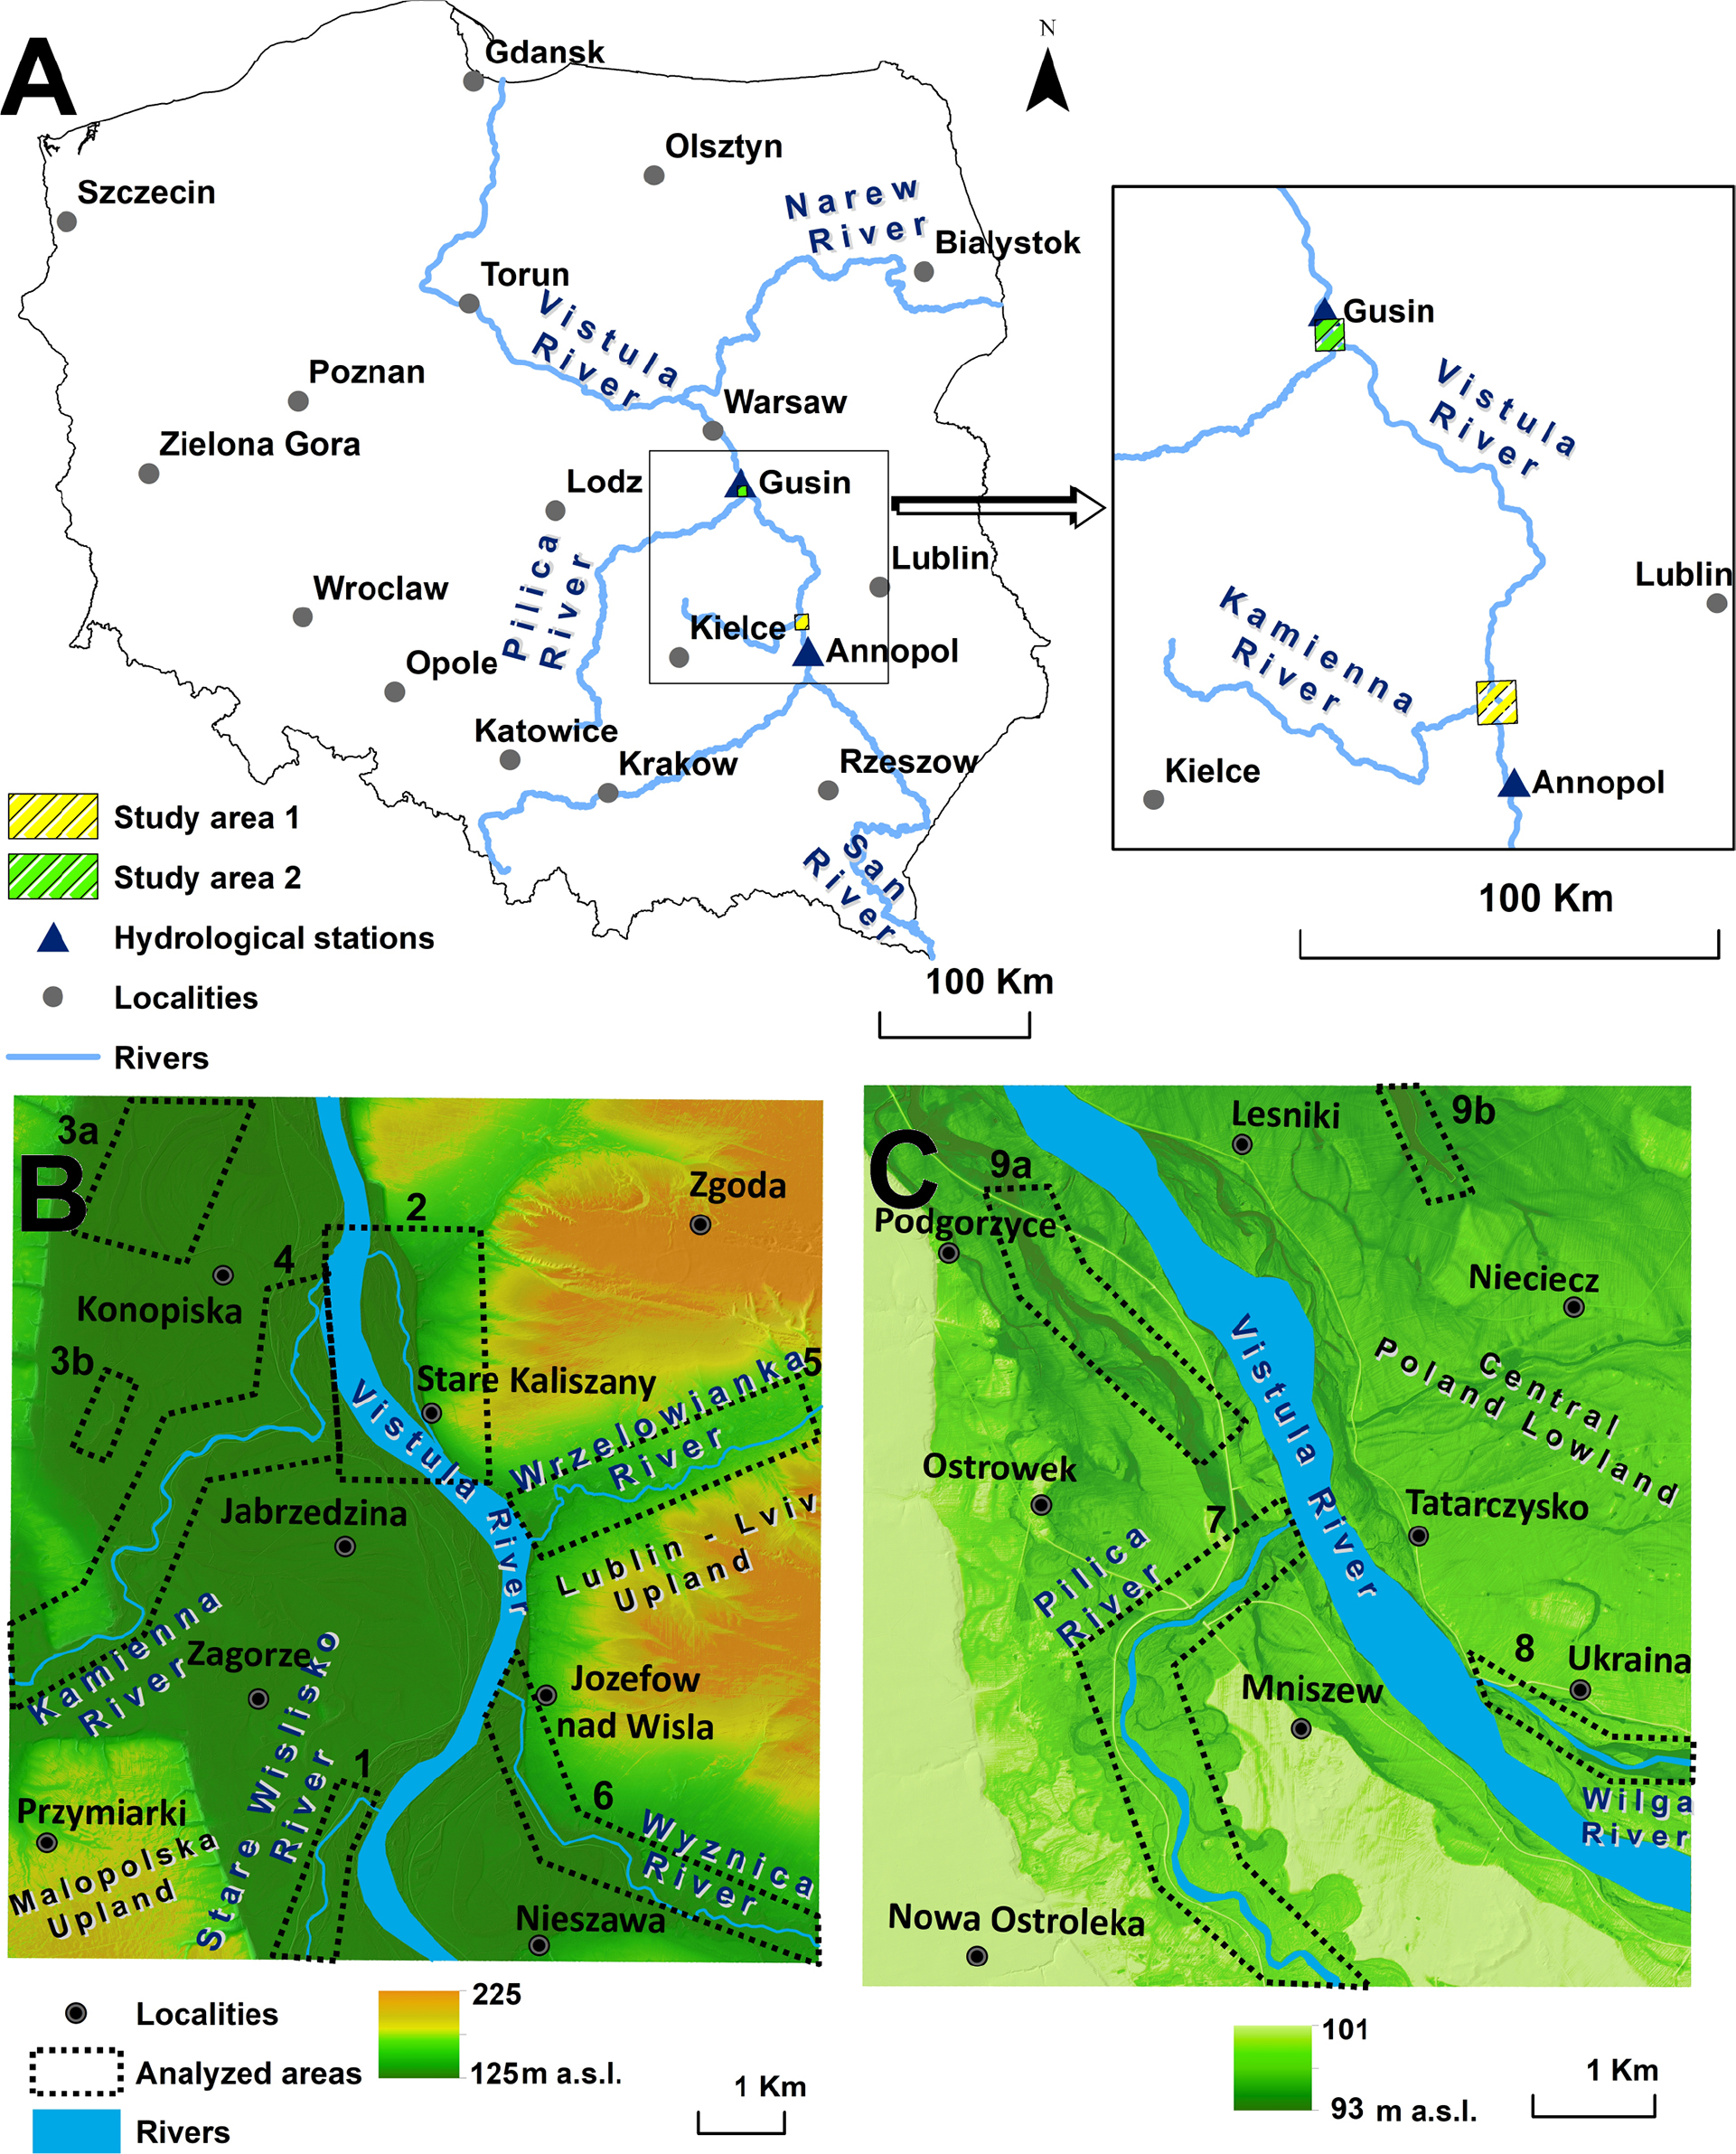
Fig. 1.
Study area. A – Location of research areas in Poland; positions of hydrological stations are marked with triangles; B – Physical-geographical map of Research Area 1 with designated test areas; C – Physical-geographical map of Research Area 2 with designated test areas; based on data from GUGiK – www.geoportal.gov.pl/.
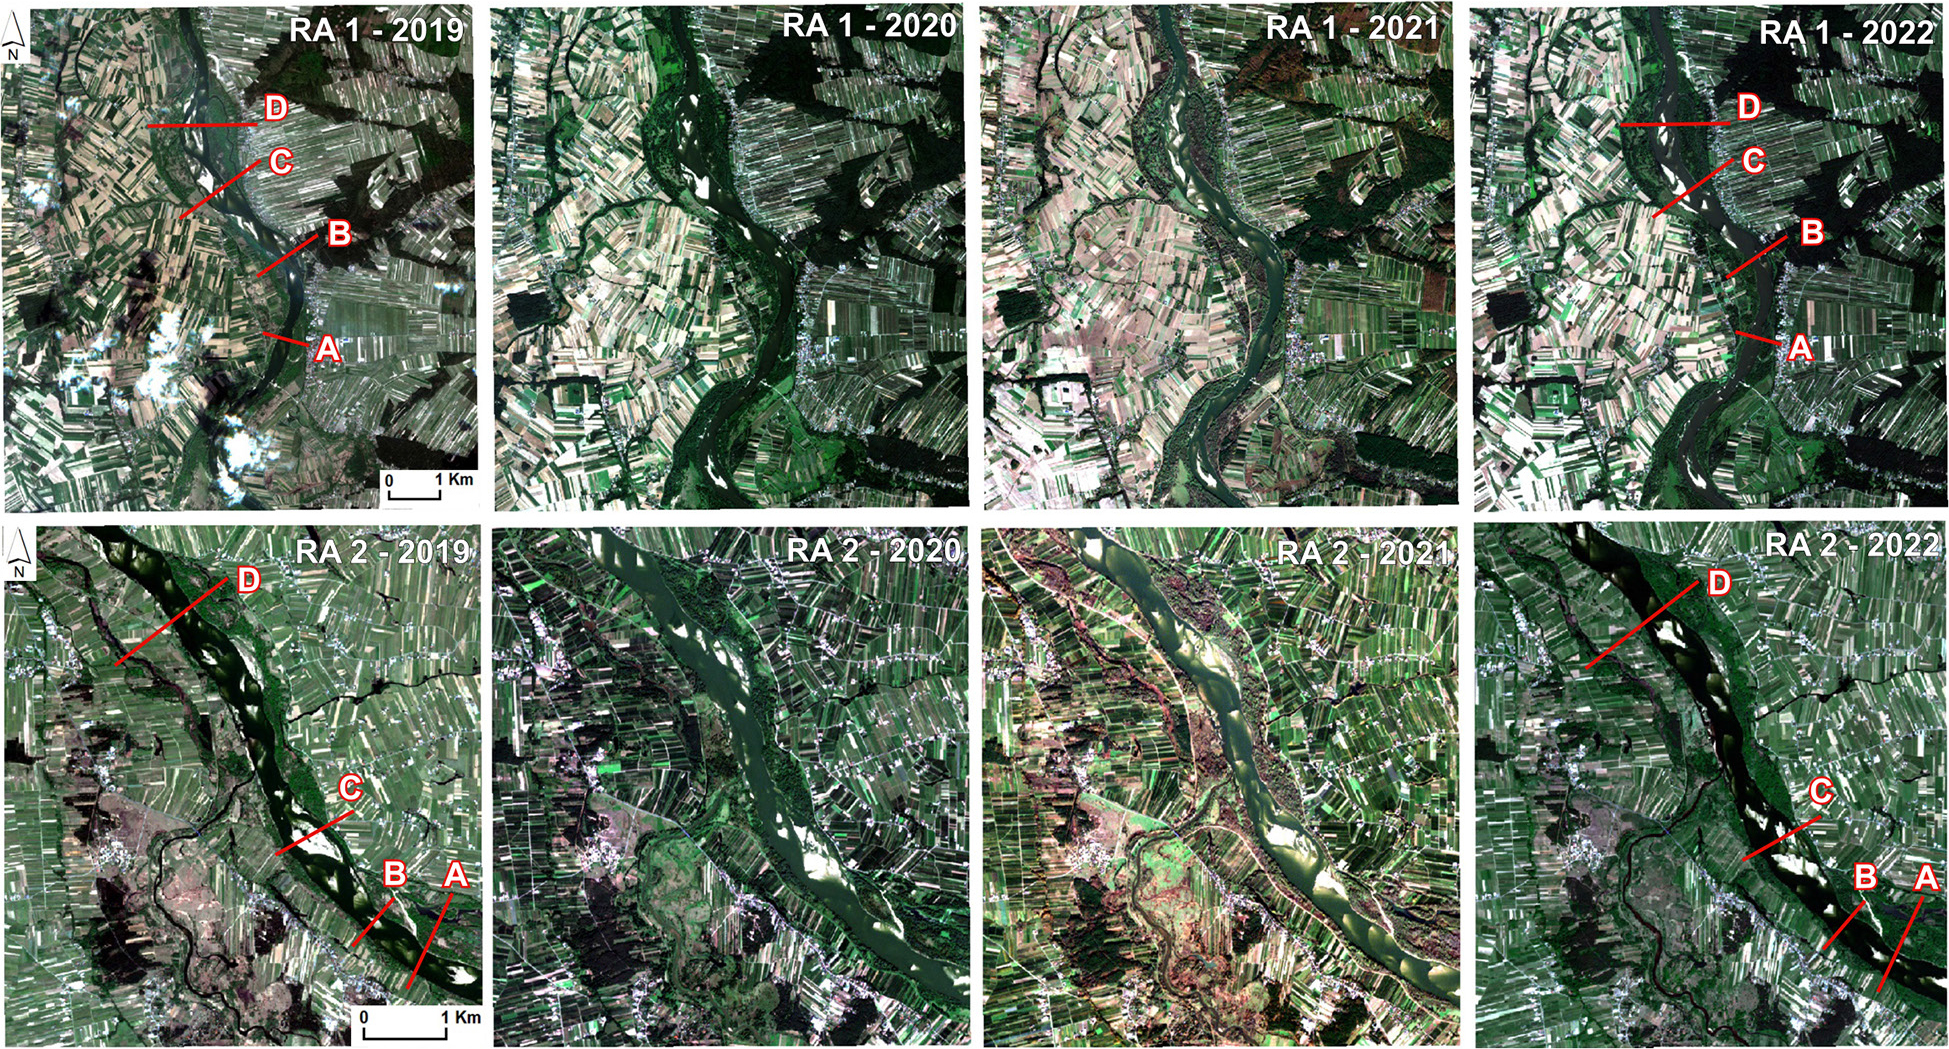
Fig. 2.
RGB composites for Research Areas 1 and 2; A–D – profile lines drawn through the analysed spectral indices, shown in Figures 8 and 9.
Table 2.
List of Sentinel-2 satellite scenes used in the analysis with corresponding water levels and stage classification.
| Study area | Photo date | Satellite scene name | Water level | Stage zone |
|---|---|---|---|---|
| 1 | 25.04.2019 | S2A_MSIL1C_20190425T094031_N0207 | 215 cm | low |
| 1 | 22.08.2020 | S2B_MSIL1C_20200822T094039_N0500 | 220 cm | low |
| 1 | 31.10.2021 | S2A_MSIL1C_20211031T094141_N0500 | 219 cm | low |
| 1 | 27.08.2022 | S2A_MSIL1C_20220827T093601_N0400 | 211 cm | low |
| 2 | 25.04.2019 | S2A_MSIL1C_20190425T094031_N0207 | 50 cm | low |
| 2 | 14.09.2020 | S2B_MSIL1C_20200914T095029_N0500 | 57 cm | low |
| 2 | 29.10.2021 | S2B_MSIL1C_20211029T095029_N0301 | 60 cm | low |
| 2 | 19.05.2022 | S2A_MSIL1C_20220519T094041_N0400 | 61 cm | low |
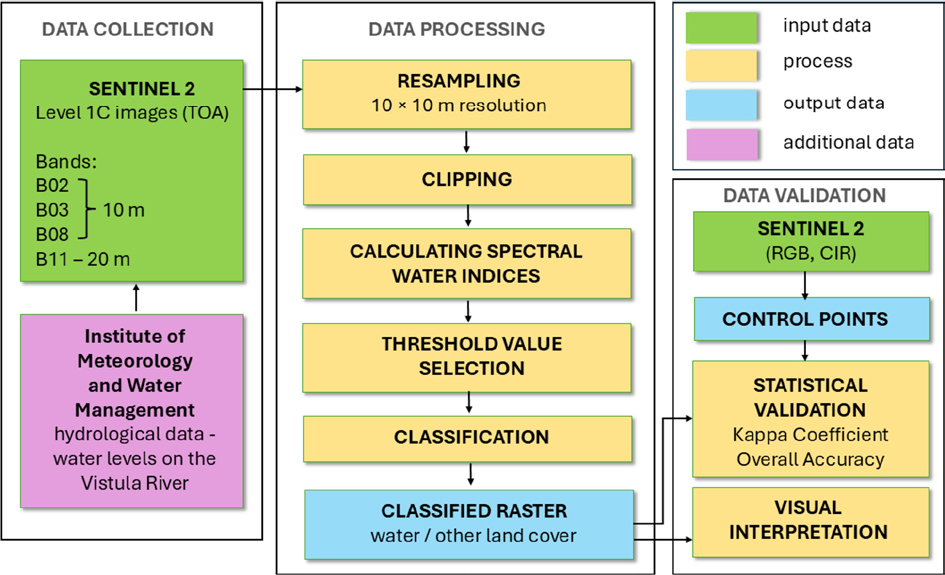
Fig. 3.
Diagram of the data analysis process.
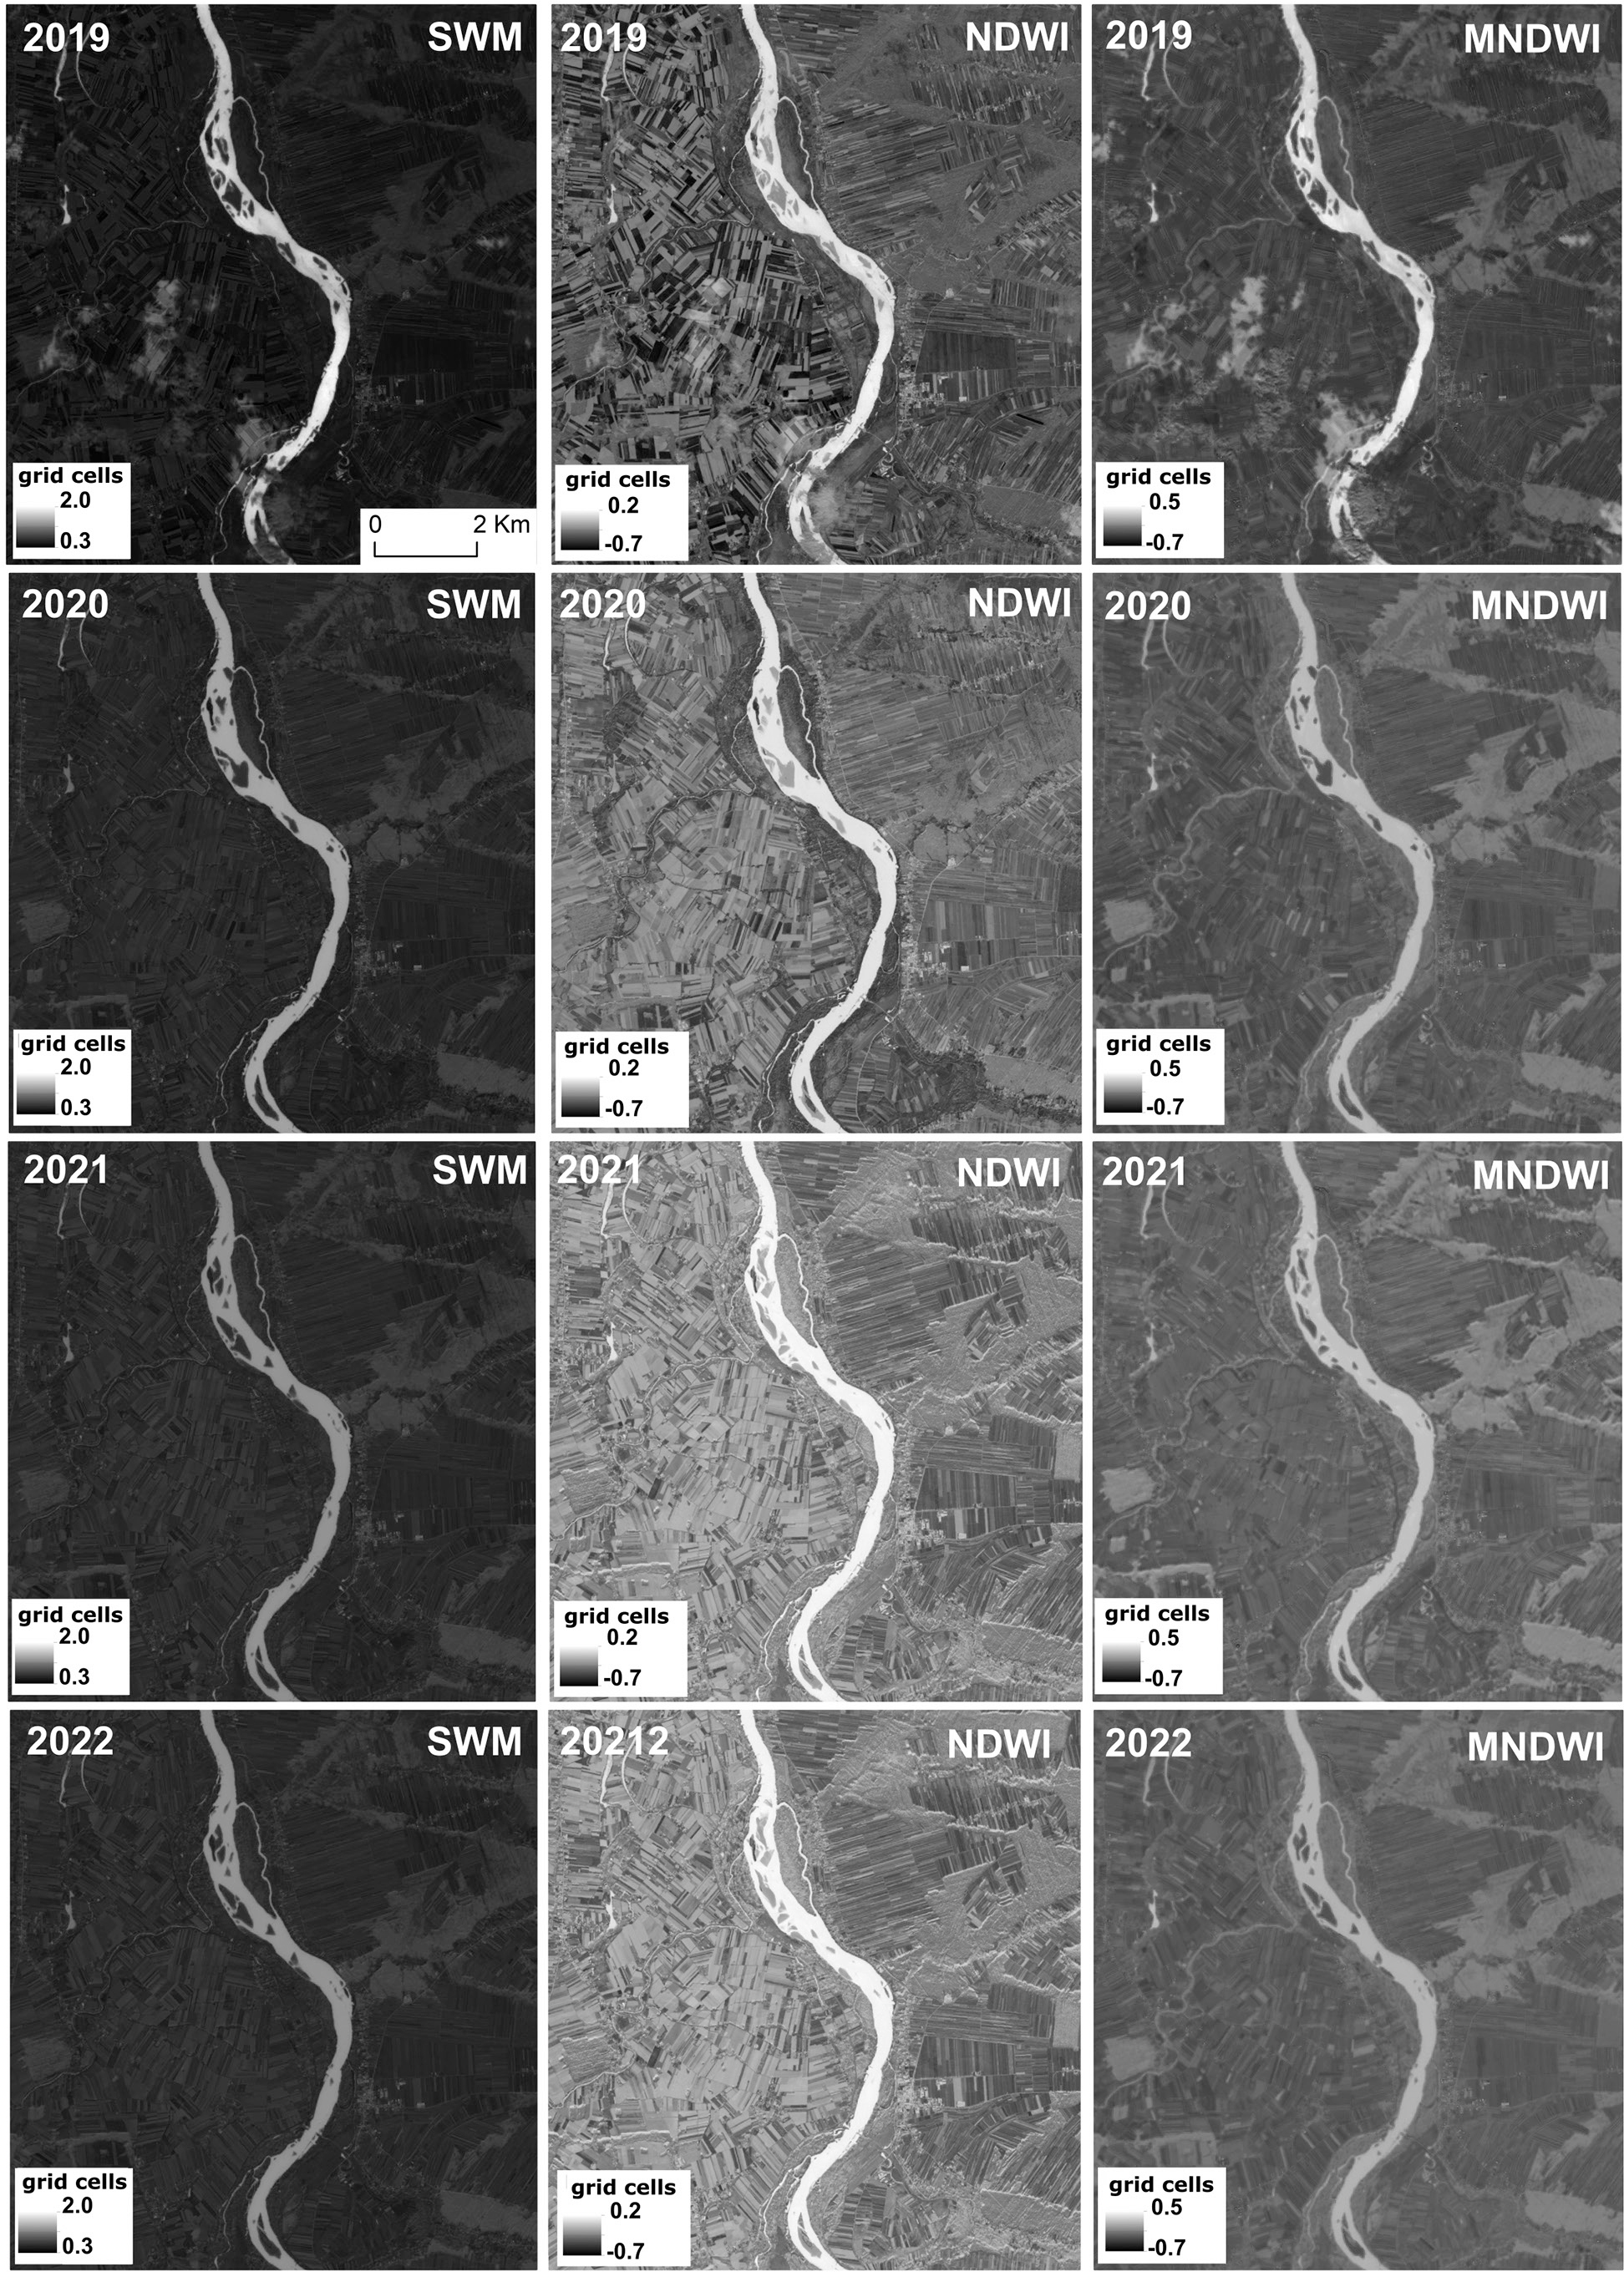
Fig. 4.
Water index maps for Research Area 1.
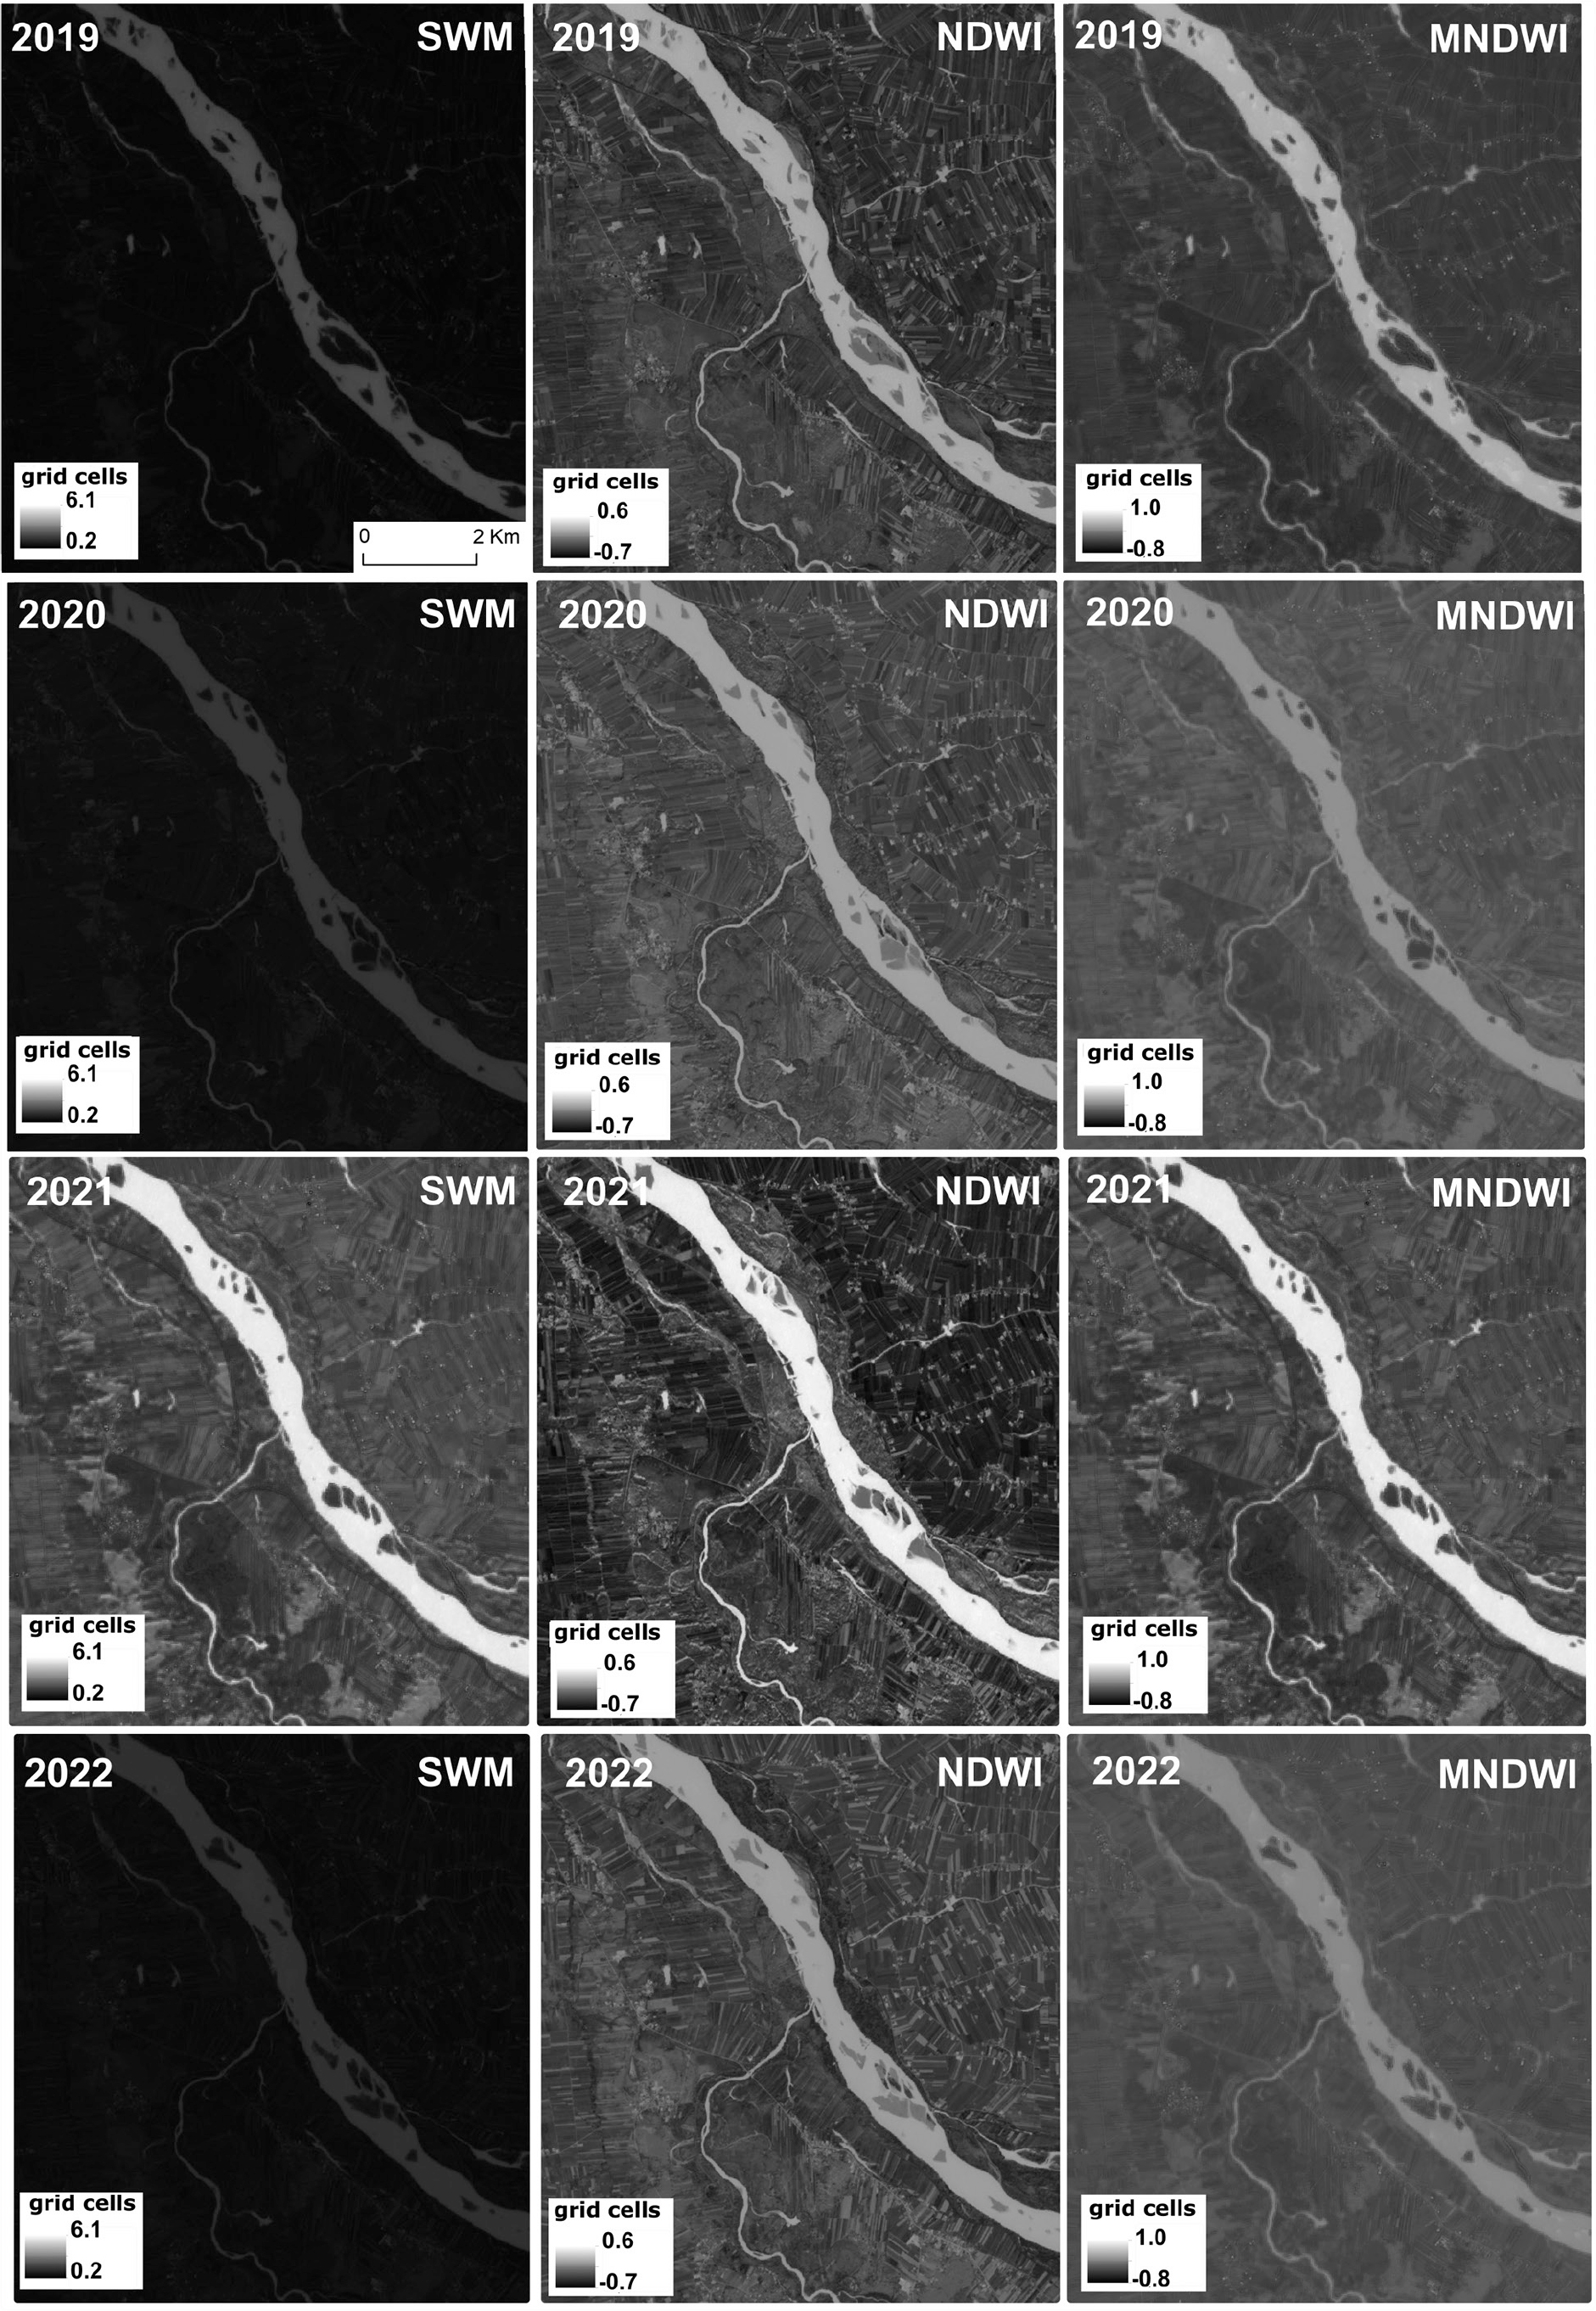
Fig. 5.
Water index maps for Research Area 2.
Table 3.
Basic characteristics of the applied spectral indices.
| Water Index | Equation | Reference |
|---|---|---|
| Normalized Difference Water Index (NDWI) | NDWI = (Green - NIR)/(Green + NIR) | McFeeters (1996) |
| Modified Normalized Difference Water Index (MNDWI) | MNDWI = (Green - SWIR)/(Green + SWIR) | Xu (2006) |
| the Sentinel Water Mask (SWM) | SWM = (Blue + Green)/(NIR + SWIR) | Robak et al. (2016) |
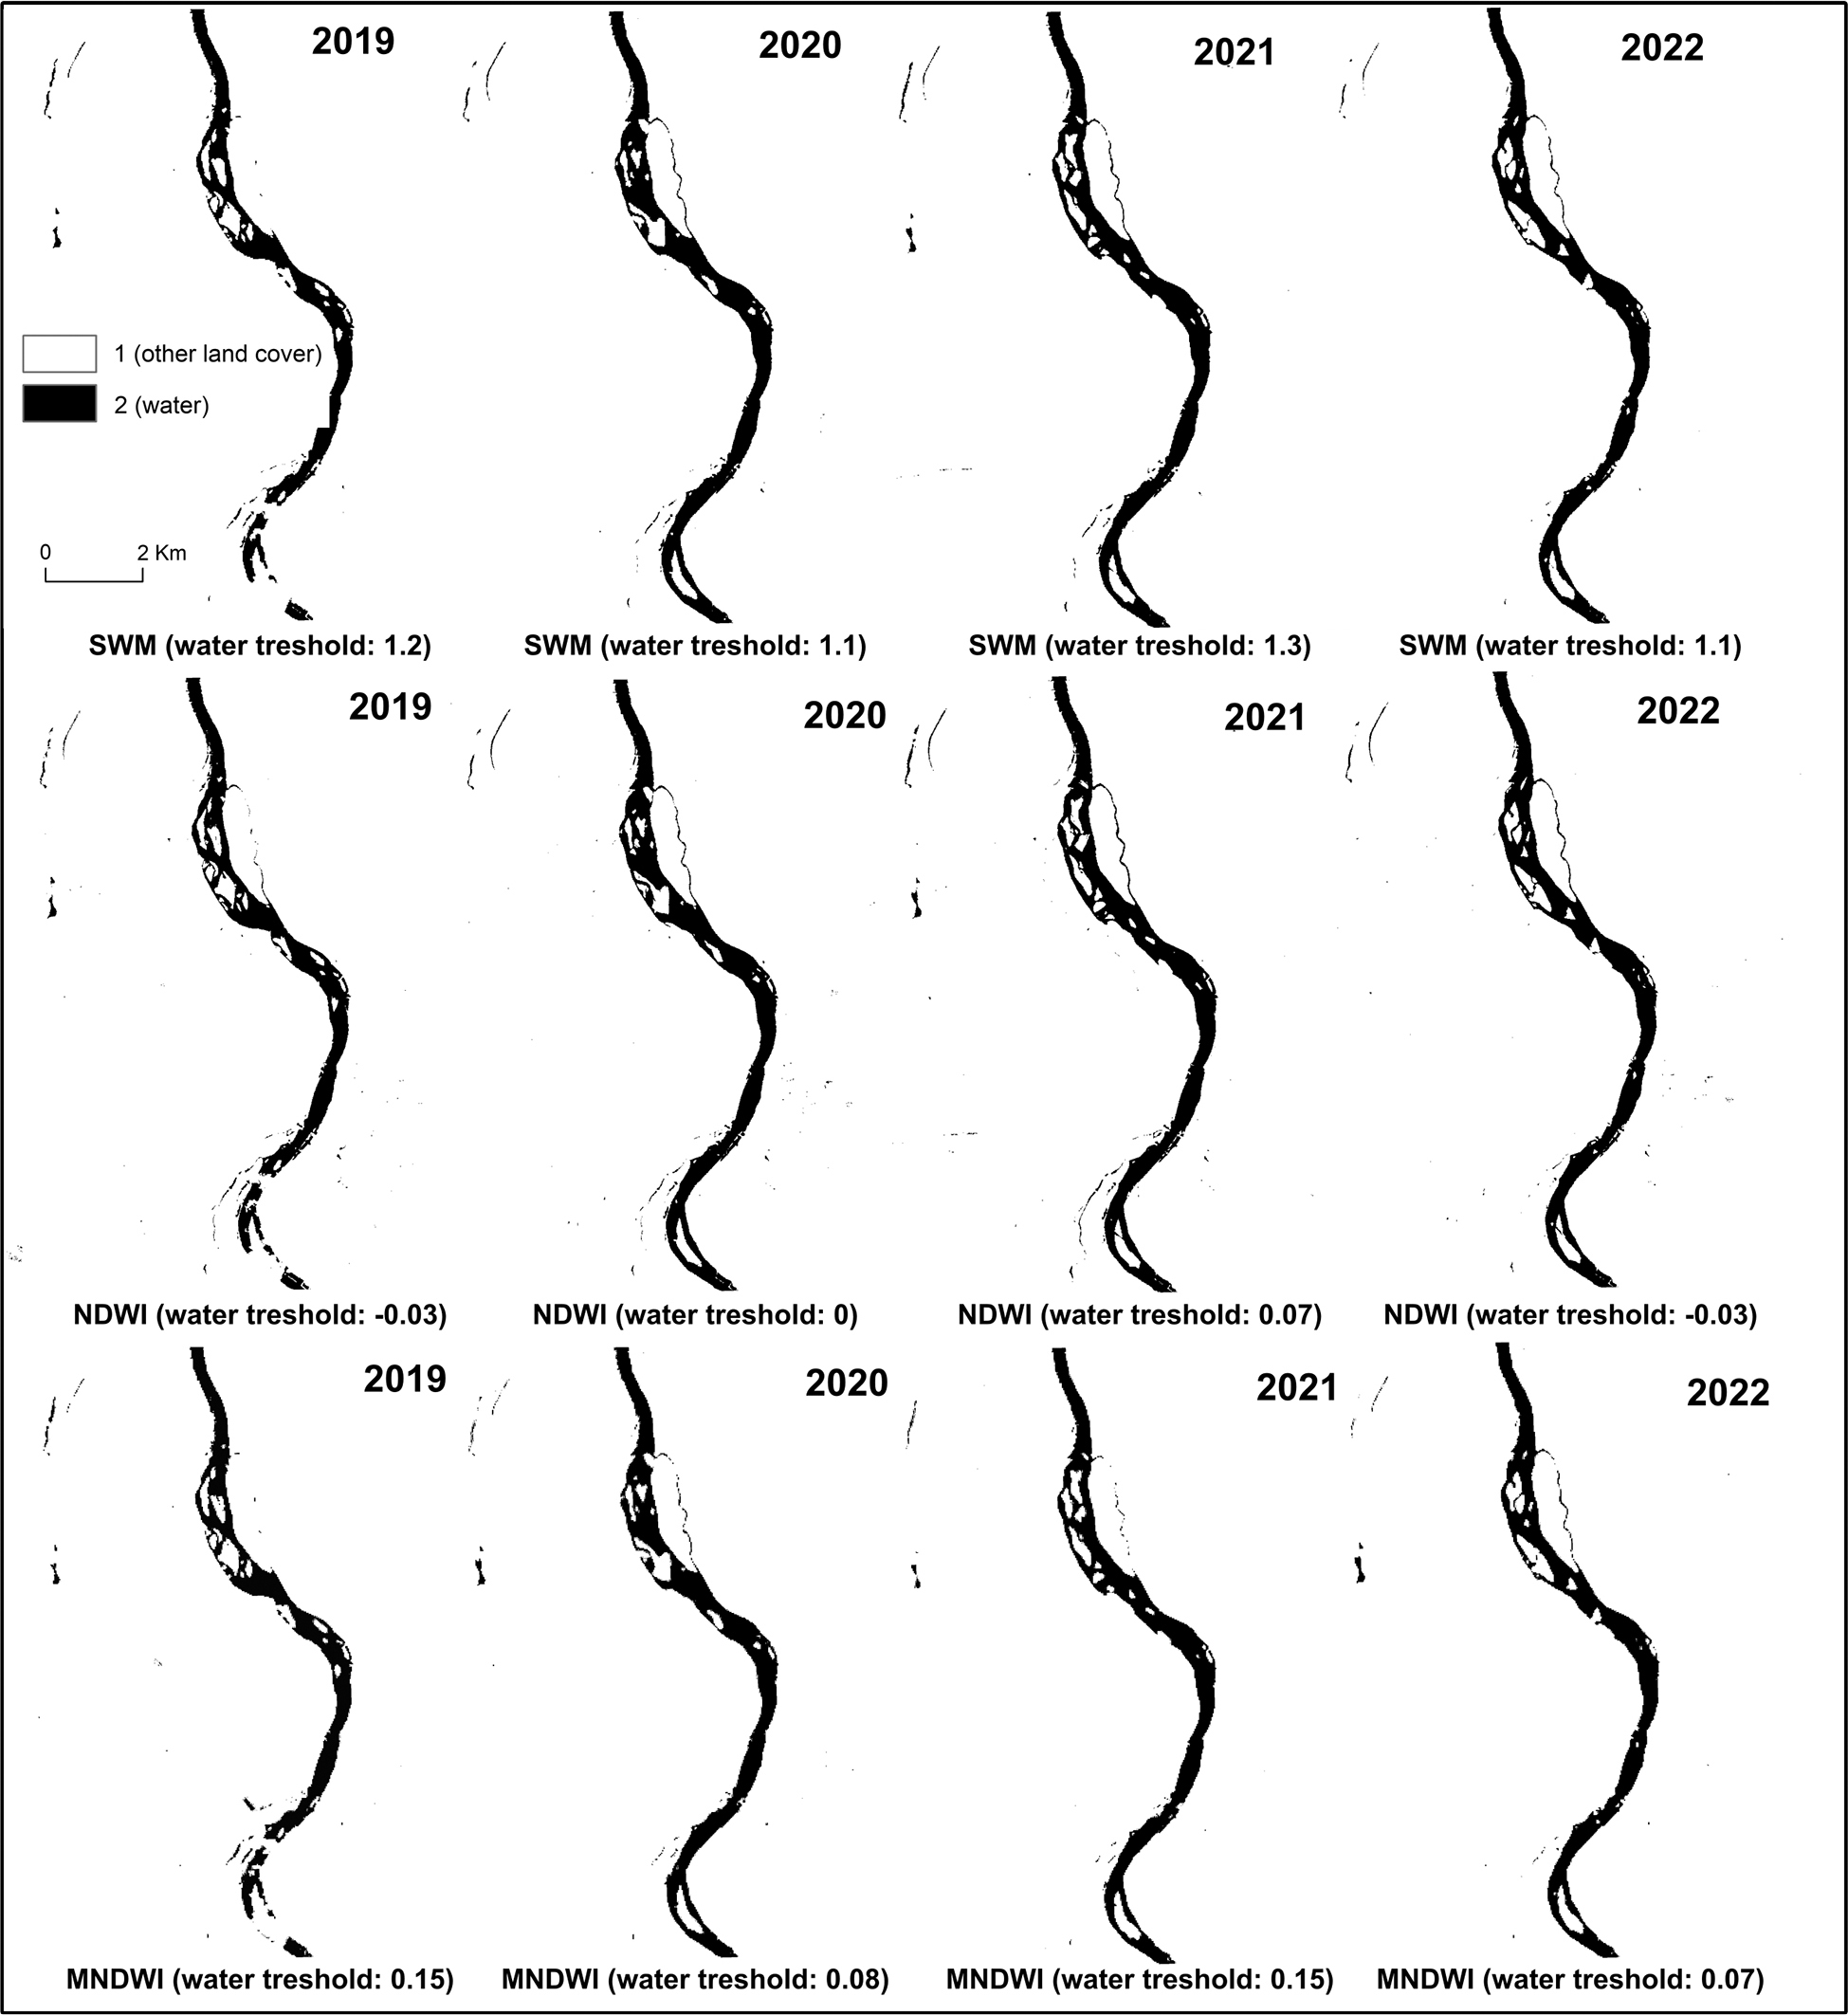
Fig. 6.
Thresholded spectral indices for Research Area 1.
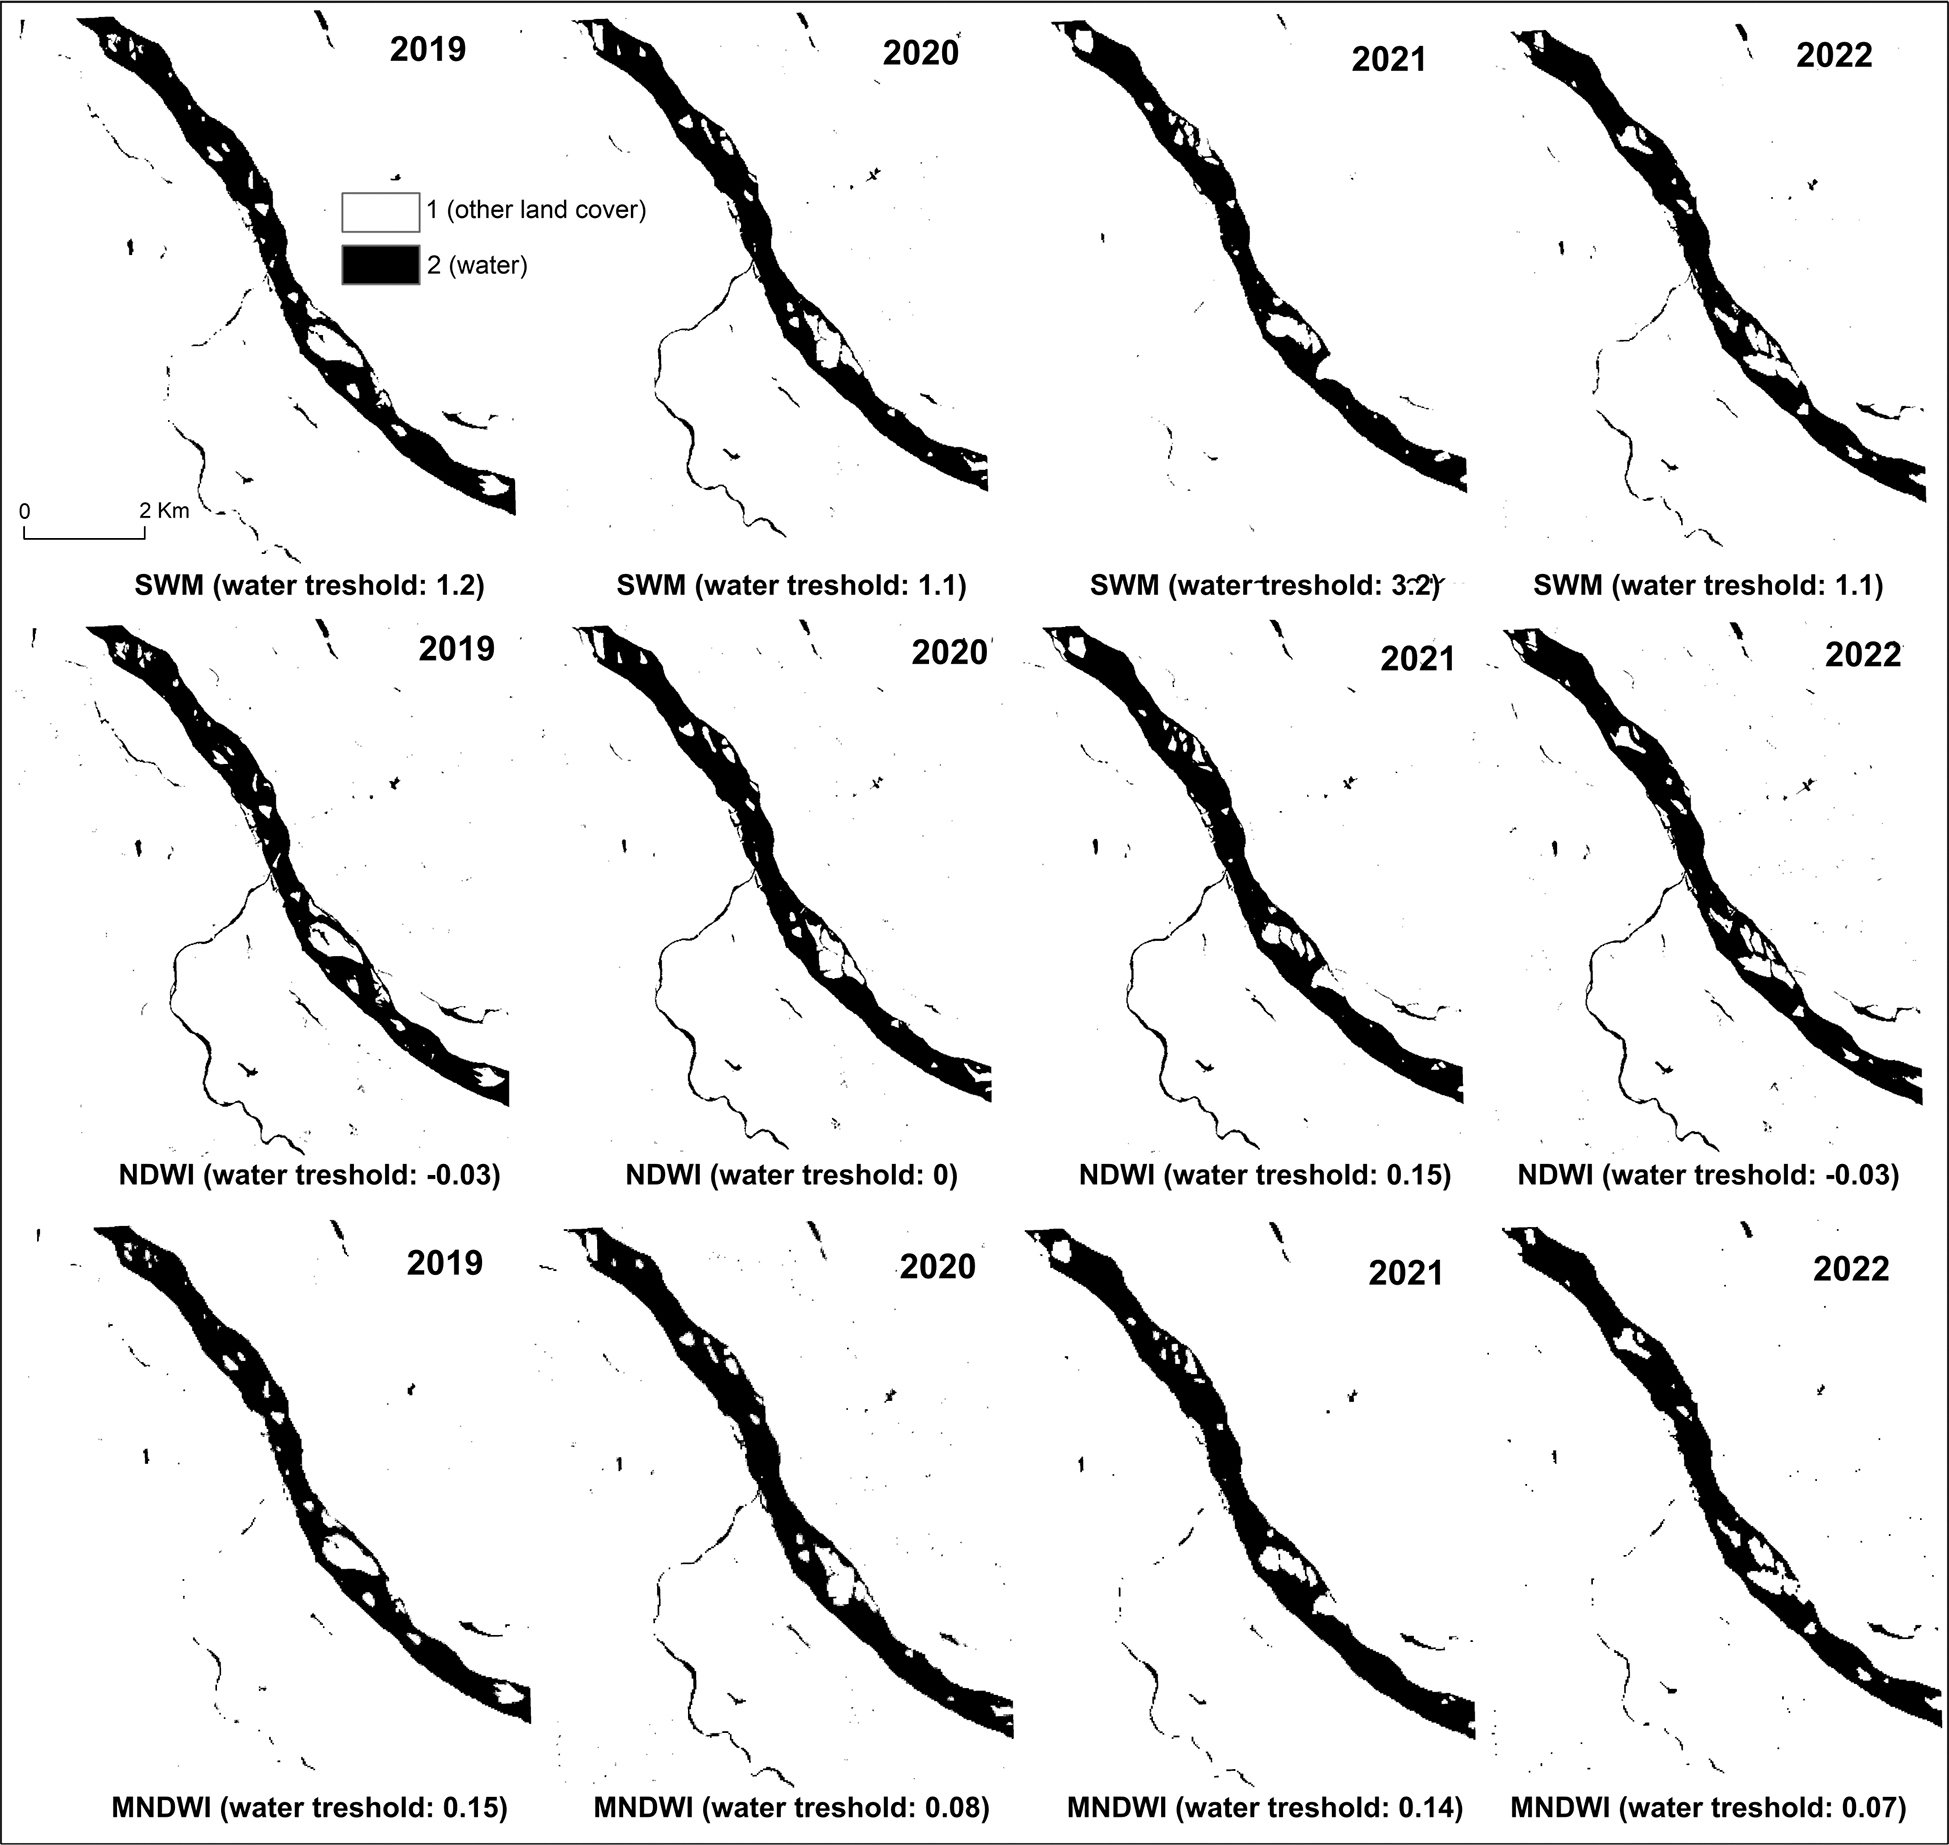
Fig. 7.
Thresholded spectral indices for Research Area 2.
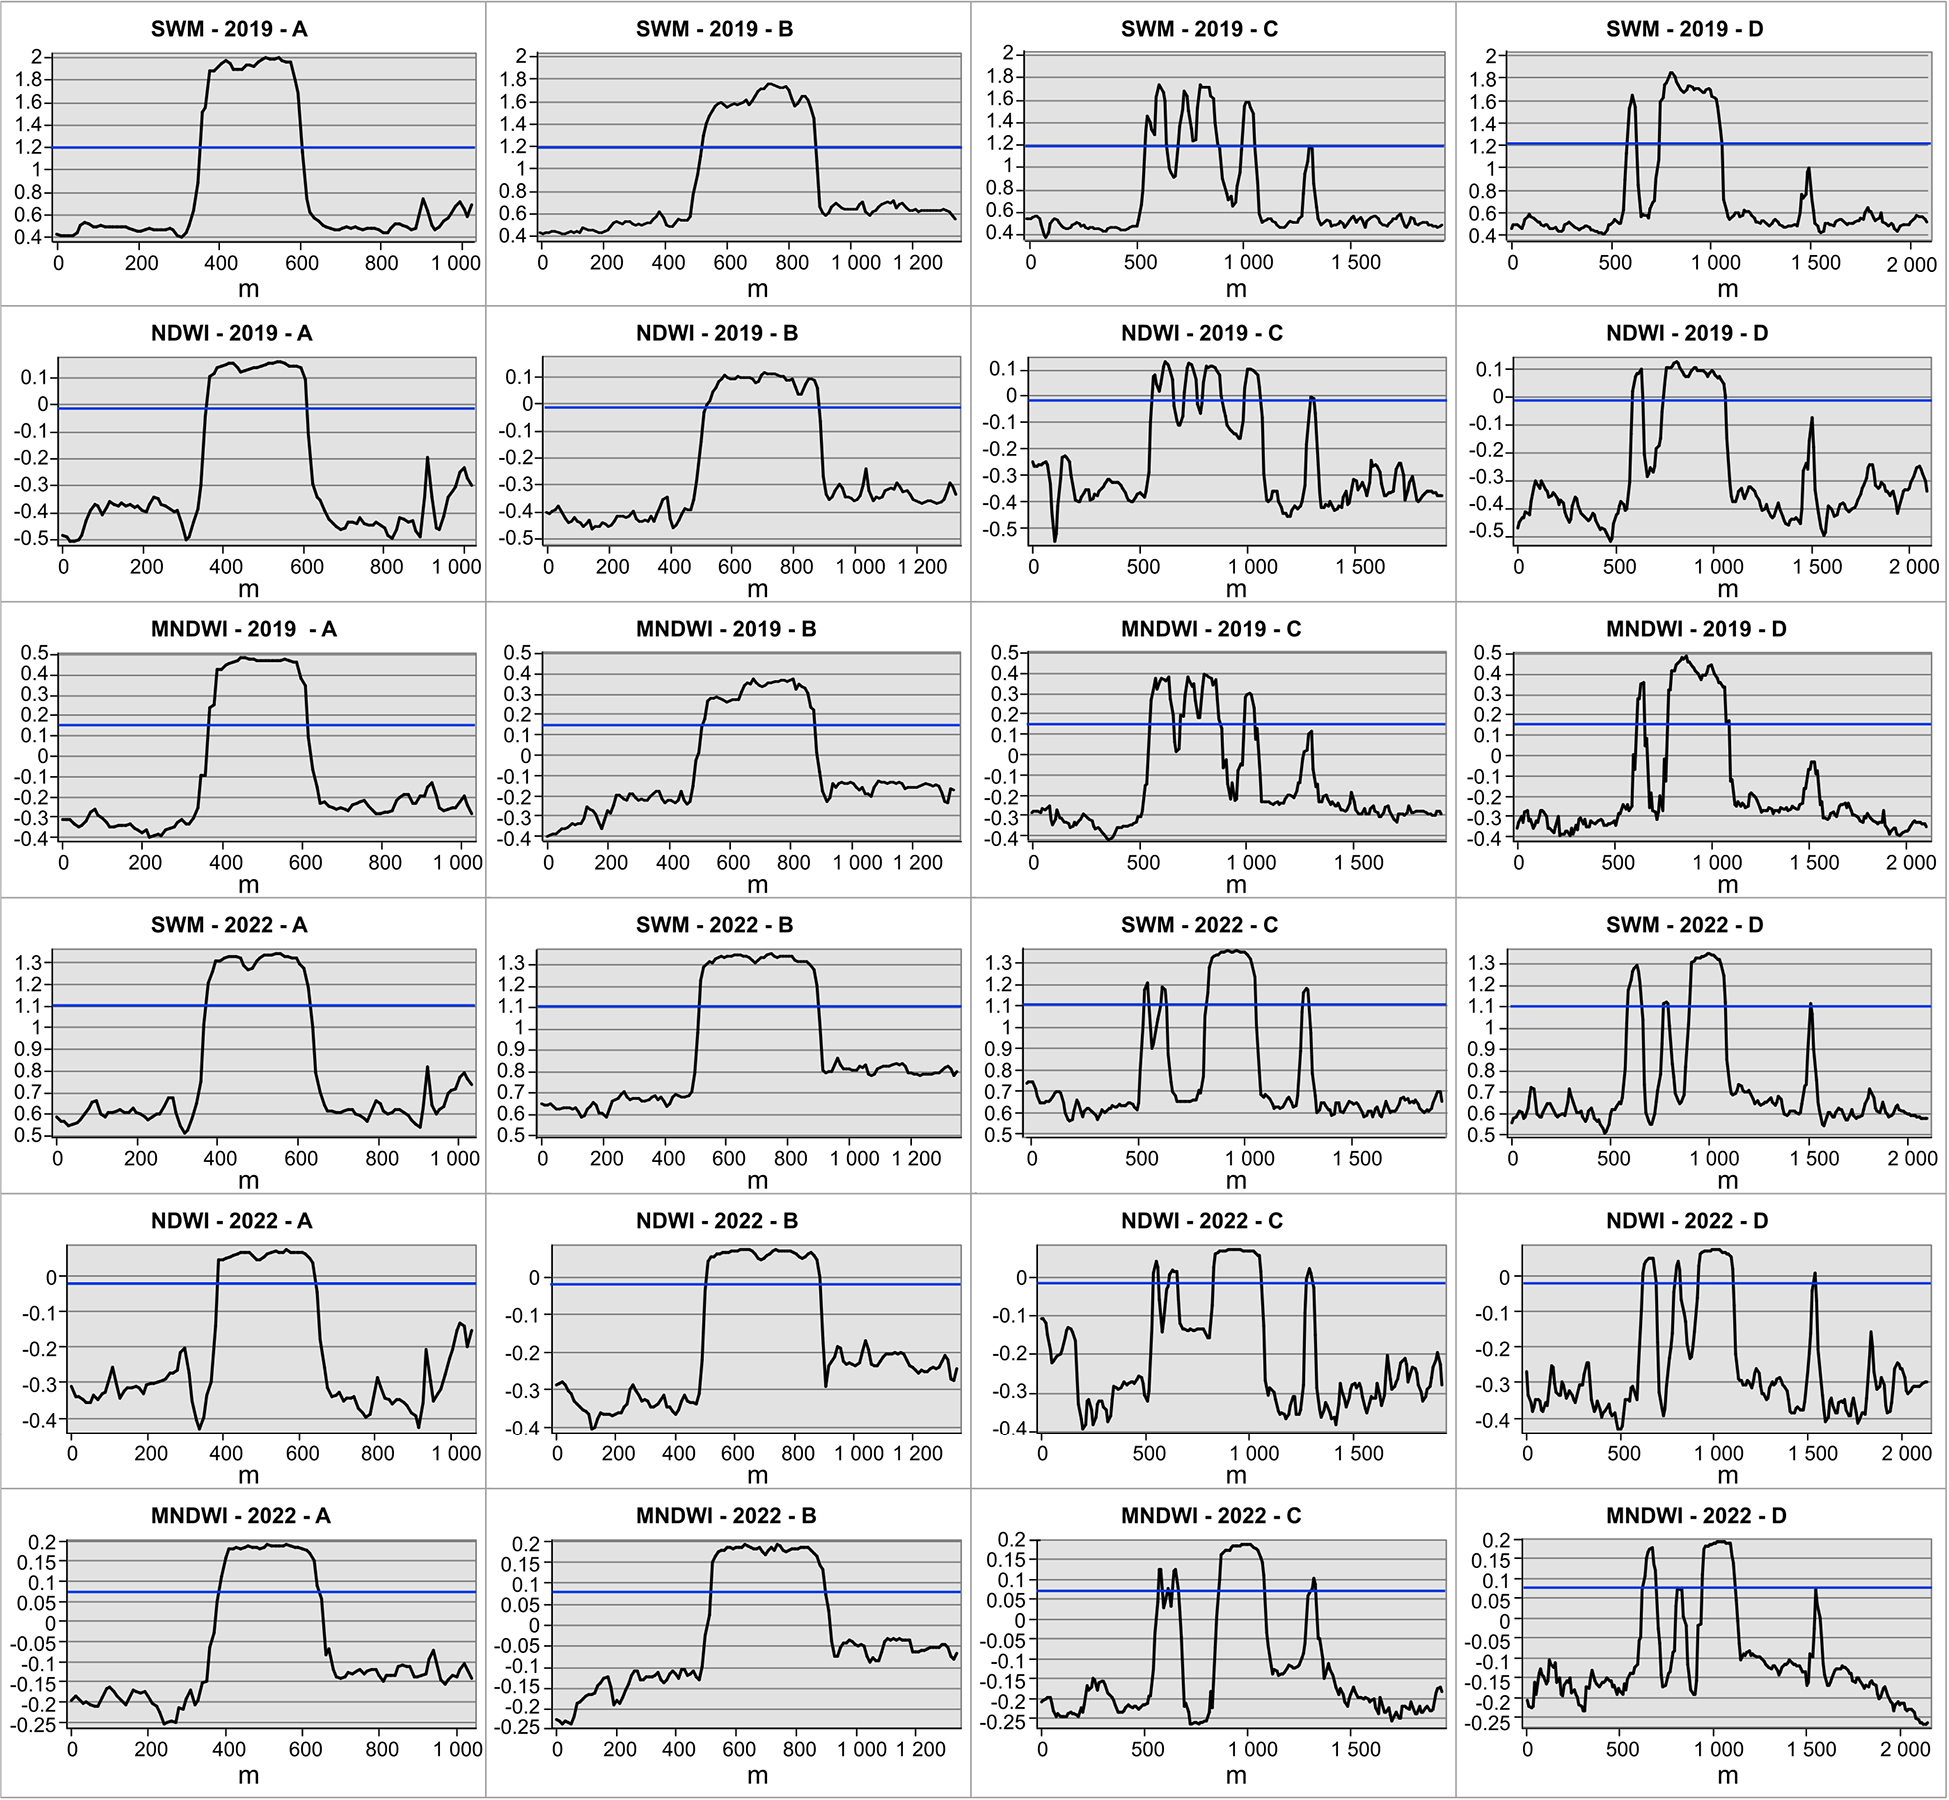
Fig. 8.
Cross-sections across the Vistula River in Research Area 1, running through three land-cover classes: water, river bars and riparian vegetation. The location of the profiles is shown in Fig. 2. The blue line indicates the adopted threshold value.
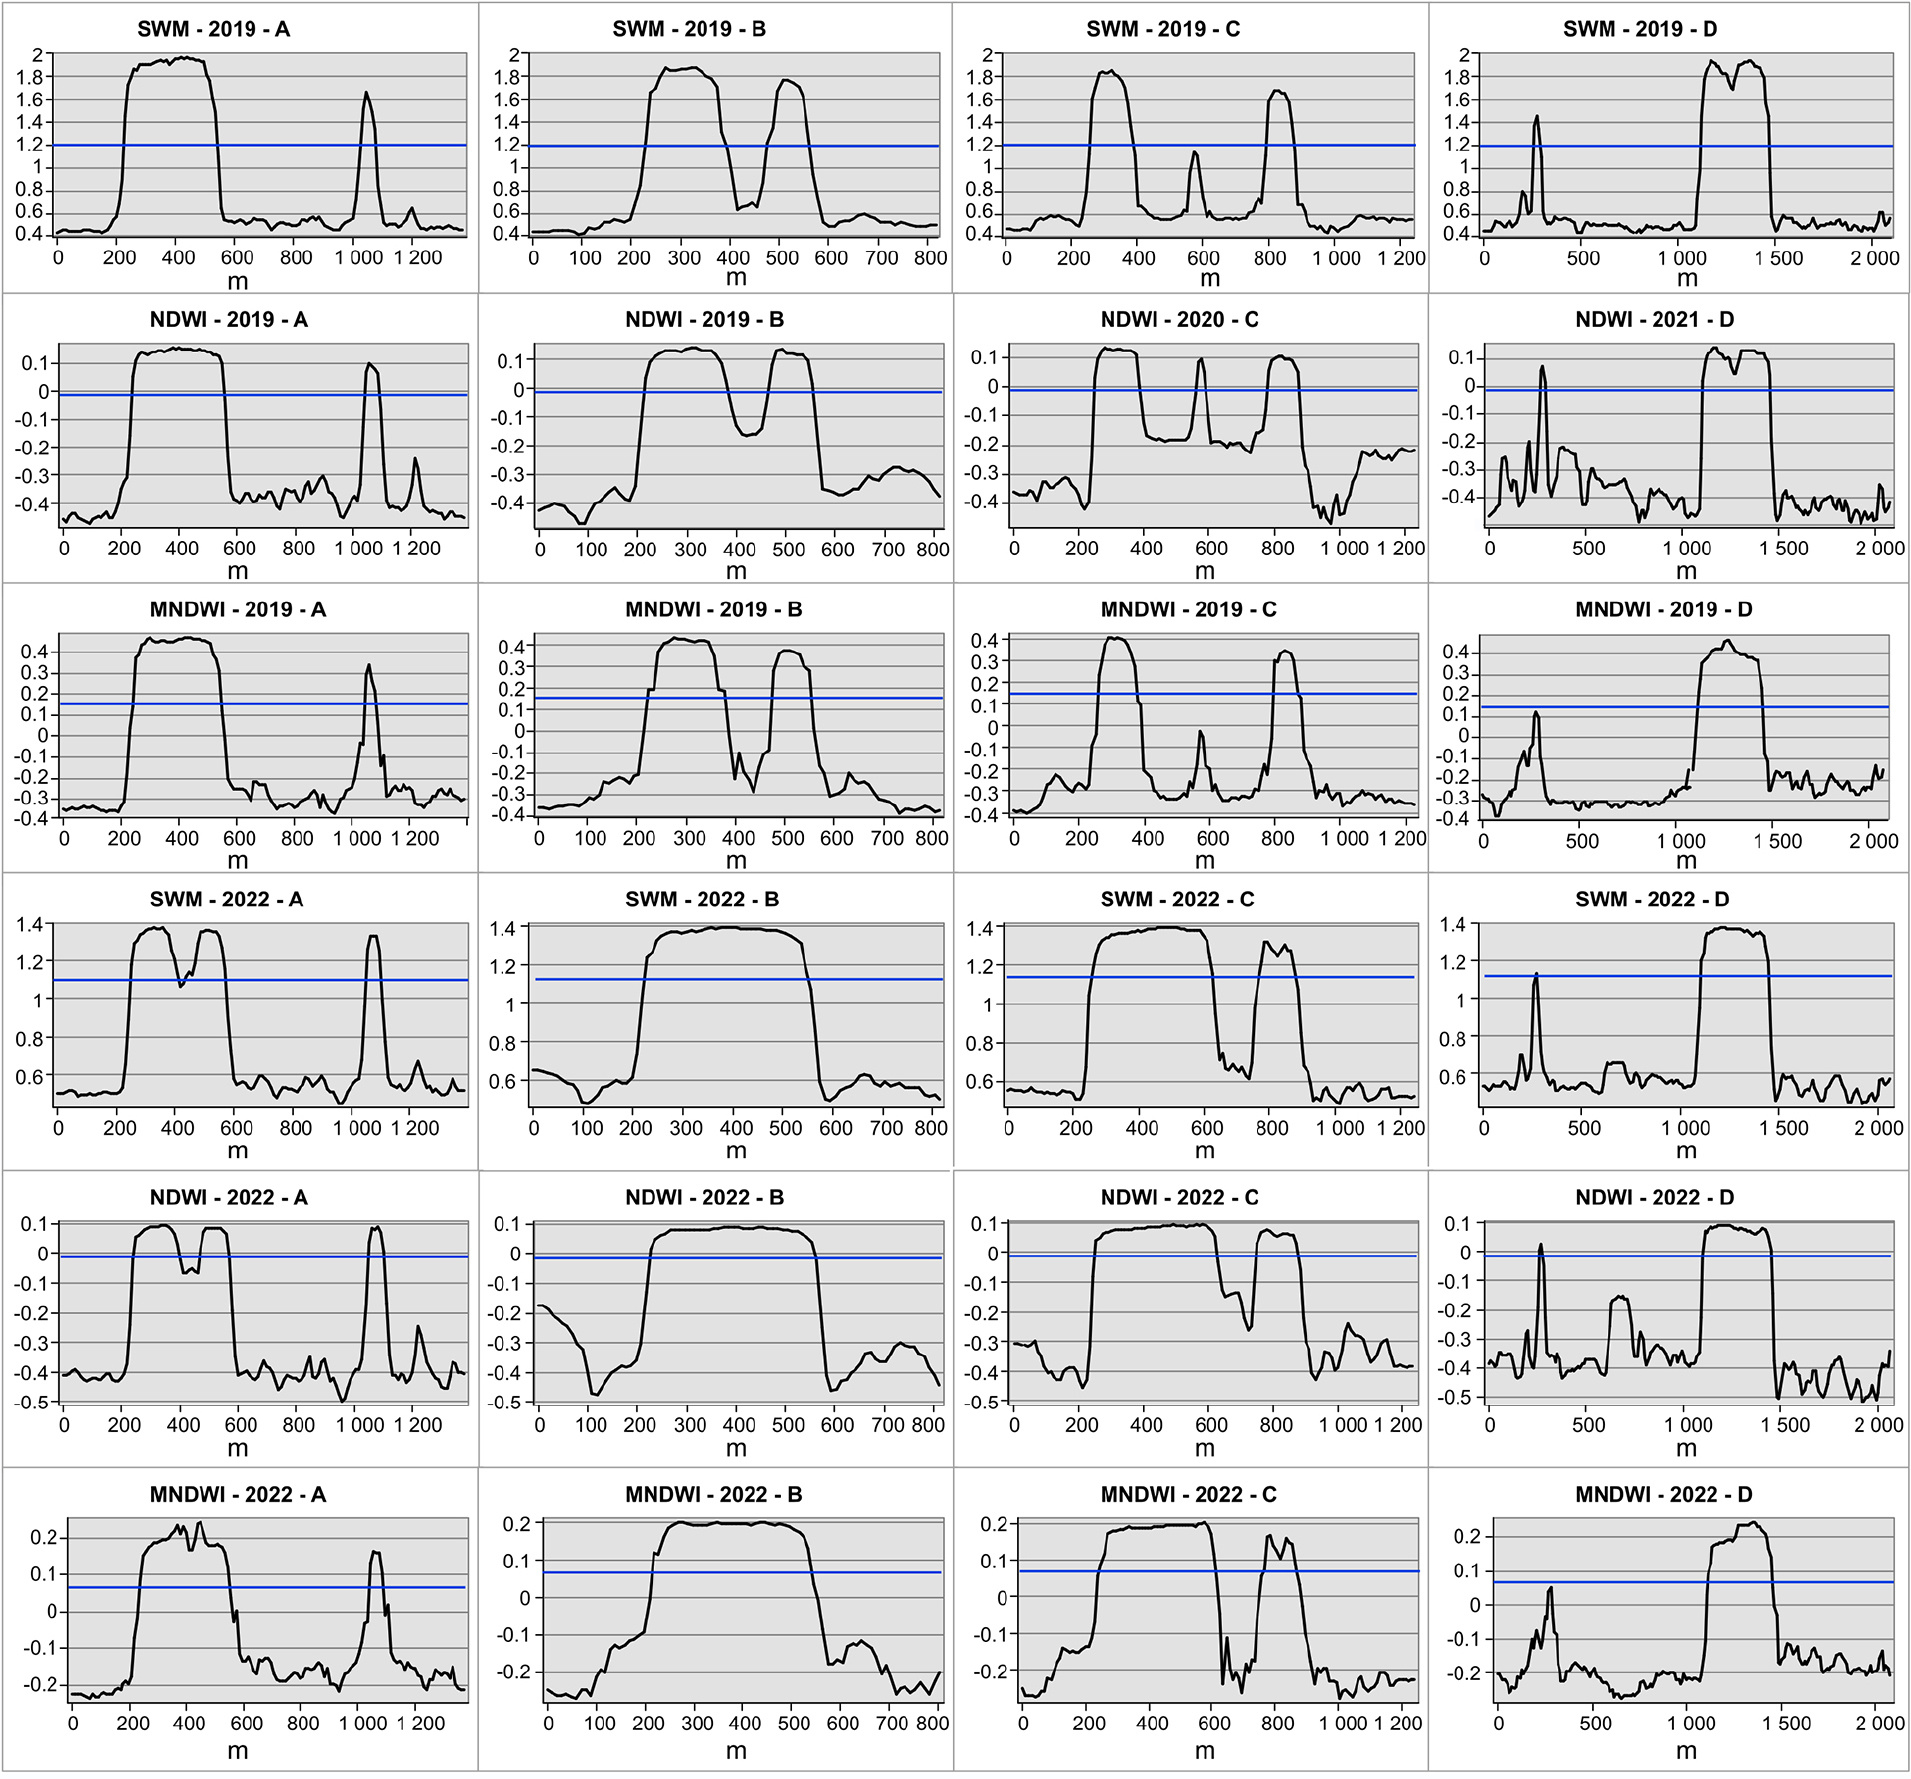
Fig. 9.
Cross-sections across the Vistula River in Research Area 2, running through three land-cover classes: water, river bars and riparian vegetation. The location of the profiles is shown in Fig. 2. The blue line indicates the adopted threshold value.
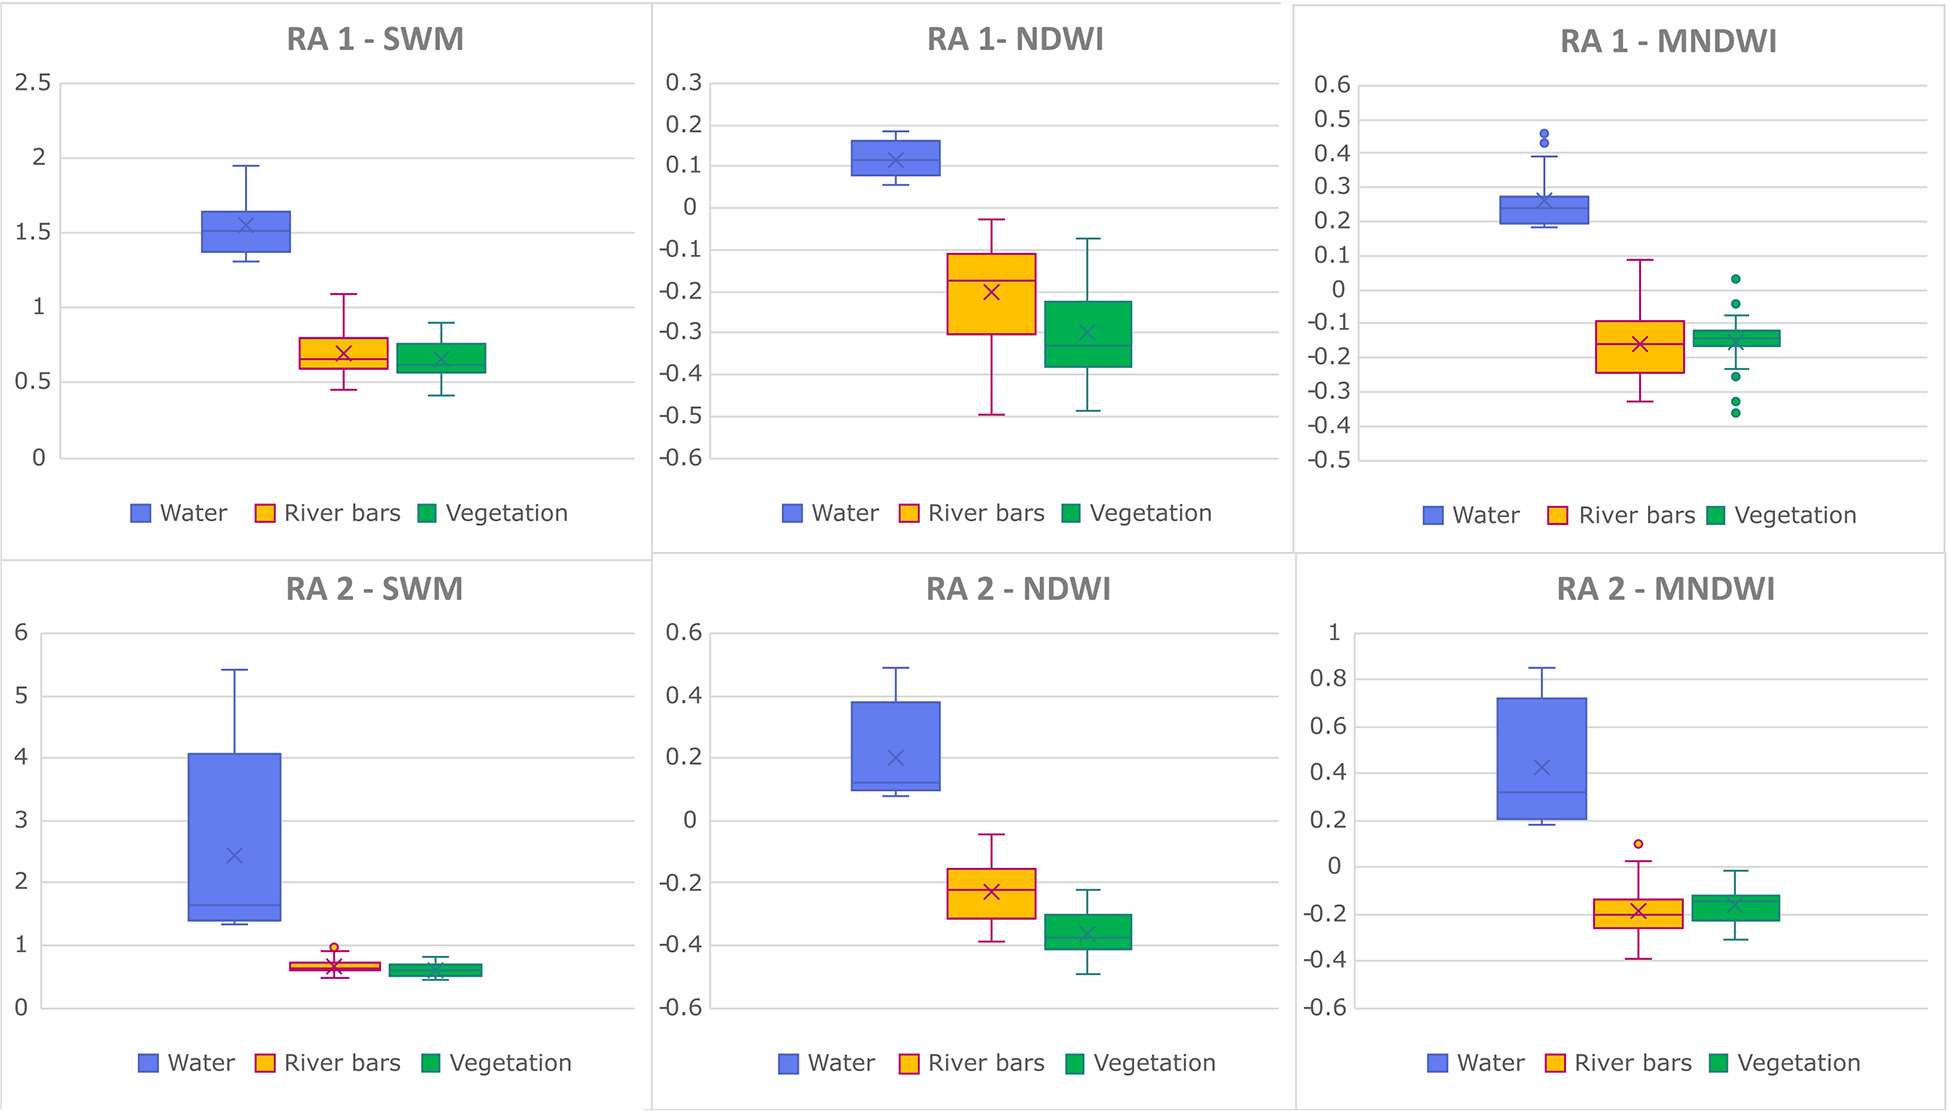
Fig. 10.
Diagram presenting the variability of indices values within three land-cover classes: water, river bars and riparian vegetation.
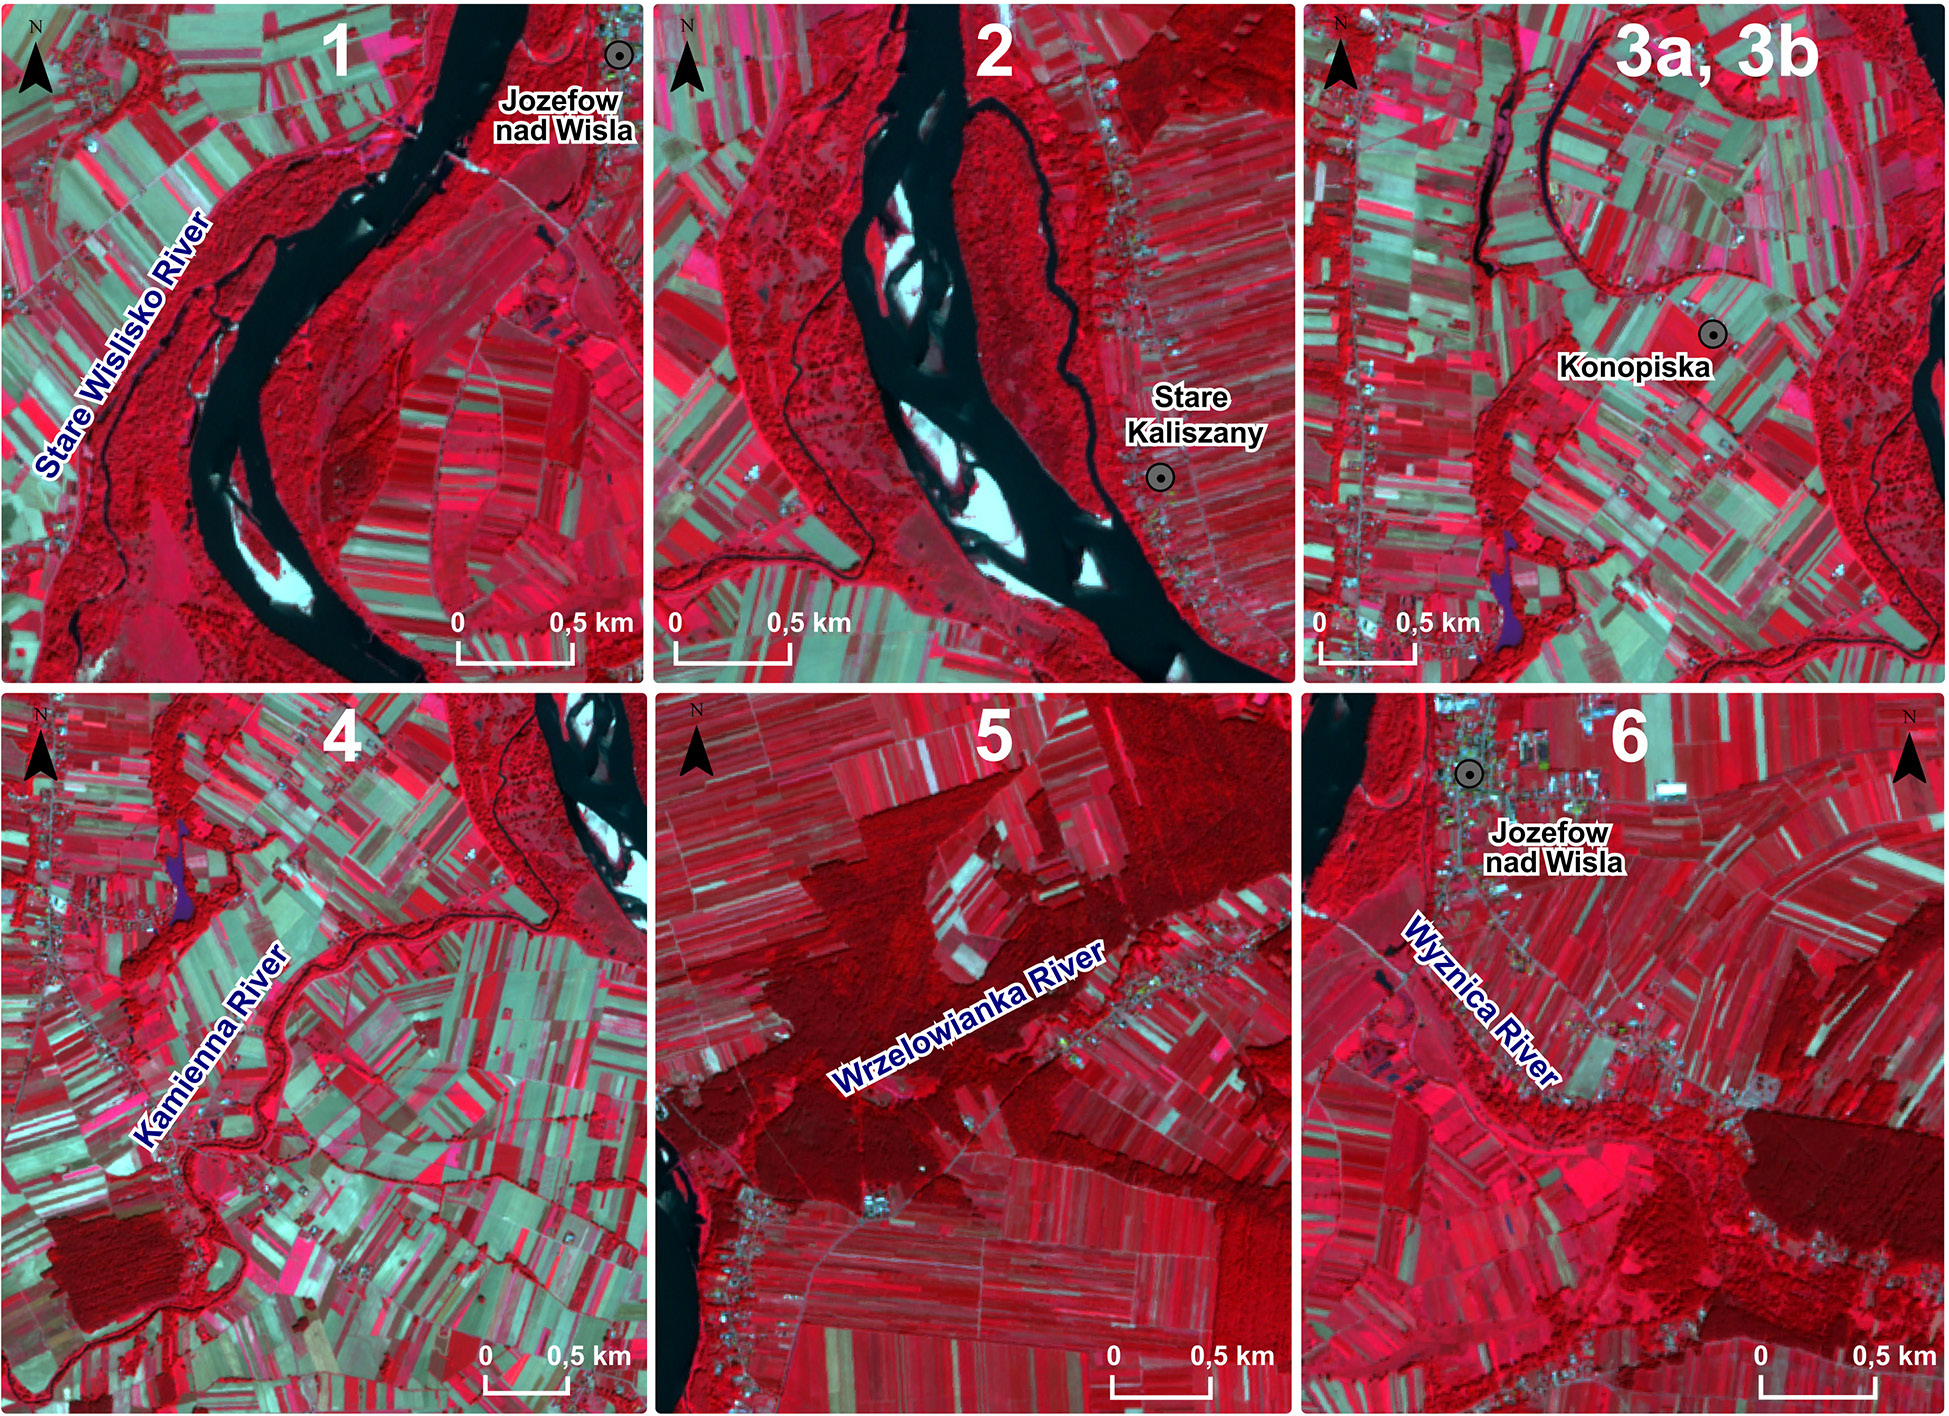
Fig. 11.
Selected test areas within Research Area 1 in the CIR composition in the year 2022.
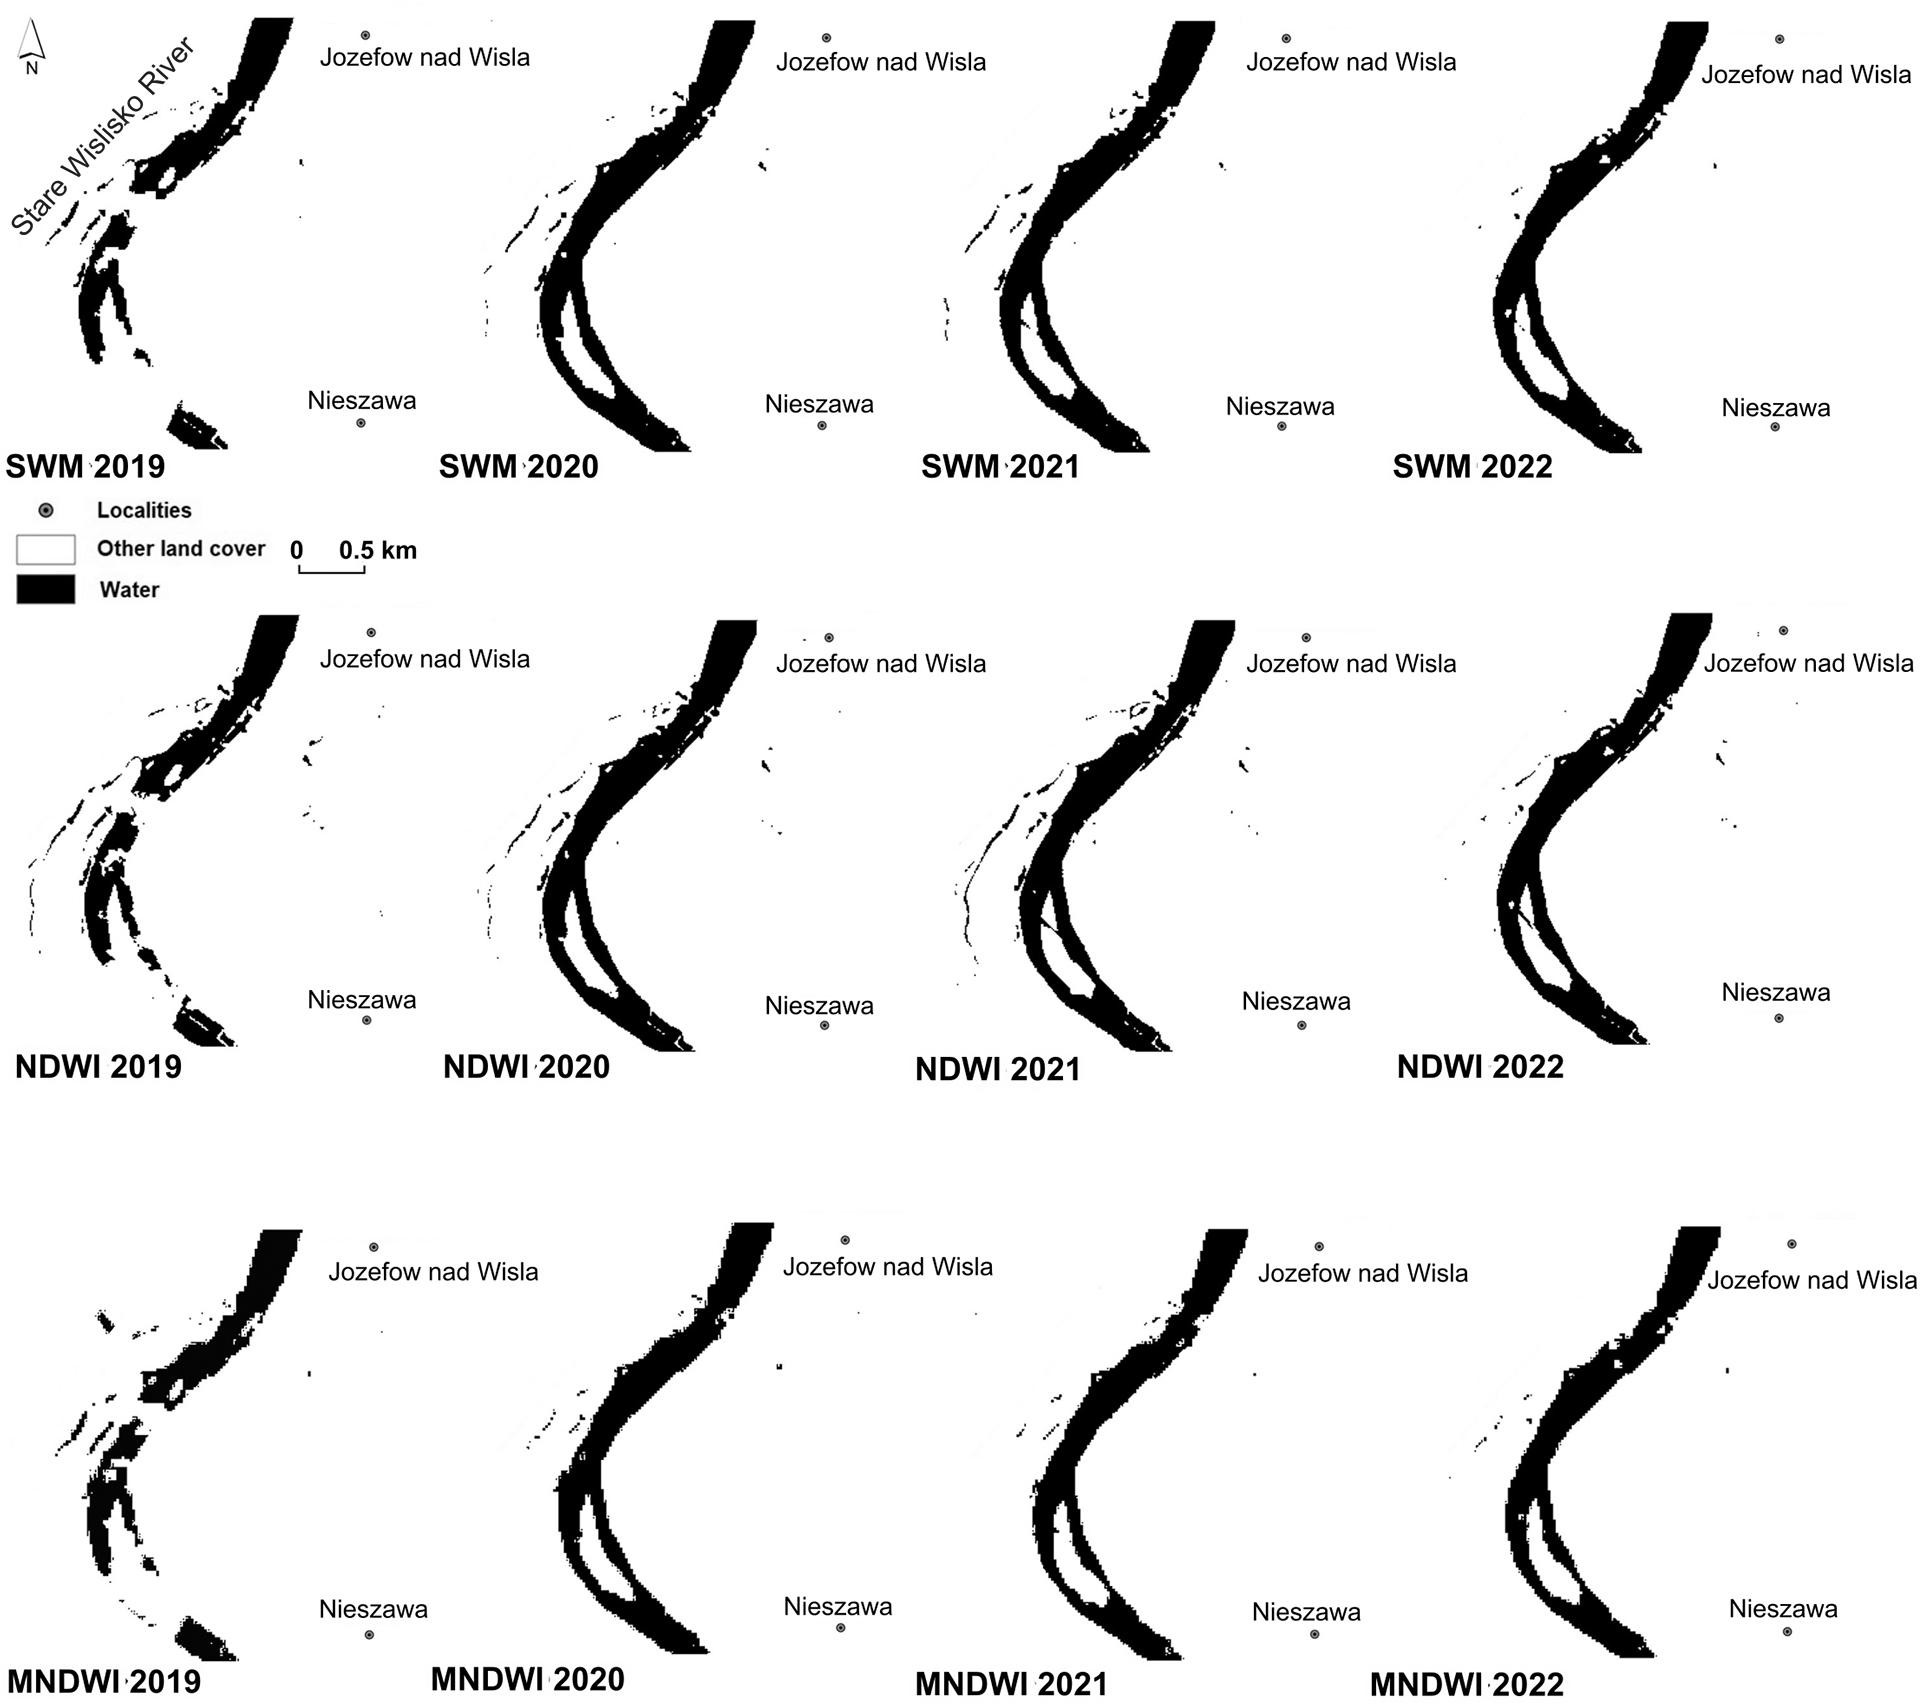
Fig. 12.
Thresholded water indices for test area 1 (Stare Wislisko) in the years 2019–2022.
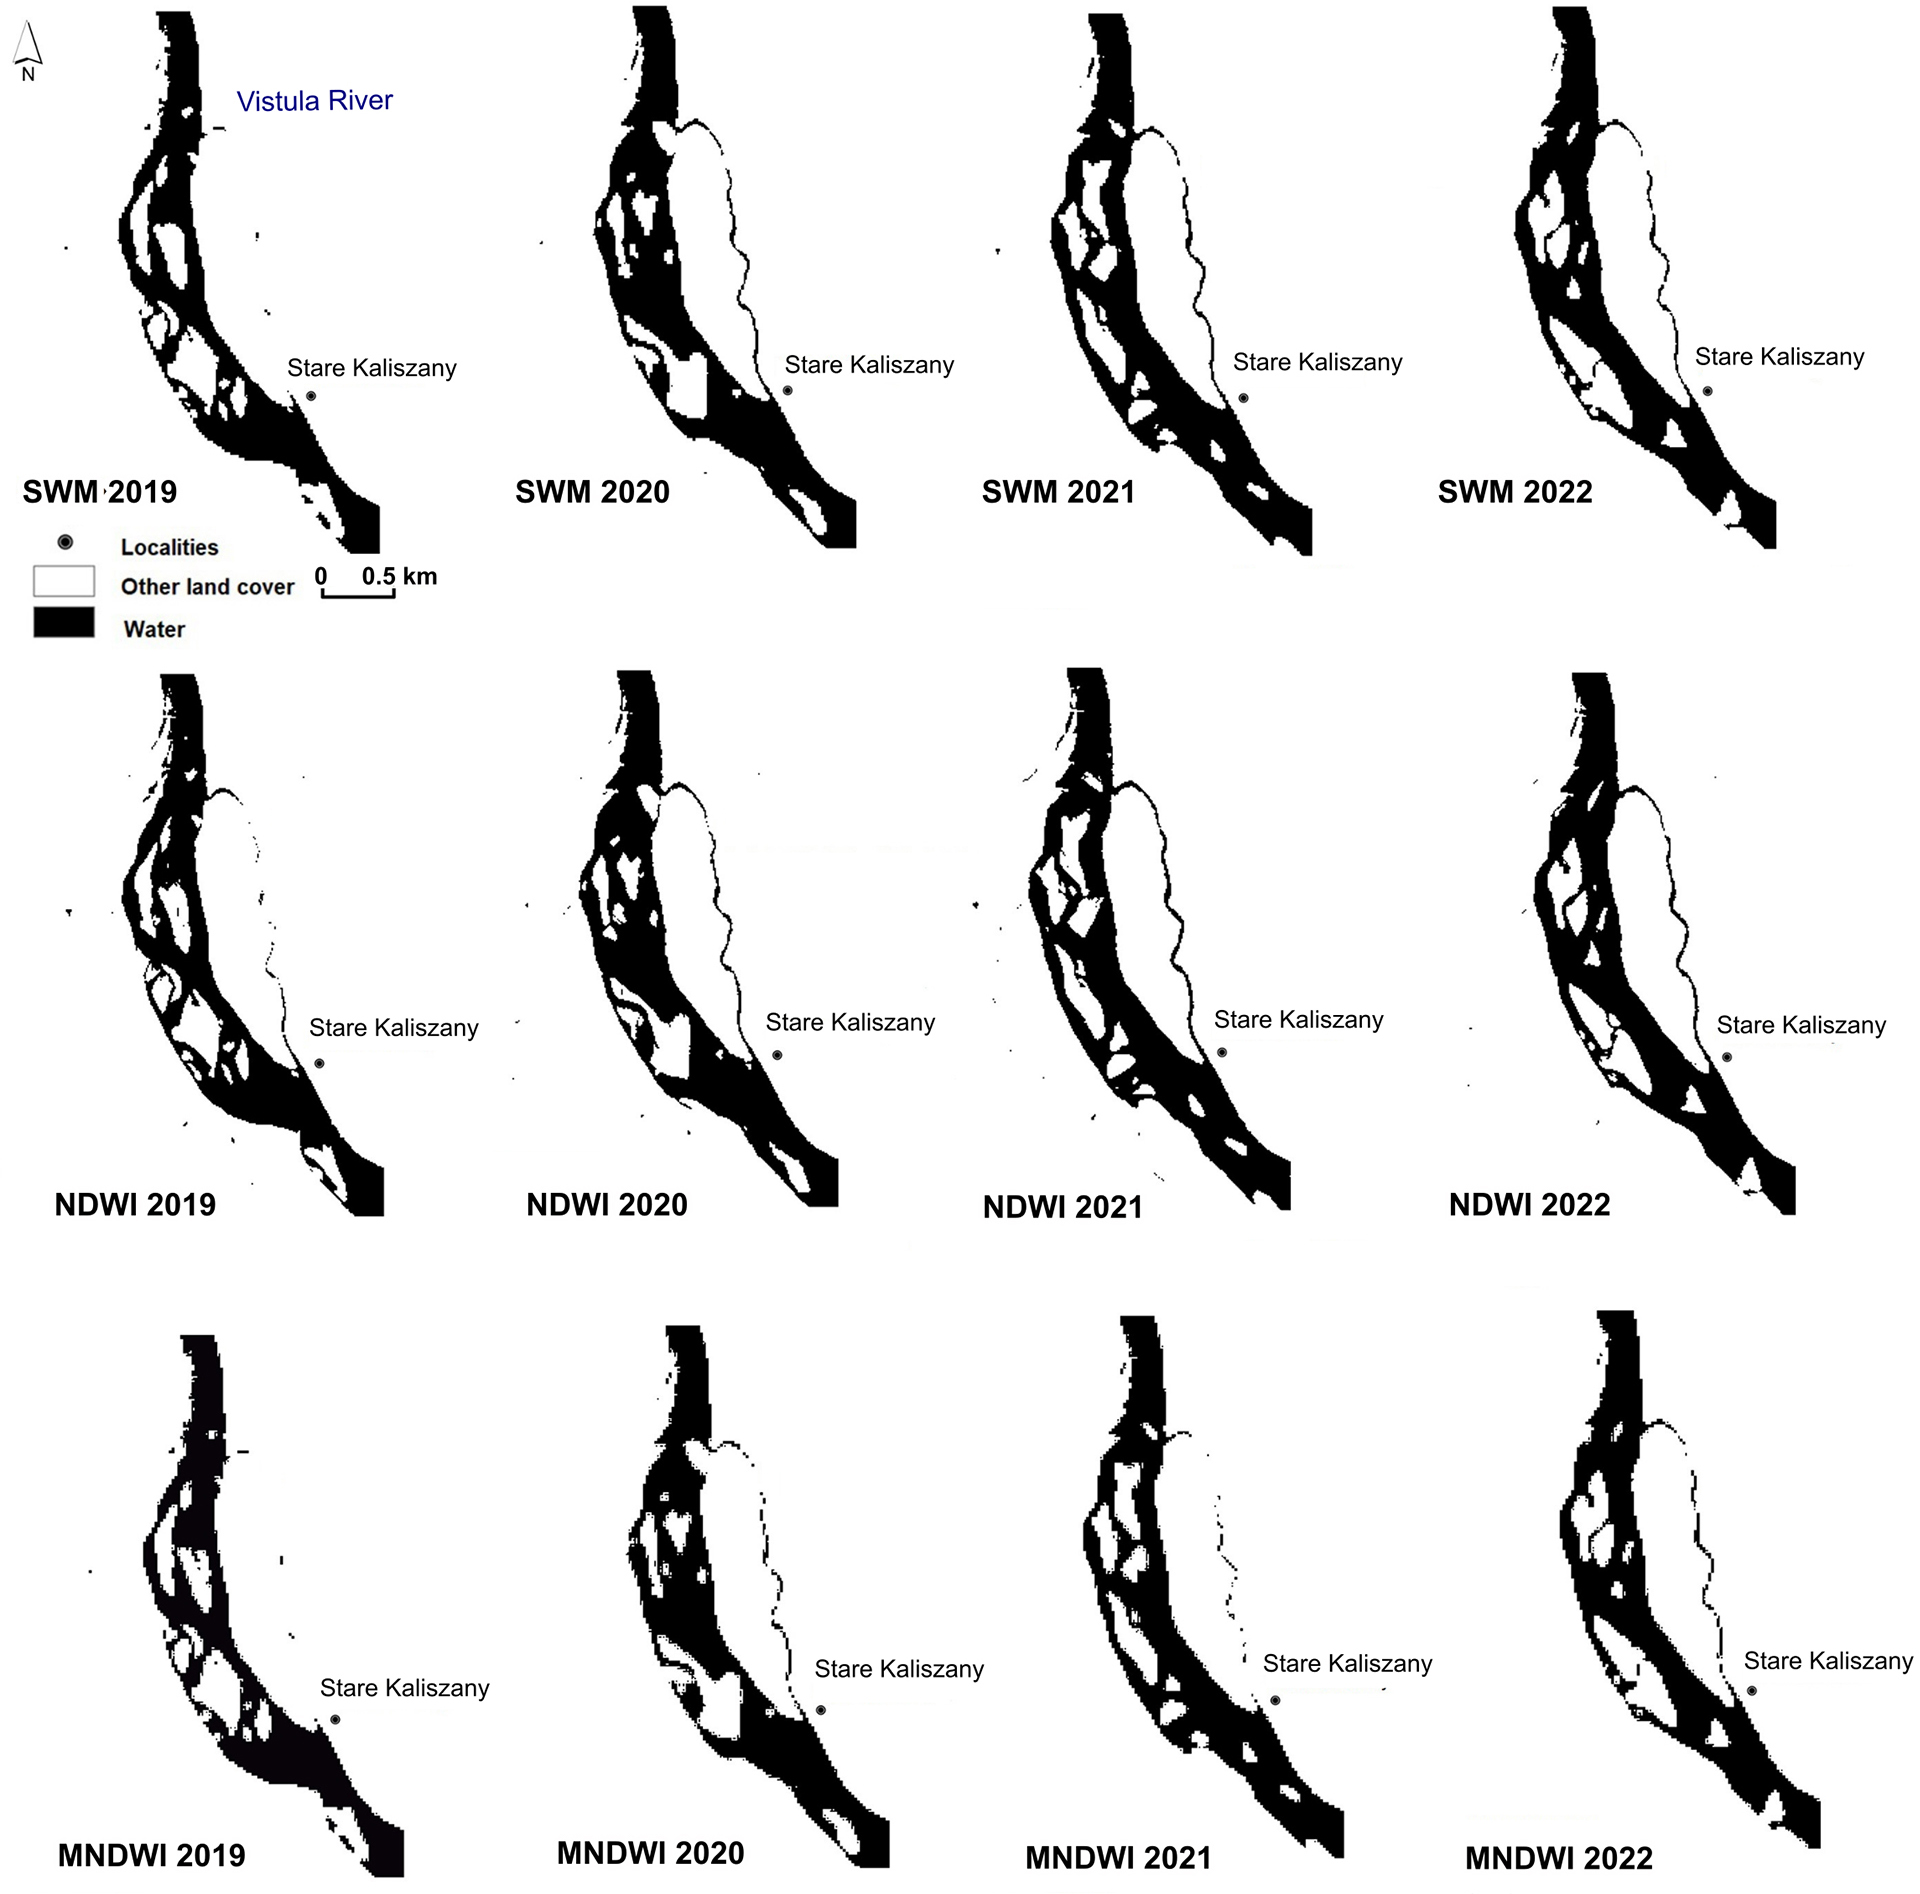
Fig. 13.
Thresholded water indices for test area 2 (branch of the Vistula River) in the years 2019–2022.
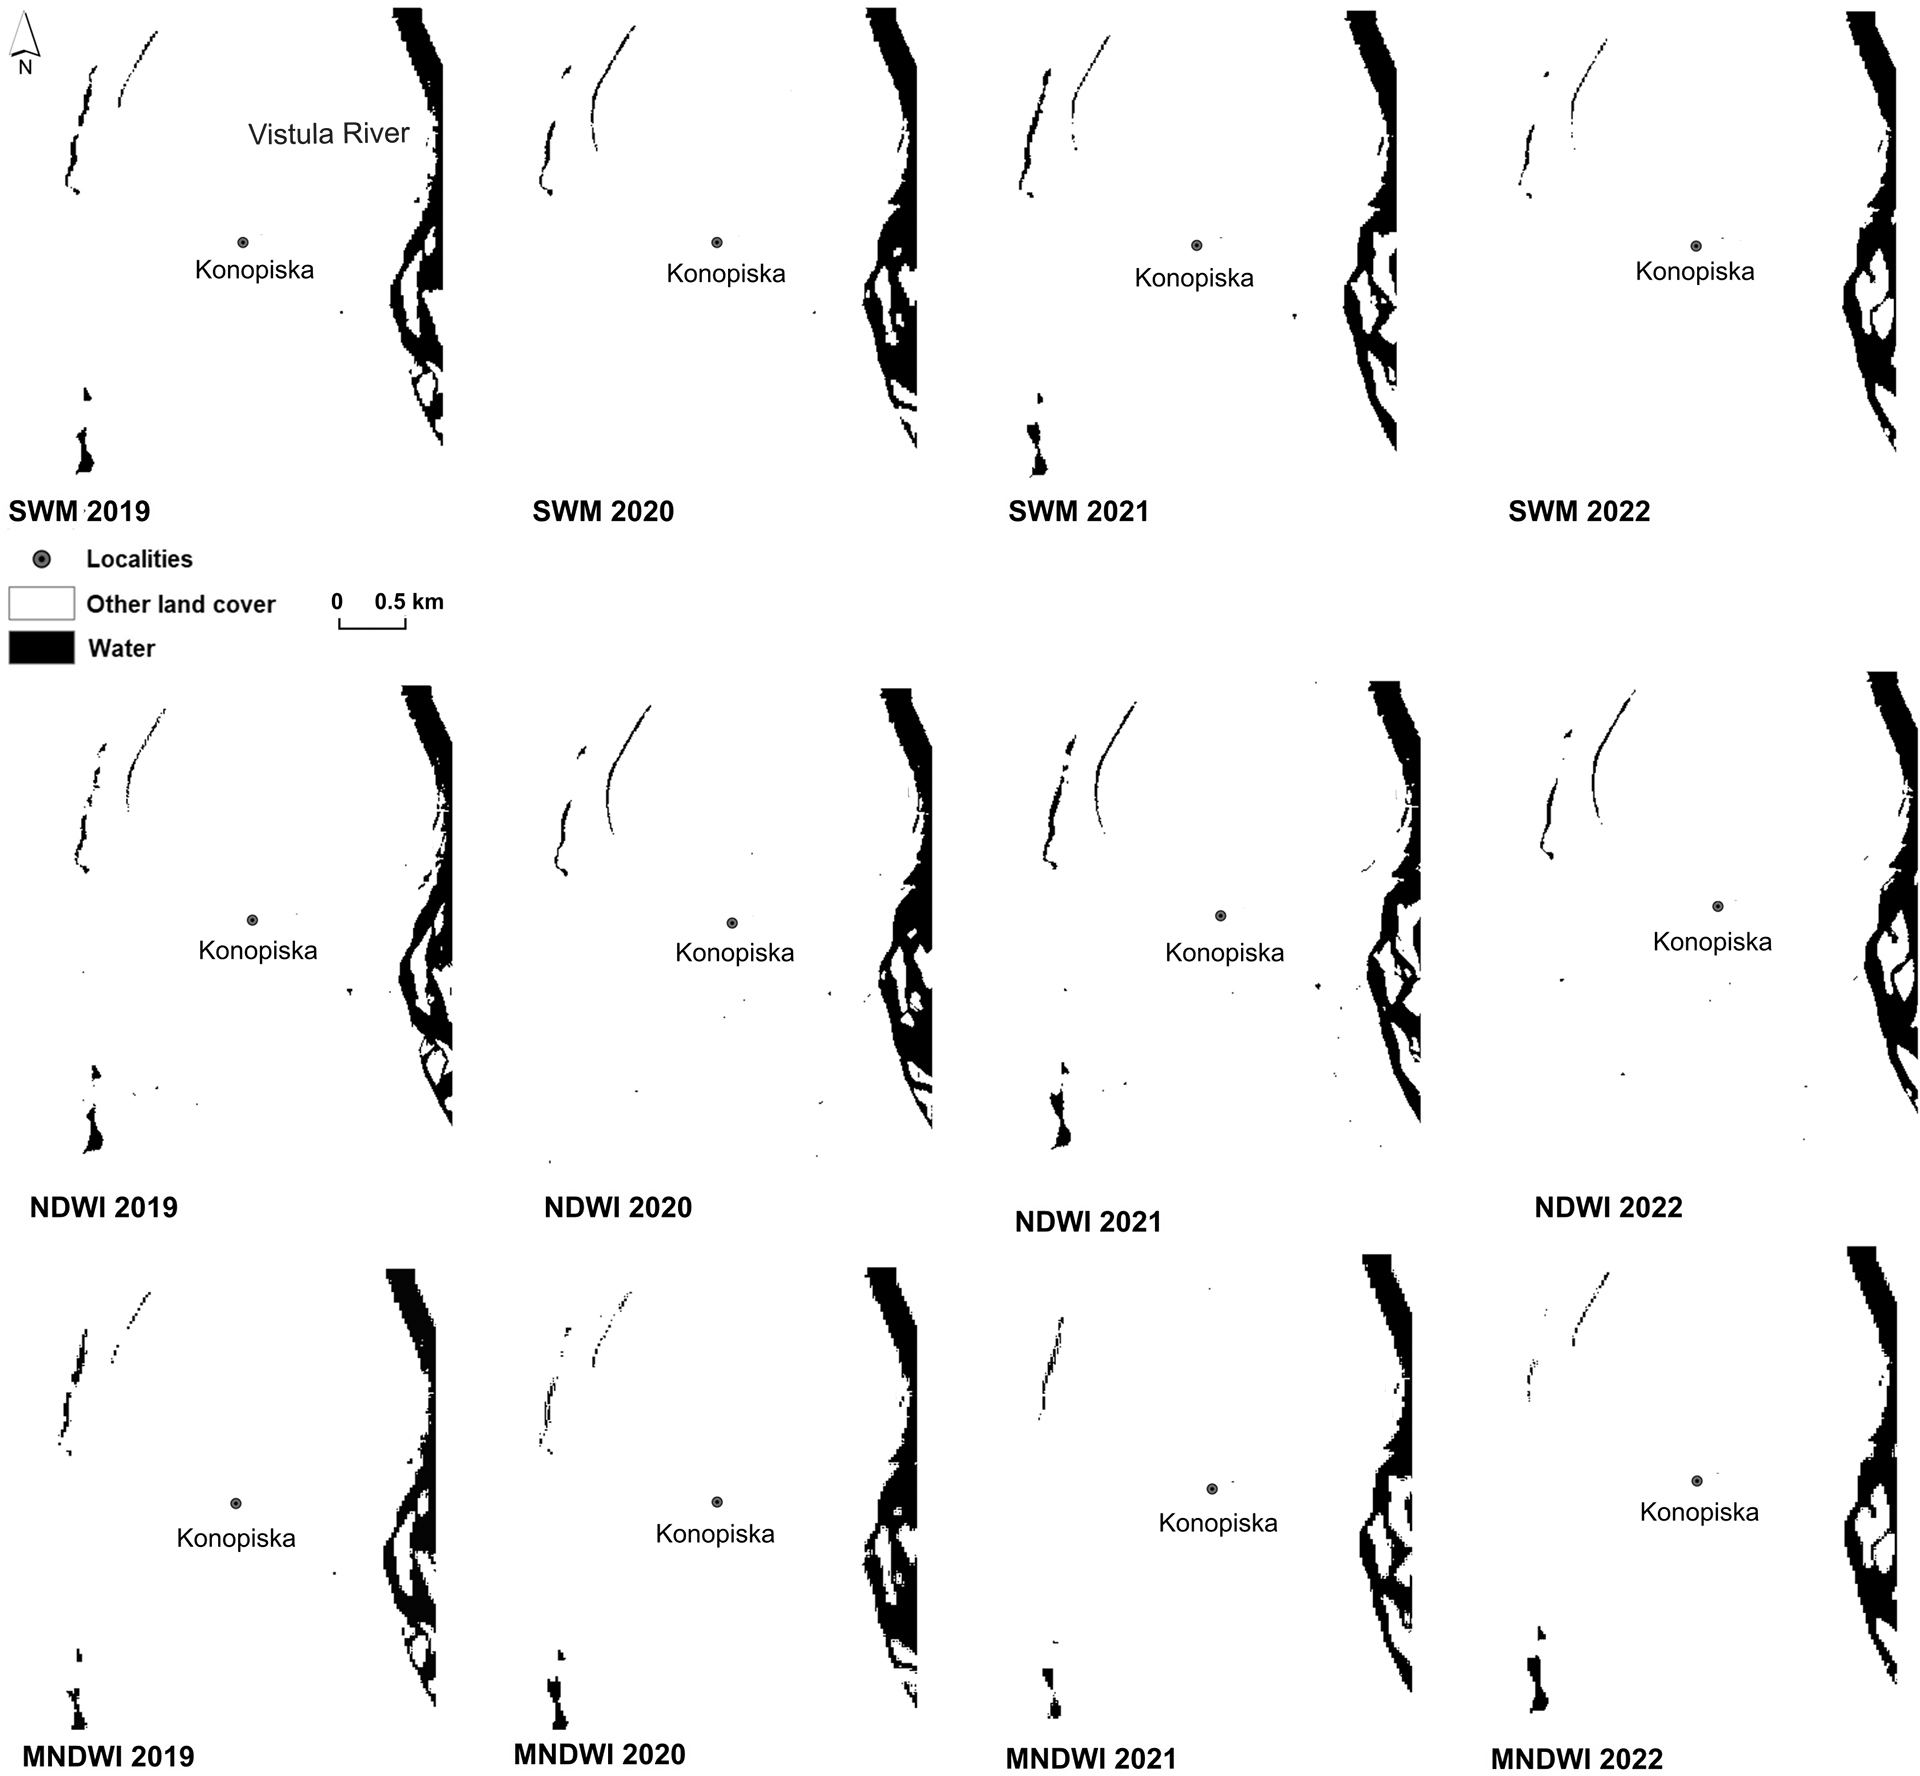
Fig. 14.
Thresholded water indices for test areas 3a and 3b (an example of water bodies in Research Area 1) in the years 2019–2022.
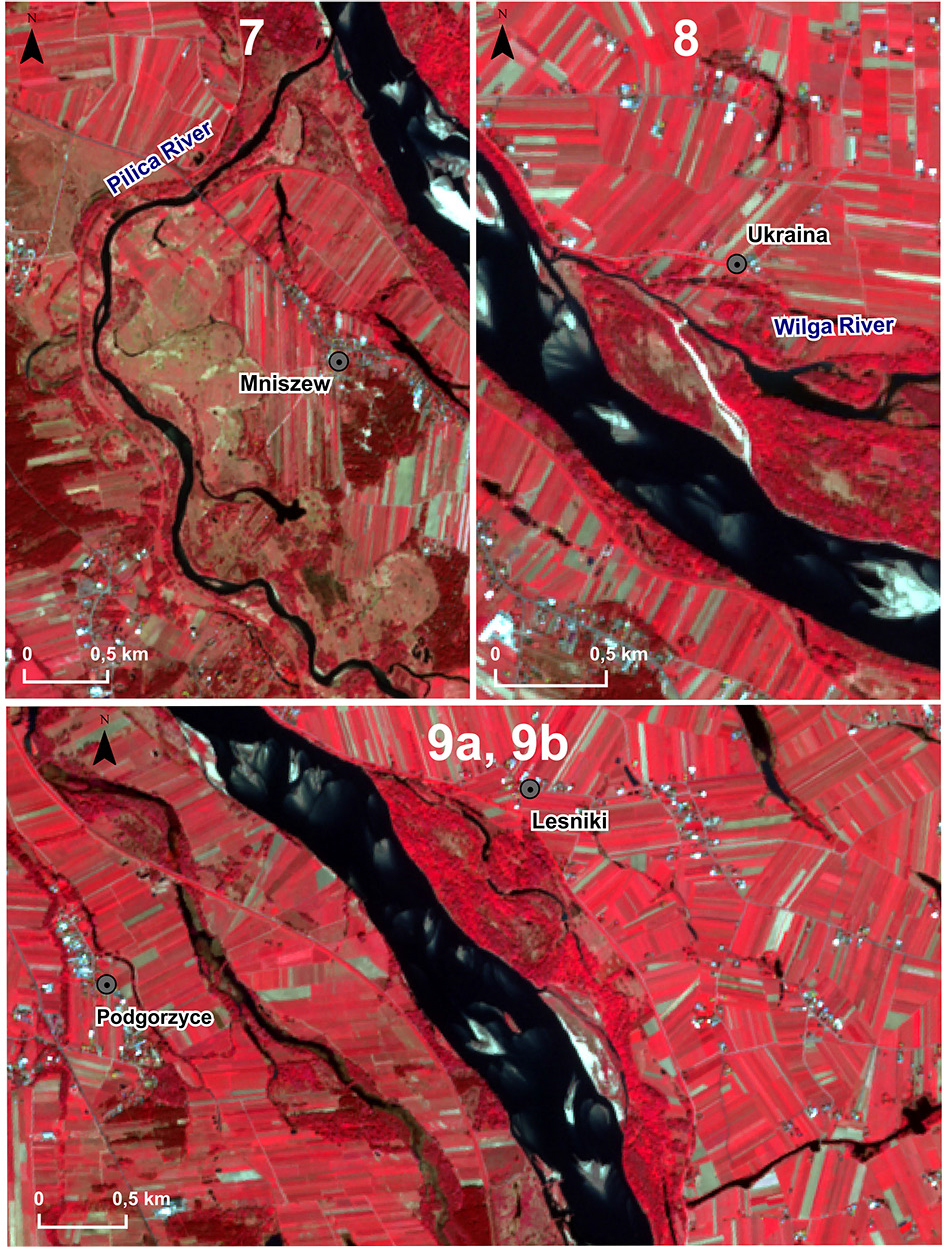
Fig. 15
Selected test areas within Research Area 2 in the CIR composition in the year 2022.
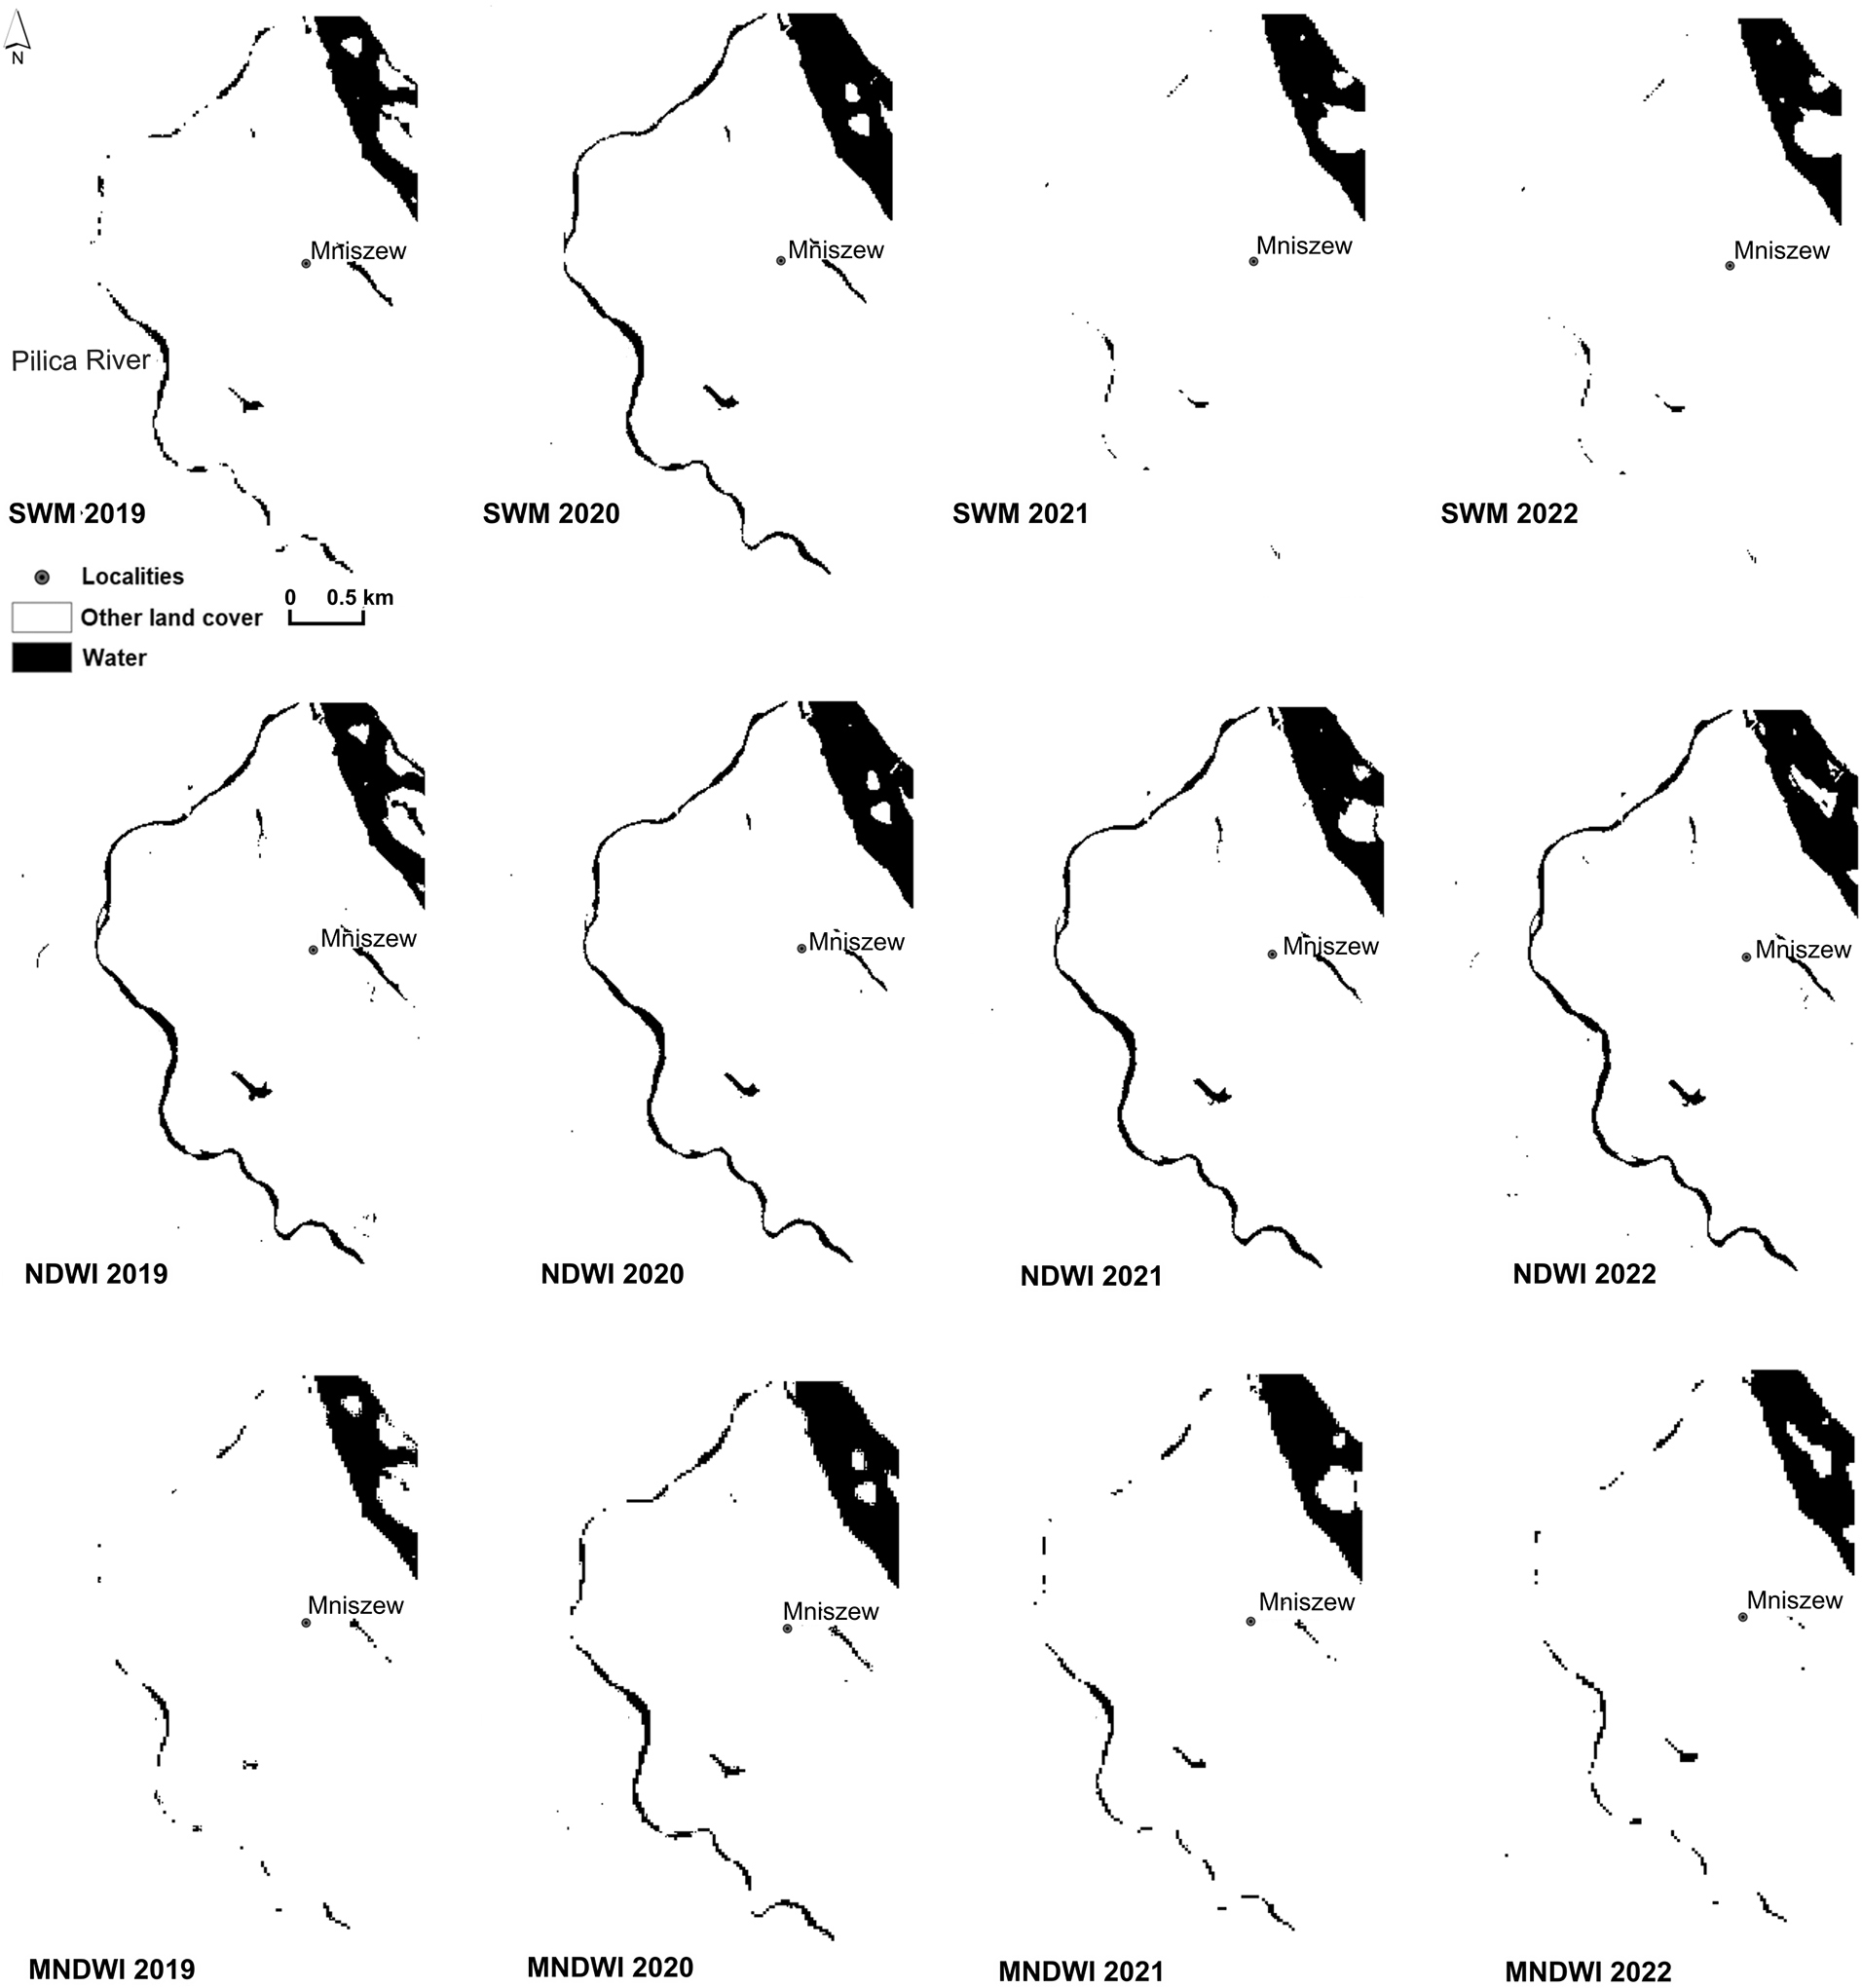
Fig. 16.
Thresholded water indices for test area 7 (Pilica River) in the years 2019–2022.
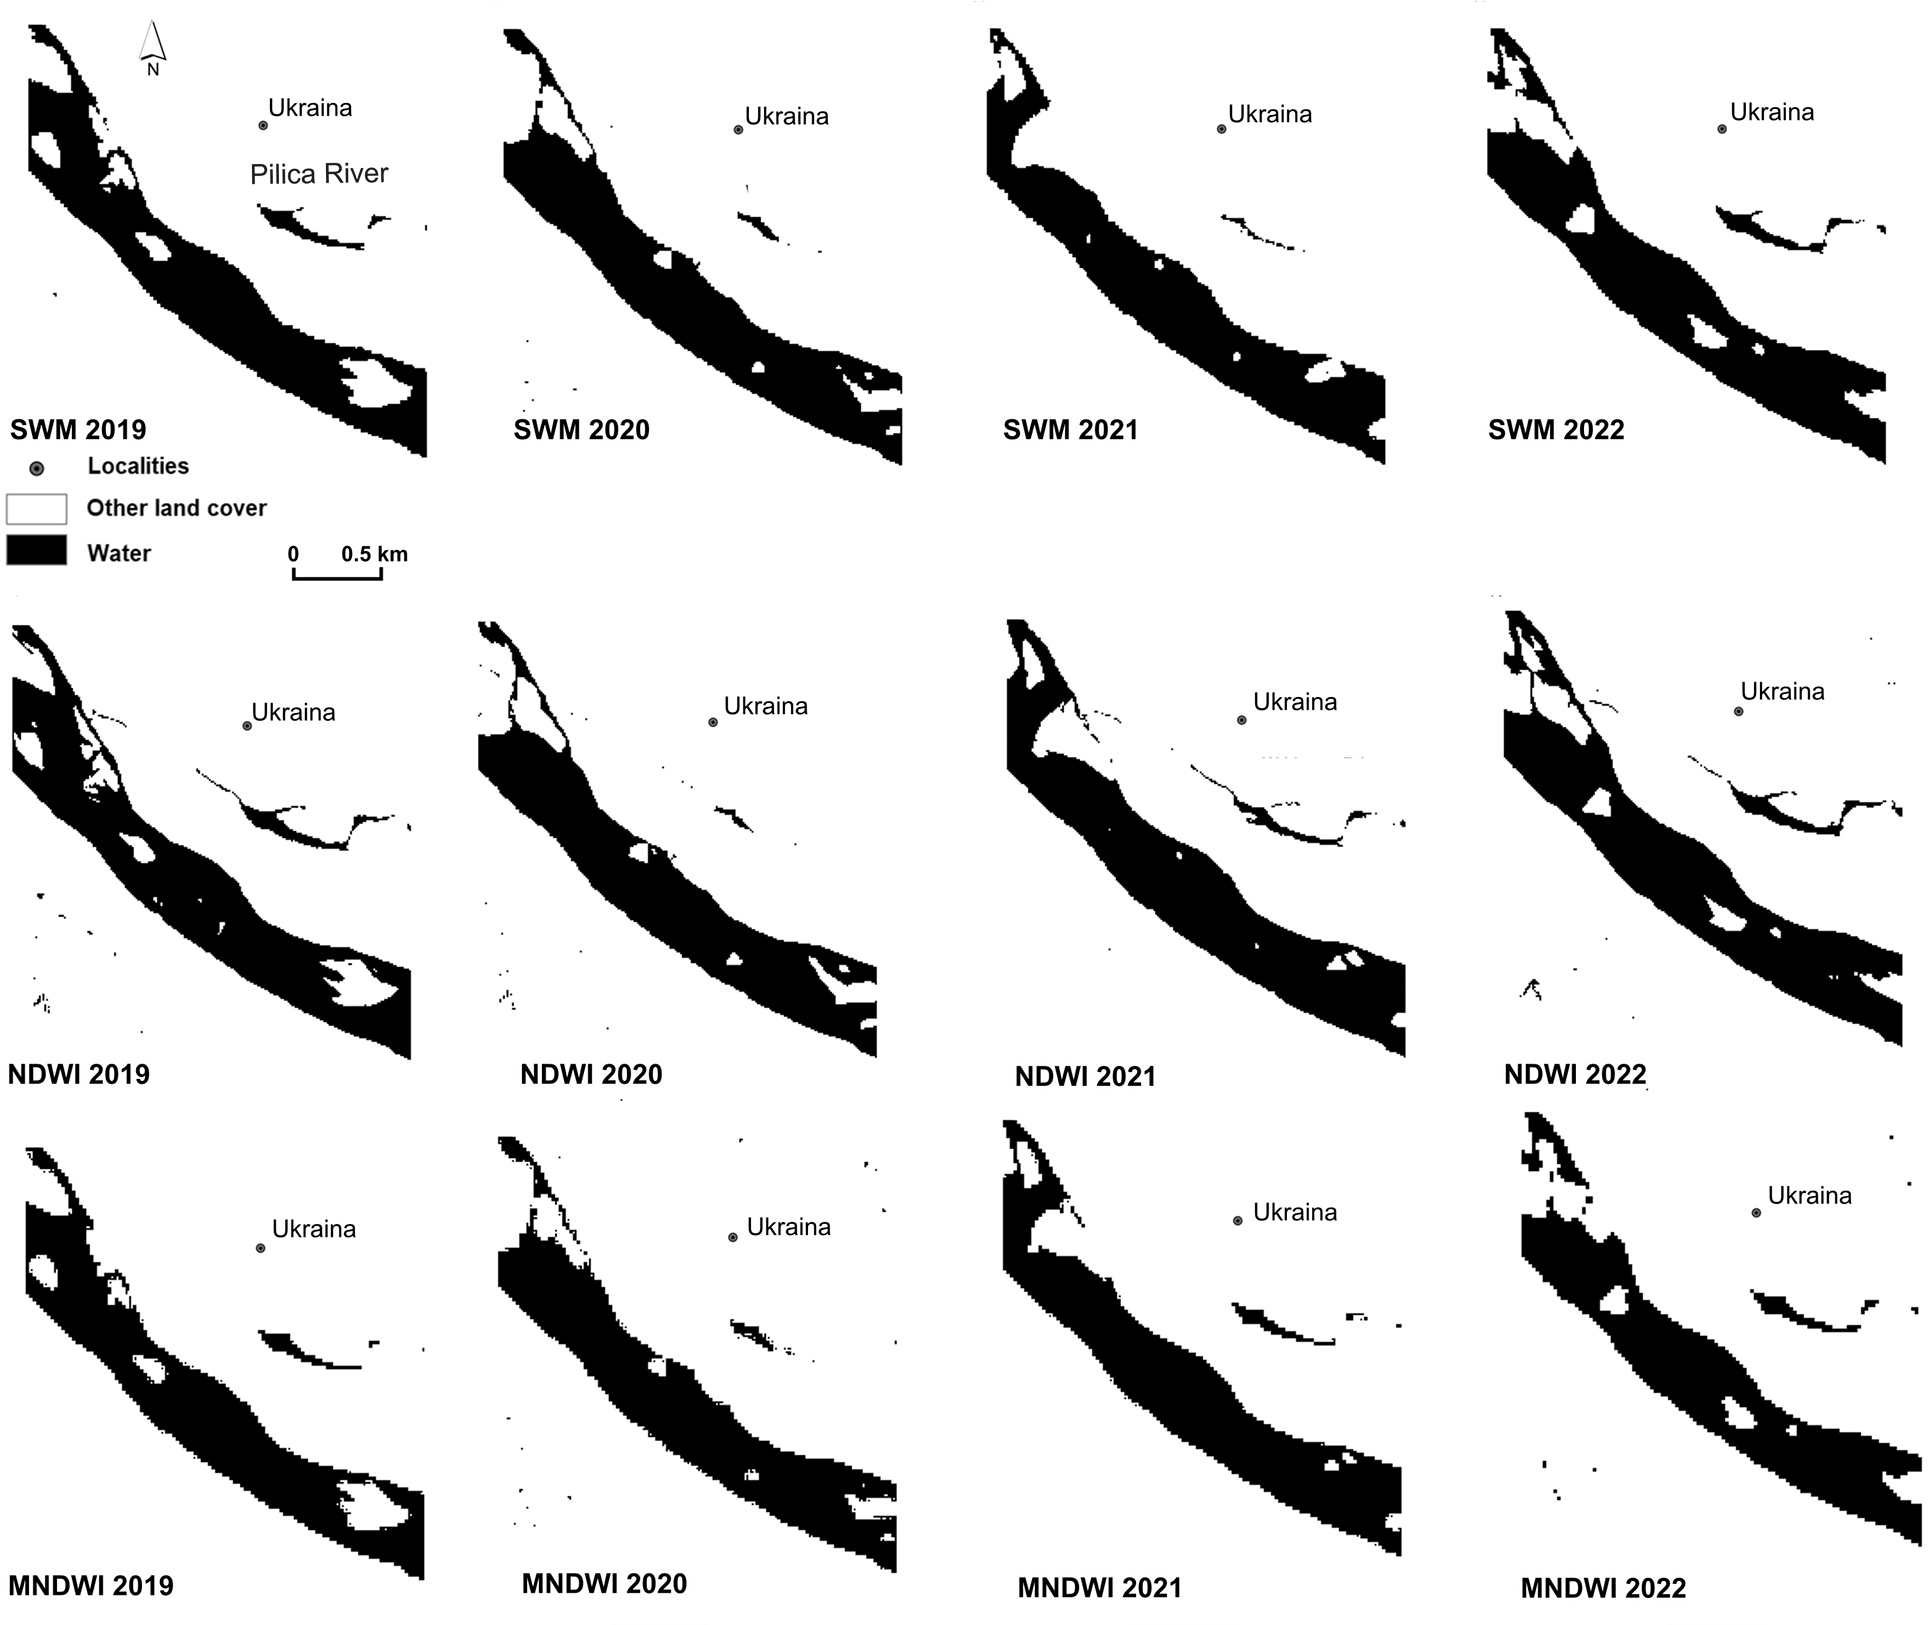
Fig. 17.
Thresholded water indices for test area 8 (Wilga River) in the years 2019–2022.
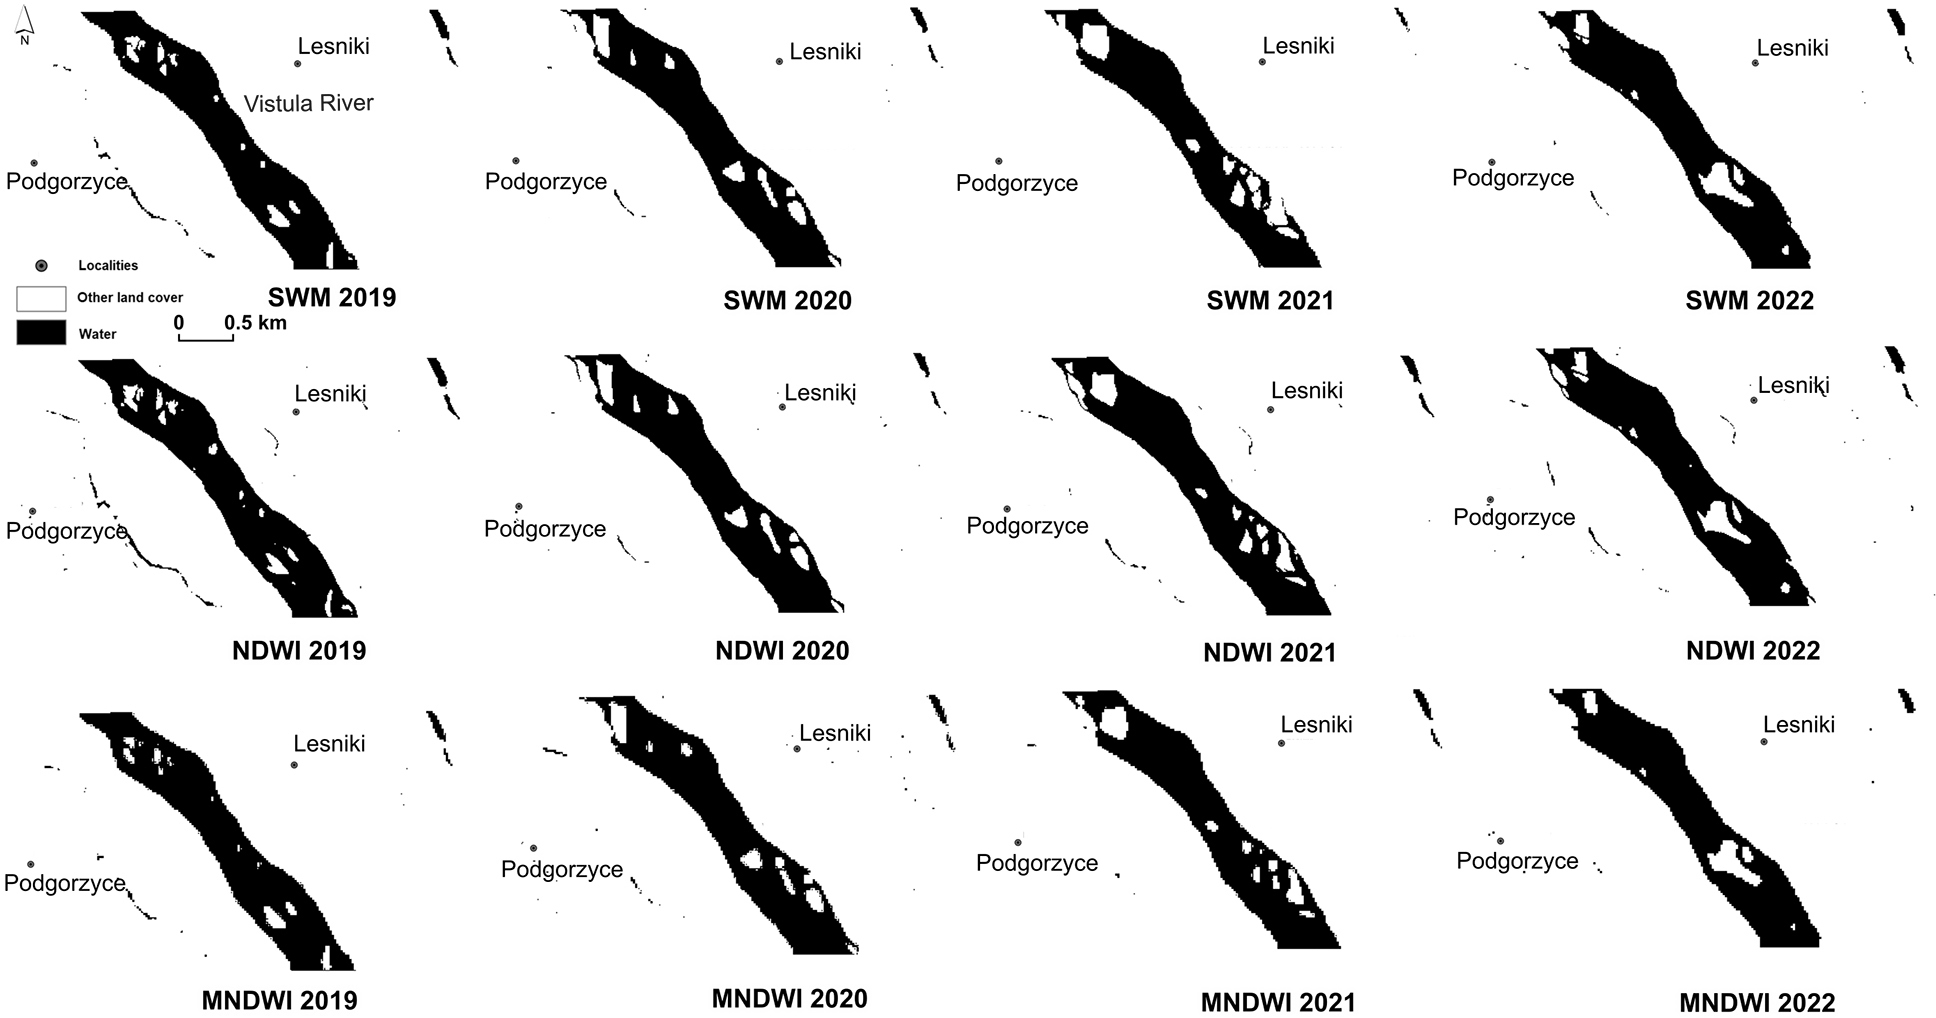
Fig. 18.
Thresholded water indices for test areas 9a and 9b (an example of water bodies in Research Area 2) in the years 2019–2022.
Table 4.
Statistical results of the validation procedure showing the accuracy of the analysed water indices.
| overall Accuracy | User Accuracy | Producent Accuracy | Kappa Coefficient | ||
|---|---|---|---|---|---|
| Area 1 | NDWI | 92.00 | 99.00 | 71.74 | 0.78 |
| MNDIW | 89.20 | 100.00 | 60.87 | 0.69 | |
| SWM | 89.60 | 100.00 | 62.32 | 0.71 | |
| Area 2 | NDWI | 92.20 | 100.00 | 77.19 | 0.82 |
| MNDIW | 84.60 | 98.96 | 55.56 | 0.62 | |
| SWM | 88.40 | 99.13 | 66.67 | 0.72 |
Table 5.
Evaluation of water indices in selected test areas (Research Area 1).
| Test area | Index | 2019 | 2020 | 2021 | 2022 |
|---|---|---|---|---|---|
| 1 | SWM | 2 | 2 | 2 | 1 |
| NDWI | 3 | 3 | 3 | 1 | |
| MNDWI | 2 | 1 | 1 | 1 | |
| 2 | SWM | 1 | 3 | 3 | 3 |
| NDWI | 2 | 3 | 3 | 3 | |
| MNDWI | 1 | 2 | 2 | 3 | |
| 3a, 3b | SWM | 3 | 2 | 3 | 2 |
| NDWI | 3 | 2 | 3 | 2 | |
| MNDWI | 3 | 3 | 2 | 3 | |
| 4 | SWM | 1 | 1 | 1 | 1 |
| NDWI | 1 | 1 | 1 | 1 | |
| MNDWI | 1 | 1 | 1 | 1 | |
| 5 | SWM | 1 | 1 | 1 | 1 |
| NDWI | 1 | 1 | 1 | 1 | |
| MNDWI | 1 | 1 | 1 | 1 | |
| 6 | SWM | 1 | 1 | 1 | 1 |
| NDWI | 1 | 1 | 1 | 1 | |
| MNDWI | 1 | 1 | 1 | 1 |
Table 6.
Evaluation of water indices in selected test areas (Research Area 2).
| Test area | Index | 2019 | 2020 | 2021 | 2022 |
|---|---|---|---|---|---|
| 7 | SWM | 2 | 3 | 1 | 1 |
| NDWI | 3 | 3 | 3 | 3 | |
| MNDWI | 1 | 2 | 2 | 2 | |
| 8 | SWM | 2 | 1 | 1 | 2 |
| NDWI | 2 | 1 | 2 | 2 | |
| MNDWI | 2 | 1 | 2 | 2 | |
| 9a, 9b | SWM | 3 | 1 | 1 | 2 |
| NDWI | 3 | 2 | 2 | 2 | |
| MNDWI | 2 | 2 | 2 | 1 |
Table 7.
Summary of evaluations of the applied indices based on selected examples.
| Frequency of rating 3 | Frequency of rating 2 | Frequency of rating 1 | Effectiveness | |
|---|---|---|---|---|
| SWM | 7 | 9 | 20 | 32% |
| NDWI | 13 | 9 | 14 | 49% |
| MNDWI | 4 | 13 | 27 | 40% |
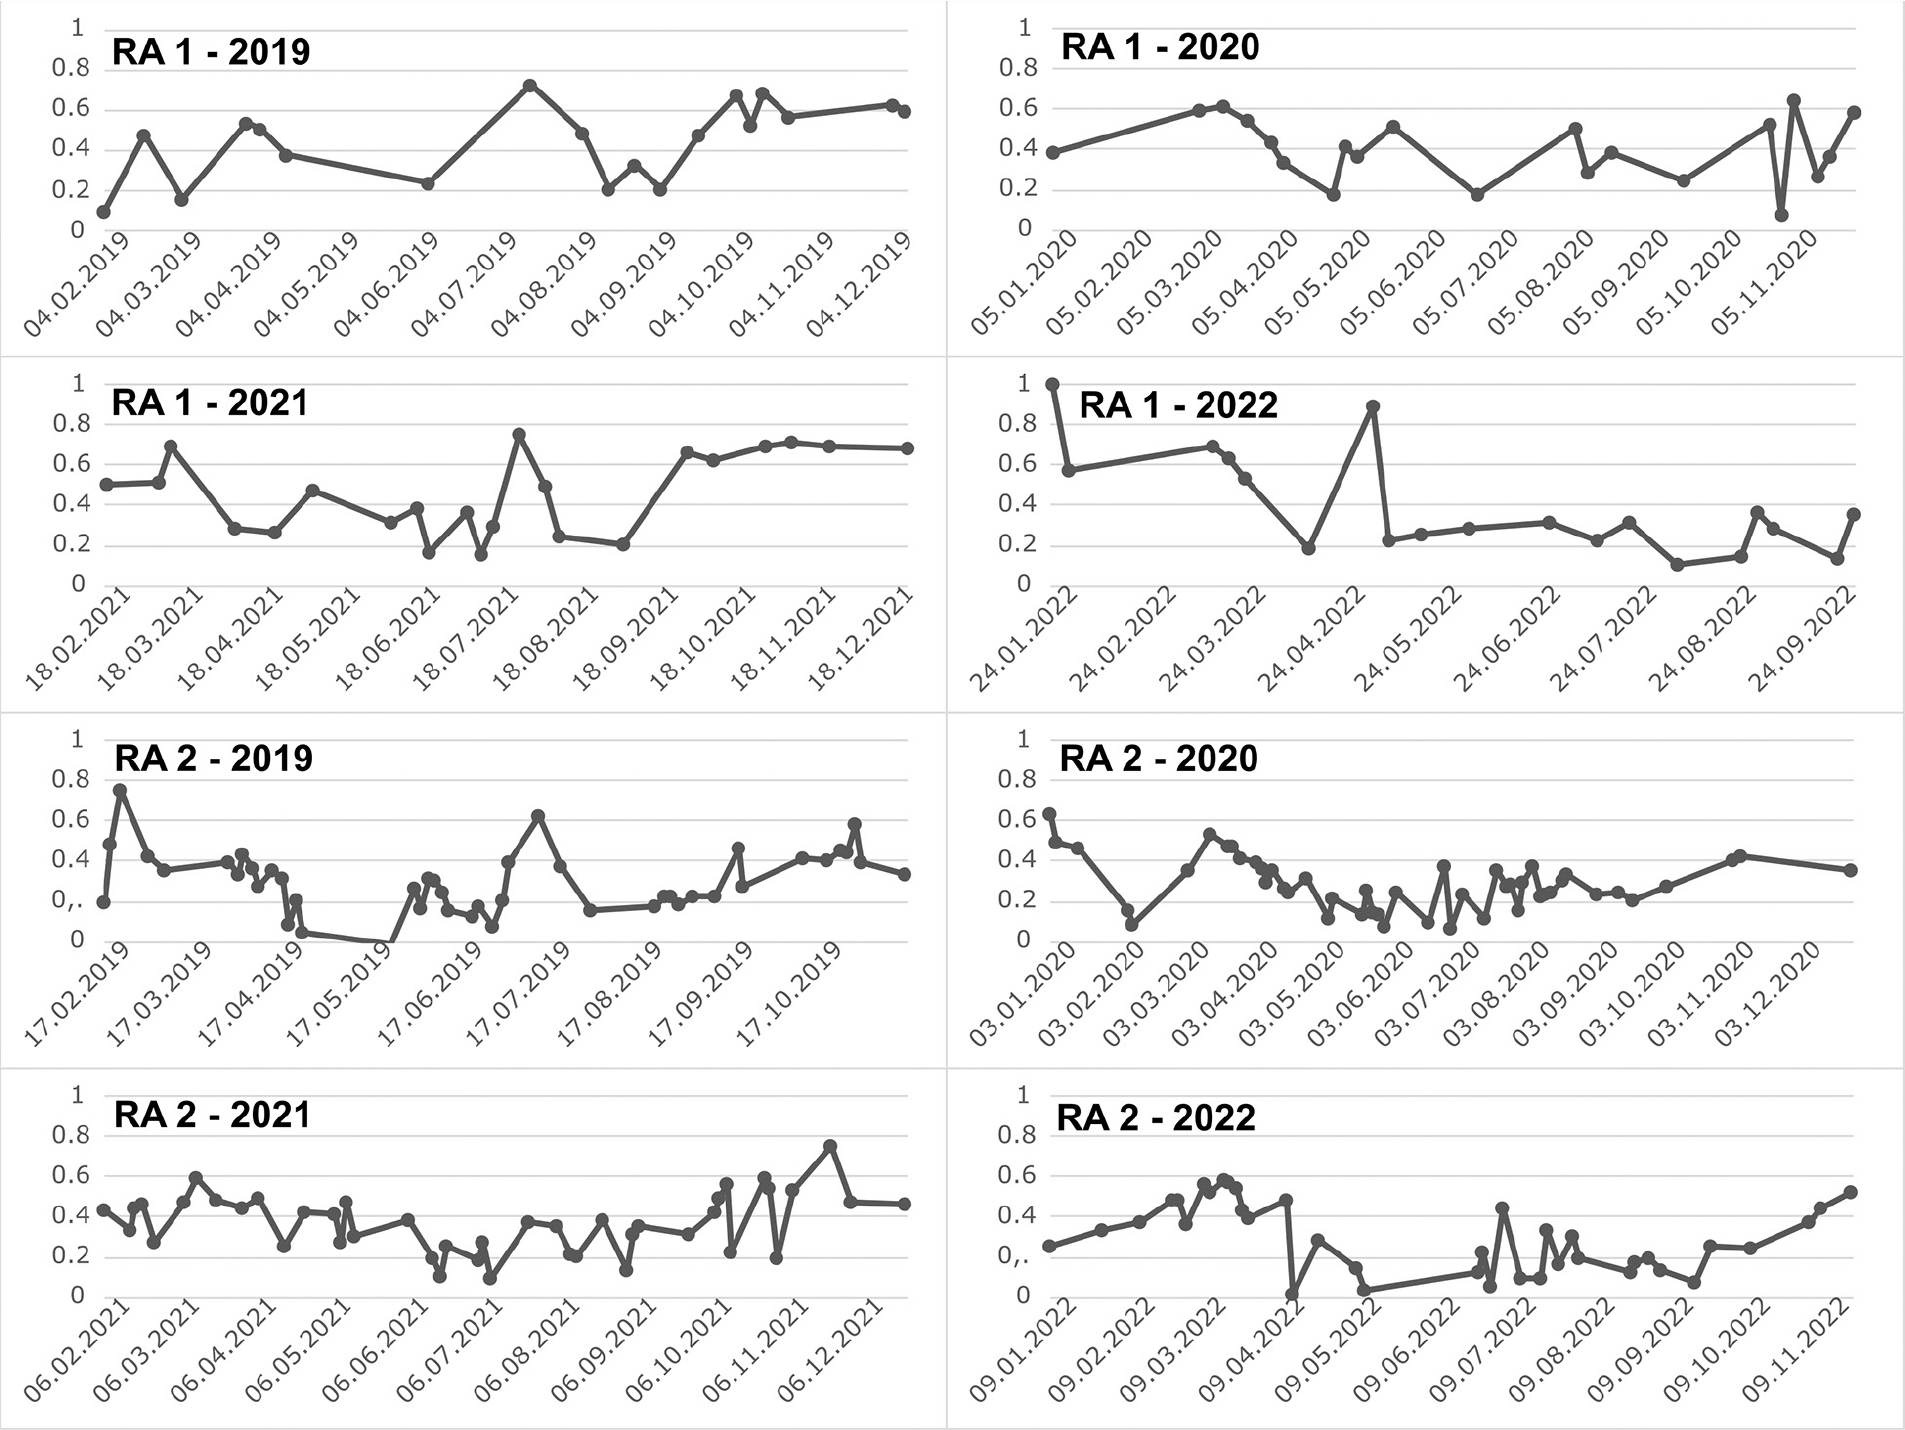
Fig. 19.
Annual NDWI values for Research Area 1 and Research Area 2 within water bodies located in the Vistula River channel for the years 2019–2022. The plots are based on Sentinel-2 scenes with cloud cover below 20% (data source: Copernicus Browser: browser.dataspace.copernicus.eu/). NDWI, normalized difference water index.