
Introduction
Although mountains cover a relatively small proportion of the Earth’s terrestrial surface, they are of great importance in terms of water resources, biodiversity, nutrient cycling and cultural values. Furthermore, they are characterised by a higher proportion of biodiversity than other areas (Körner et al. 2011). Mountain ecosystems are complex, dynamic, and exceptionally fragile, and are subject to global and local changes caused by human activity (Deléglise et al. 2019, Schmeller et al. 2022). Even in remote areas, human impacts can be significant, and these impacts, along with the resulting threats, remain largely understudied (Schmeller et al. 2018).
Mountain ecosystems are shaped by historical and contemporary land use practices (Körner et al. 1997, Lavorel et al. 2017), with the extent of influence depending mainly on the area’s accessibility (Tasser, Tappeiner 2002, Jabs, Affek 2019, Rahmonov et al. 2024). Most of these changes are driven by pastoral activities, such as livestock grazing, which is the primary agricultural activity in most mountainous regions. Due to harsh natural conditions, other forms of human activity are often unsuitable. The diversity of natural and non-natural factors in different regions determines the development of various animal husbandry systems (Sobala 2014, Enchinov, Torushev 2022). As a result, the impact of livestock grazing on the environment varies across different mountain ranges.
In developed countries, pastoral activities in mountain regions have diminished due to socioeconomic factors and are now largely supported by subsidy policies (Mayer et al. 2022, Bucała-Hrabia 2024). By contrast, livestock grazing remains vital to the economies of developing countries, where it continues to shape forest ecosystems, soil health and the hydrologic cycle (Rahmonov et al. 2017a, Prokop et al. 2020).
Summer mountain pastures are intricate ecosystems where ecological processes and human activities are deeply interconnected. They provide essential fodder for domestic livestock during the summer and, through their traditional use, help sustain biodiversity, ecosystem services and open landscapes. Primarily used by local inhabitants, they also see some tourist activity. These pastures support local livelihoods as key areas for mowing and livestock grazing (Montenegro-Díaz et al. 2022).
In the high alpine grasslands of the Zarafshan mountains, pastoralism involves free grazing followed by a daily rest period of about 10 h. During this rest period, the animals gather in non-windy, flat slopes and low-lying areas, mainly near rivers and spring zones. These areas, known as summer qutans (summer camps), are used for grazing during this spring–summer period. They differ from the surrounding areas, creating a distinct spatial pattern marked by animal excrement. This leads to richer organic matter, which returns to the ecosystem in the form of manure and urine from the animals’ consumption. By influencing grazing patterns and excreta deposition, the terrain’s aspect affects soil nutrient concentration (Lambert, Roberts 1976).
The habitat conditions and soil characteristics of these areas remain underexplored and have received little attention in the literature. Some studies have partially addressed these factors in pastures in New Zealand (Sheath, Boom 1985, Haynes, Williams 1993), North America (Franzluebbers et al. 2000, Gill 2007), the Pyrenees (Aldezábal et al. 1999, Badía et al. 2008) and the Alps (Güsewell et al. 2005, Ferré et al. 2020). Nonetheless, the role of grazing animals in nutrient distribution within these ecosystems remains crucial. Grazing animals utilise only a small portion of the nutrients they consume, with 60–95% of the nutrients returning to the pasture as dung and urine, thereby influencing soil nutrient dynamics (Haynes, Williams 1999).
At the animals’ resting sites, known as animal camps, dung accumulates to such an extent that vegetation is often absent. The soil in these areas becomes compacted and resistant to erosion. In the pasture, the recycling of nutrients from excreta back into the soil and plants affects the physical, chemical and biological properties of the soil (Iyyemperuma et al. 2007, Niu et al. 2009, Rahmonov et al. 2017a), as well as the vegetation composition. The impact of dung patches and urine on the chemical composition of the pasture and their influence on the soil under grazing conditions was analysed by Rodríguez et al. (1997, 2005). Their studies show that there was a significant effect of the dung patches and the micturitions on the pasture yield, both in the excretions deposited artificially and in those deposited directly by the cows in the grazing area. The highest values were produced with the micturitions, although in most of the cases the dung patches also caused significant increases. In turn, the effects of grazing itself were explored by Pineiro et al. (2010). Their studies show that identifying the pathway by which grazing may alter soil organic matter stocks in different regions is a key step for designing locally adapted management practices to increase soil organic matter storage.
The location of active cattle camps constantly shifts, while abandoned camps become overgrown with shrubs, leading to the formation of shrub thickets (Camacho et al. 2008, Rahmonov et al. 2017b, Losapio et al. 2024). Overgrazing combined with climate change – particularly extreme weather events (Deléglise et al. 2019, Dong et al. 2020) – and unsustainable land management practices (Torresani et al. 2019) has led to changes in soil properties, including chemical and microbiological conditions (Maryskevych, Shpakivska 2008, 2011), vegetation structure and floral composition (Lyach, Milkina 2008, Jones et al. 2010). These changes result not only from the direct mechanical impact of cattle but also from natural fertilisation processes (Haynes, Williams 1999, Lyach, Milkina 2008). Nutrient and organic matter distribution and cycling in pasturelands are spatially heterogeneous, largely shaped by variations in the morphological conditions of the site (Haynes, Williams 1999, McIntire, Hik 2002). In mountain pastures, cattle typically seek out particular landscape features for resting and ruminating, such as areas beneath trees, shrubs, rocks, depressions and along watercourses (Rowarth et al. 1992, Haynes, Williams 1999).
While studies examining the influence of land use and natural processes on the functioning, physicochemical properties and structure of soil cover in the Central Asian Mountains are not uncommon (Abbasi et al. 2007, Wali et al. 2021, Zhao et al. 2013, Saeed et al. 2014, Rahmonov et al. 2017a), there is a notable lack of direct studies of soil chemistry in animal camping areas. As pastoral landscapes are predominantly preserved in Central Asia, this region offers an excellent opportunity to assess the impact of human activities on the environment. The study aims to assess the impact of grazing carried out in summer camps on the chemical properties of soils in mountain ecosystems of the Fann Mountains, Tajikistan. It was hypothesised that the chemical properties of the soils would vary both between different grazing areas (due to differences in grazing intensity) and within each grazing area (due to the migration of chemical components influenced by topographical variations). The main objective consists of specific goals: (1) to determine the differences in soil chemical properties between different camps due to varying grazing intensity and land use practices and (2) to identify the variability of chemical properties within the camps themselves, depending on topography.
Study area
The study area is located in the Fann Mountains (39°10'N, 68°15'E), which form the highest part of the Zarafshan Range in north-western Tajikistan (Figs 1 and 2). This range is part of the western part of Pamir-Alay (Rahmonov et al. 2013). The average altitude is approximately 4100 m a.s.l., with the highest peak being Chimtarga Peak at 5489 m a.s.l. The Fann Mountains feature typical high-altitude terrain, including U-shaped valleys, glacial cirques, steep slopes and numerous landslide cones (Rahmonov et al. 2013). The highest regions are covered by glaciers, while the valleys are home to glacial rivers with notable lakes such as Kuli Kalon, Alouddin, Dushakha and Iskandarkul, which possess significant geotourism potential (Pukowiec-Kurda et al. 2021). This mountain range is predominantly composed of rocks from the Palaeozoic (Carboniferous, Devonian, Silurian) and Mesozoic (mainly Cretaceous) eras, with younger Quaternary deposits filling the valley floors. The rocks include sandstones, quartzites, gneisses, limestones, marls, dolomites, as well as clays and loess. Detailed studies were conducted in the Urej River catchment (Fig. 1), where seven grazing areas (known as qutans) were selected for investigation: four located in the Kulikalon Basin and three near Artuch village. These areas are used for sheep grazing in the summer season (approximately 2 months) and vary in surface area, slope and distance from water sources (Table 1). Livestock grazing in the Fann Mountains occurs exclusively in summer, after which the herd gradually moves to the winter camps in the southern part of Tajikistan, near the Afghan border.
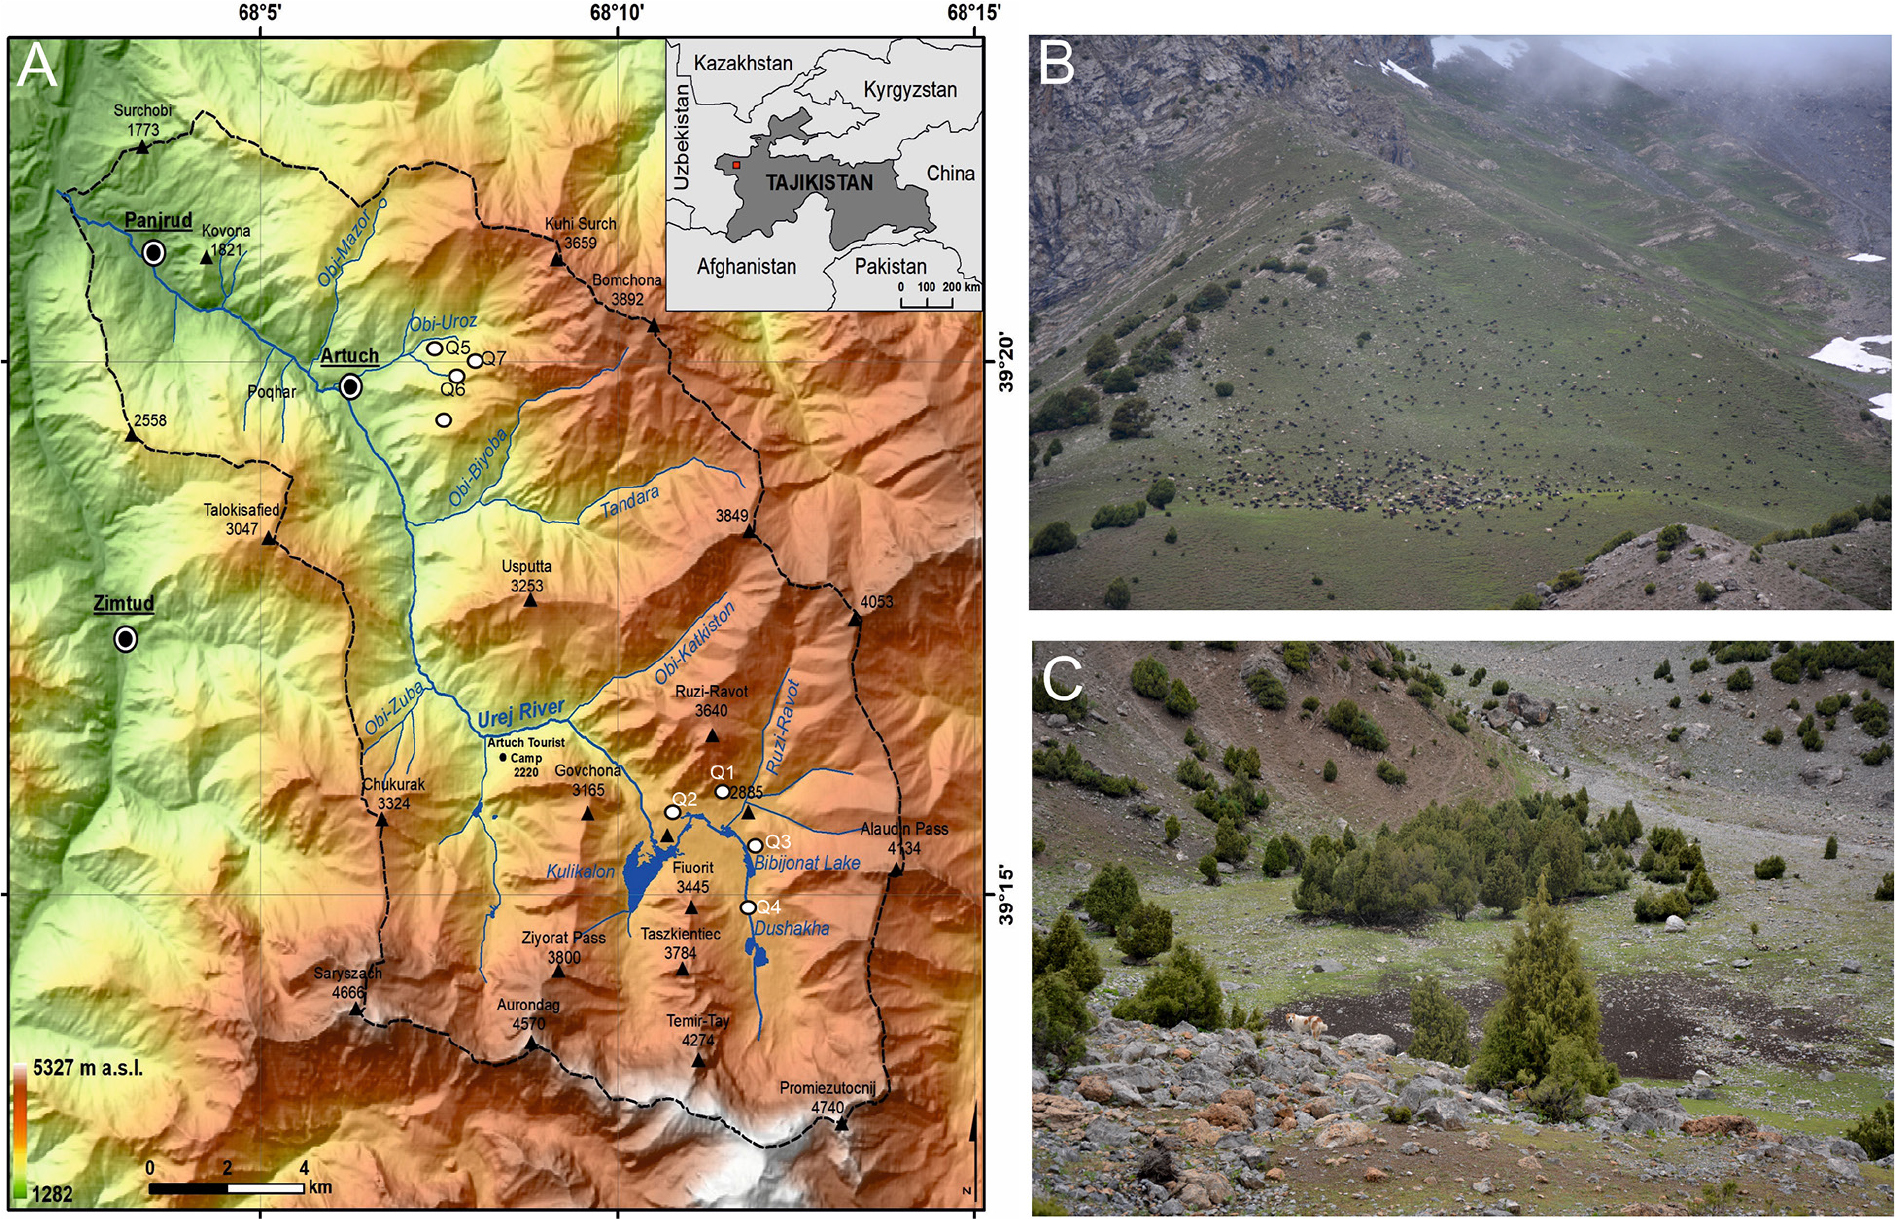
Fig. 1.
A – Study area Q1–Q7 summer livestock camp; B – an example of animal grazing on alpine meadows; C – Qutan in the Fann Mountains – a location in a terrain depression along a watercourse.
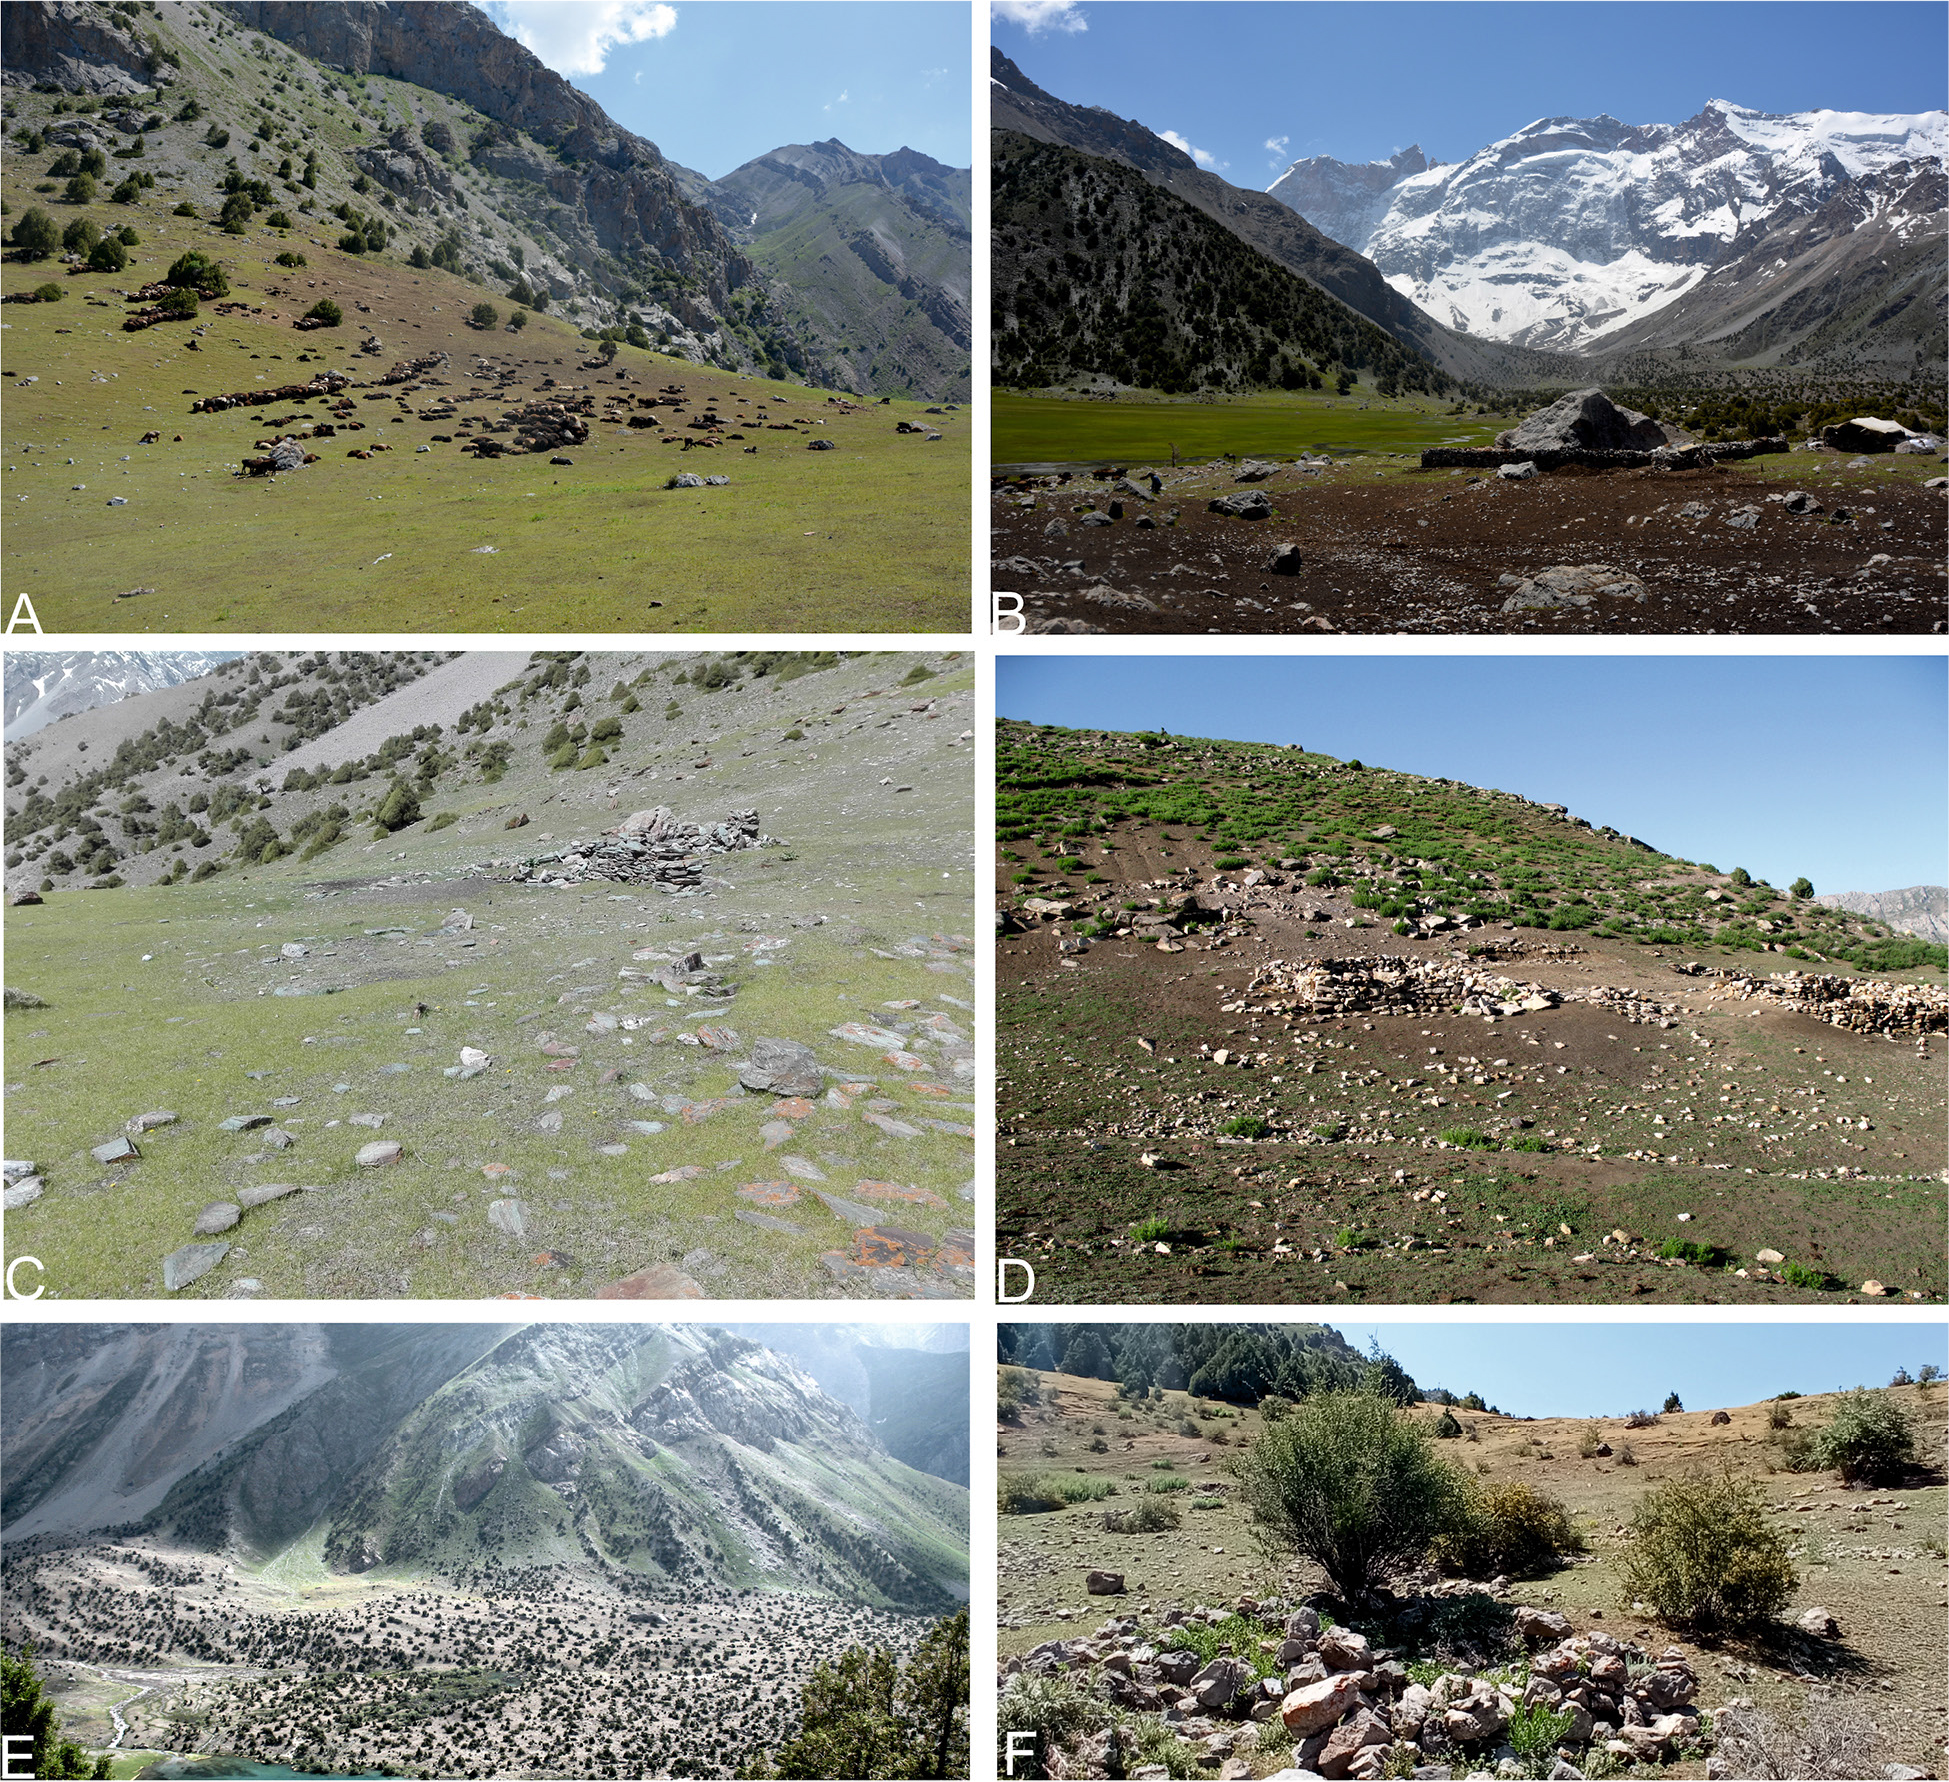
Fig. 2.
Photographs illustrating the study area – qutans in the Fann Mountains: A – Sheep grazing within the qutan Ovulgi Jalol (Q7-OJ) on a slope flattening in the Fann Mountains; B – A fragment of the qutan Murodali Sherali (Q2-MSh) in the headwater zone; C – Ovulgi Alisho sheep qutan (Q1-OA); D – Traces of summer livestock and the breeding of goats and cows during the summer period in Tushqoq (Q6-T); E – Dushacha camp near a water zone (Q4-D); F – Suchti Chuqurak unused cattle camp (Q5-SCh).
Table 1.
Basic characteristics of summer cattle camps.
| Summer cattle camp | Land use | Coordinates | Altitude | Slope | Length of transect | Vegetation |
|---|---|---|---|---|---|---|
| [m a.s.l.] | [°] | [m] | ||||
| Q1-OA | Used | 39°16'22"N 68°12'03"E | 2935 | 9–17 | 35 | Galium aparine, Rumex Paulsenianus, Malva neglecta, Artemisia dracunculus, Convolvulus arvensis, R. Ecae, Berberis oblonga |
| Q2-MSh | Used | 39°16'14"N 68°11'59"E | 2888 | 12–25 | 33 | |
| Q3-B | Used | 39°15'51"N 68°11'42"E | 2913 | 16–19 | 40 | |
| Q4-D | Used | 39°15'02"N 6β°11'50"E | 2954 | 9–12 | 75 | |
| Q5-SCh | Unused since 1989 | 39°20'09"N 68°07'43"E | 2286 | 3–6 | 50 | Artemisia dracunculus, Convolvulus arvensis, Gentiana olivieri, Cichorium intybus, Salvia drobovii, Carex pachystilis, Arum Korolkovii, Plantago lanceolata, P. major, Iris songorica, Eremurusolgae, Ligularia thomsonii, Onosmadi chroanta, Centaurea squarrosa and bushes as Rosa Fedtschenkoana, R. huntica, R. Ecae, Berberis oblonga and Cerasus verrucosa |
| Q6-T | Unused since 2015 | 39°19'38"N 68°08'02"E | 2698 | 8–21 | 35 | |
| Q7-OJ | Used | 39°19'40"N 68°08'32"E | 2851 | 4–19 | 85 | Galium aparine, Rumex Paulsenianus, Malva neglecta, Artemisia dracunculus, Convolvulus arvensis, R. Ecae, Berberis oblonga |
The diverse mosaic of habitats and topoclimatic conditions in the region supports a variety of plant formations that are vital to mountain ecosystems (Rahmonov et al. 2013) and provide valuable grazing areas for livestock. In Tajikistan, all mountain land is designated as grazing land by law (Law of the Republic of Tajikistan on Pasture 2013), encompassing vegetation types such as high mountain deserts, high mountain meadows and steppes; mid-mountain conifer and mesophytic forests; mid-mountain xerophytic light forests; mid-low-mountain semi-savannas; and wetlands. It is essential to highlight that Qutany and its surrounding areas are crucial habitats for Biebersteinia multifida, a medicinal plant utilised by local people for medicinal purposes. Used in folk medicine, this plant is believed to alleviate joint pain, reduce inflammation and soothe skin irritations. Biebersteinia multifida has medical significance and is traditionally used in Middle Eastern herbal medicine, with reported anti-inflammatory, analgesic and antioxidant effects, as well as anxiolytic (anti-anxiety) activity in animal studies (Zhang et al. 2020, Bustonovna 2025).
The valleys are dominated by grasslands and juniper forests, featuring Juniperus seravschanica and Juniperus semiglobosa (Rahmonov et al. 2017a). J. semoglobosa is found at higher elevations (2700–3200 m a.s.l.), forming juniper woodlands with varying density. J. seravschanica occurs at lower altitudes (1500–2400 m a.s.l.) (Rahmonov et al. 2024).
The climate and vegetation exhibit a distinct altitudinal zonation typical of this area. In the valley bottoms and lower slopes (1700–2000 m a.s.l.), July is the warmest month, with an average temperature of approximately 19°C, while January is the coldest month, with an average of about 4°C (Rahmonov et al. 2017a). At higher elevations (3000–3400 m a.s.l.), the average temperature in July drops to 10°C, and in January it falls to -10°C. Above the snow line (about 4000 m a.s.l.), the average annual temperatures are about -5°C, while at Chimtarga it can be as low as -15°C (Rahmonov et al. 2013). Mean yearly precipitation for the study area is 400–500 mm on peaks and slopes at altitudes of about 3000–3400 m a.s.l. (418 mm at Anzob Pass, 3373 m a.s.l.). In basins and deep valleys (altitudes in the range of 2200–2500 m a.s.l.), precipitation drops to 250–300 mm (271 mm in Iskanderkul, 2204 m a.s.l.). Most precipitation occurs in the spring season (60–70 mm in April or May), while winter is characterised by low rates of snowfall (Rahmonov et al. 2017a).
Materials and methods
Soil samples collection
The field study was conducted in the summer of 2019 and involved collecting soil samples for laboratory analysis.
Soil samples were collected from seven summer livestock camping areas across two parts of the Fann Mountains, within the Urej River catchment. These summer camps, known as ovul (or avul in some areas), serve as night-time resting sites for livestock. During the day, they are referred to as qutans (camps) and are typically set up in land hollows to keep animals grouped for protection against predators (Fig. 1C). The term ‘summer livestock camps’ used in this work refers to places where animals are grazed during the summer period. The analysed livestock camps can be categorised into two groups based on their primary purpose. The first group consists of summer camps used for breeding goats and cows during the summer months (Q5-SCh, Q6-T). The second group is dedicated to sheep grazing (Q1-OA, Q2-MSh, Q3-B, Q4-D, Q7-OJ) as part of transhumance – a seasonal movement of livestock between permanent summer and winter pastures.
Four of the summer livestock camp areas were located in the Kulikalon Basin and its immediate surroundings, while three were situated on the mountain slopes above the village of Artuch.
Six soil samples were collected from each campsite along the transect, from identified horizons, giving a total of 42 samples (Fig. 3). Samples were taken from the topsoil at different depths, depending on the degree of profile development or erosion. These included organic (O)/organic-mineral (OA) horizons, humus horizons (A) and cambic horizons (B).
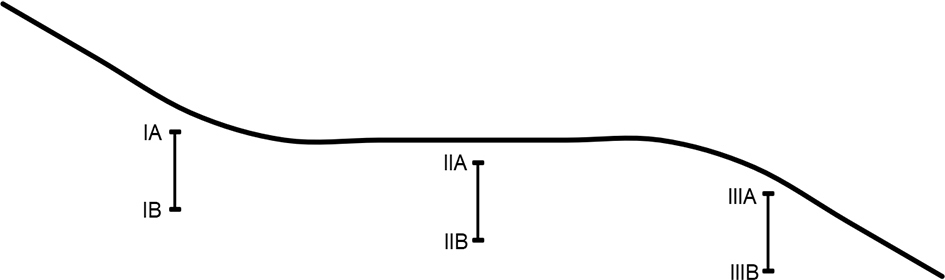
Fig. 3.
Schematic layout of transects and soil sampling sites within the summer livestock camp.
In each case, the transect began at the upper boundary of the qutan, extended through its central part and ended at the lower boundary. Sampling was conducted from two depths in three sections of the qutan (Fig. 3):
– Upper part (IA and IB): Located on the slope between the mountain slope and the plateau. This area has sparse vegetation and shows signs of ongoing erosion;
– Central part (IIA and IIB): A flatter area where water flow slows down, allowing organic matter to accumulate;
– Lower part (IIIA and IIIB): Situated on the slope between the plateau and the lower area. This is the water runoff zone, though runoff is not always clearly visible.
Laboratory analysis
Forty-two soil samples were collected for laboratory analysis. The granulometric composition of the samples was determined using standard grain size analysis, which involved a sieve column with a set of sieves of varying mesh sizes. The following granulometric groups were distinguished: rock fragments (>10.0; 10.0–5.0; and 5.0-2.0 mm), fine earths (2.0–1.0; 1.0–0.5; 0.5–0.25; and 0.25–0.1 mm,) silt (0.1–0.05 mm) and clay (<0.05 mm). The mass of the sample remaining in each sieve was calculated as the percentage of grains of a given size in the total mass of the sample (Bednarek et al. 2004). In this paper, the results of the particle-size composition are presented as the sums of individual fraction groups.
The samples were air-dried, sieved (mesh sizes: 1 mm) and analysed as follows: pH was measured potentiometrically in both H2O and 1N KCl using a glass electrode (soil:water:1/2.5); total organic carbon (TOC) was determined by the Tyurinn method; total nitrogen (TN) content was quantified using the Kjeldahl method; total phosphorus (TP) was measured by Bleck’s method, modified by Gebhardt; available phosphorus (AP) was assessed using Egner–Riehm’s method; and magnesium (AMg) was analysed according to PN-R-04023/23 (Bednarek et al. 2004).
Statistical analysis
To determine which chemical parameters differed between the samples, a difference test was performed. We analysed differences in chemical soil parameters between the upper and lower soil layers and differences in chemical parameters across the six types of soil samples (Fig. 3). Both analyses were conducted for the entire set of samples from all seven qutans. The dependent variables analysed were TOC, TN, TP, AP and AMg. Given the small sample size (n = 42), a non-parametric test was chosen.
To assess the differences in chemical soil parameters between the upper and lower soil layers, the Mann–Whitney test was applied. It is a non-parametric statistical test for determining differences between two groups on a single, ordinal variable with no specific distribution (Mann, Whitney 1947). To examine the differences in chemical parameters across the six types of soil samples, the Kruskal–Wallis test was used. The Kruskal–Wallis test is a non-parametric method for determining whether samples come from the same distribution (Kruskal, Wallis 1952). It is used to compare two or more independent samples, regardless of their sample sizes, and extends the Mann–Whitney test, which is used to compare only two groups.
It must be emphasised that each soil sample was treated as an independent observation; therefore, the results reflect differences between the individual samples rather than the entire qutans or qutan parts, and potential dependencies among samples from the same qutan were not accounted for. All analyses were performed using IBM SPSS Statistics version 31.0.0 (IBM Corp., Armonk, NY, USA), with a significance level of α = 0.05. No correction for multiple comparisons was applied. To present the variation in soil chemistry across the transect segments and between the qutans, boxplots were used.
Results
Physical properties of soil
The analysed soil samples were taken from the topsoil, including the O, OA, A and enrichment (B) horizons. The general soil profile in the qutan areas is as follows: O-A-AC, OA-A-B and OB-B-C. The organic and organic-humus horizons are primarily composed of materials from animal excrement, mixed with mineral particles transported from higher areas due to erosion or surface runoff.
In terms of granulometric composition, fine earth fractions (73.9–91.9%; 2.0–0.1 mm), along with silt (3.4–14.1%, 0.1–0.05 mm) and clay (2-11.4%. <0.05), dominate all sites, except at the Q1-OA site, where rock fragments (>10–2 mm) are the dominant fraction, comprising 39.8% of the material (Fig. 4).
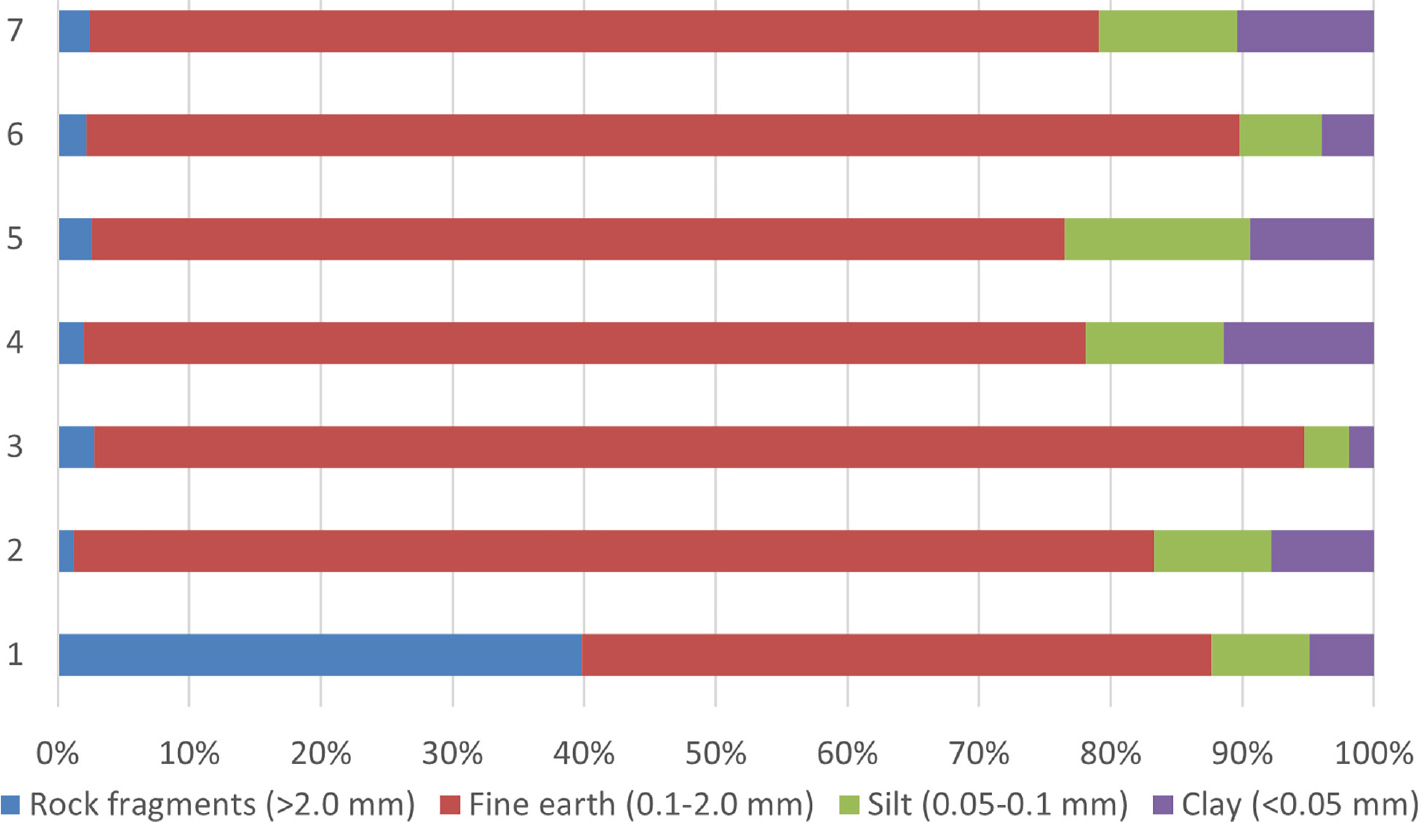
Fig. 4.
Granulometric composition of mineral horizons (Arabic numbers correspond to qutan numbers in Table 1).
The pH values of the soil samples are generally close to neutral, with several samples even being alkaline (Figs 5 and 6). This is primarily attributable to the geological substrate as well as the influence of grazing and animal excrement. The average pH values for the 42 samples were 7.14 in water and 6.83 in KCl, with ranges of 6.40–7.70 and 5.86–7.61, respectively.
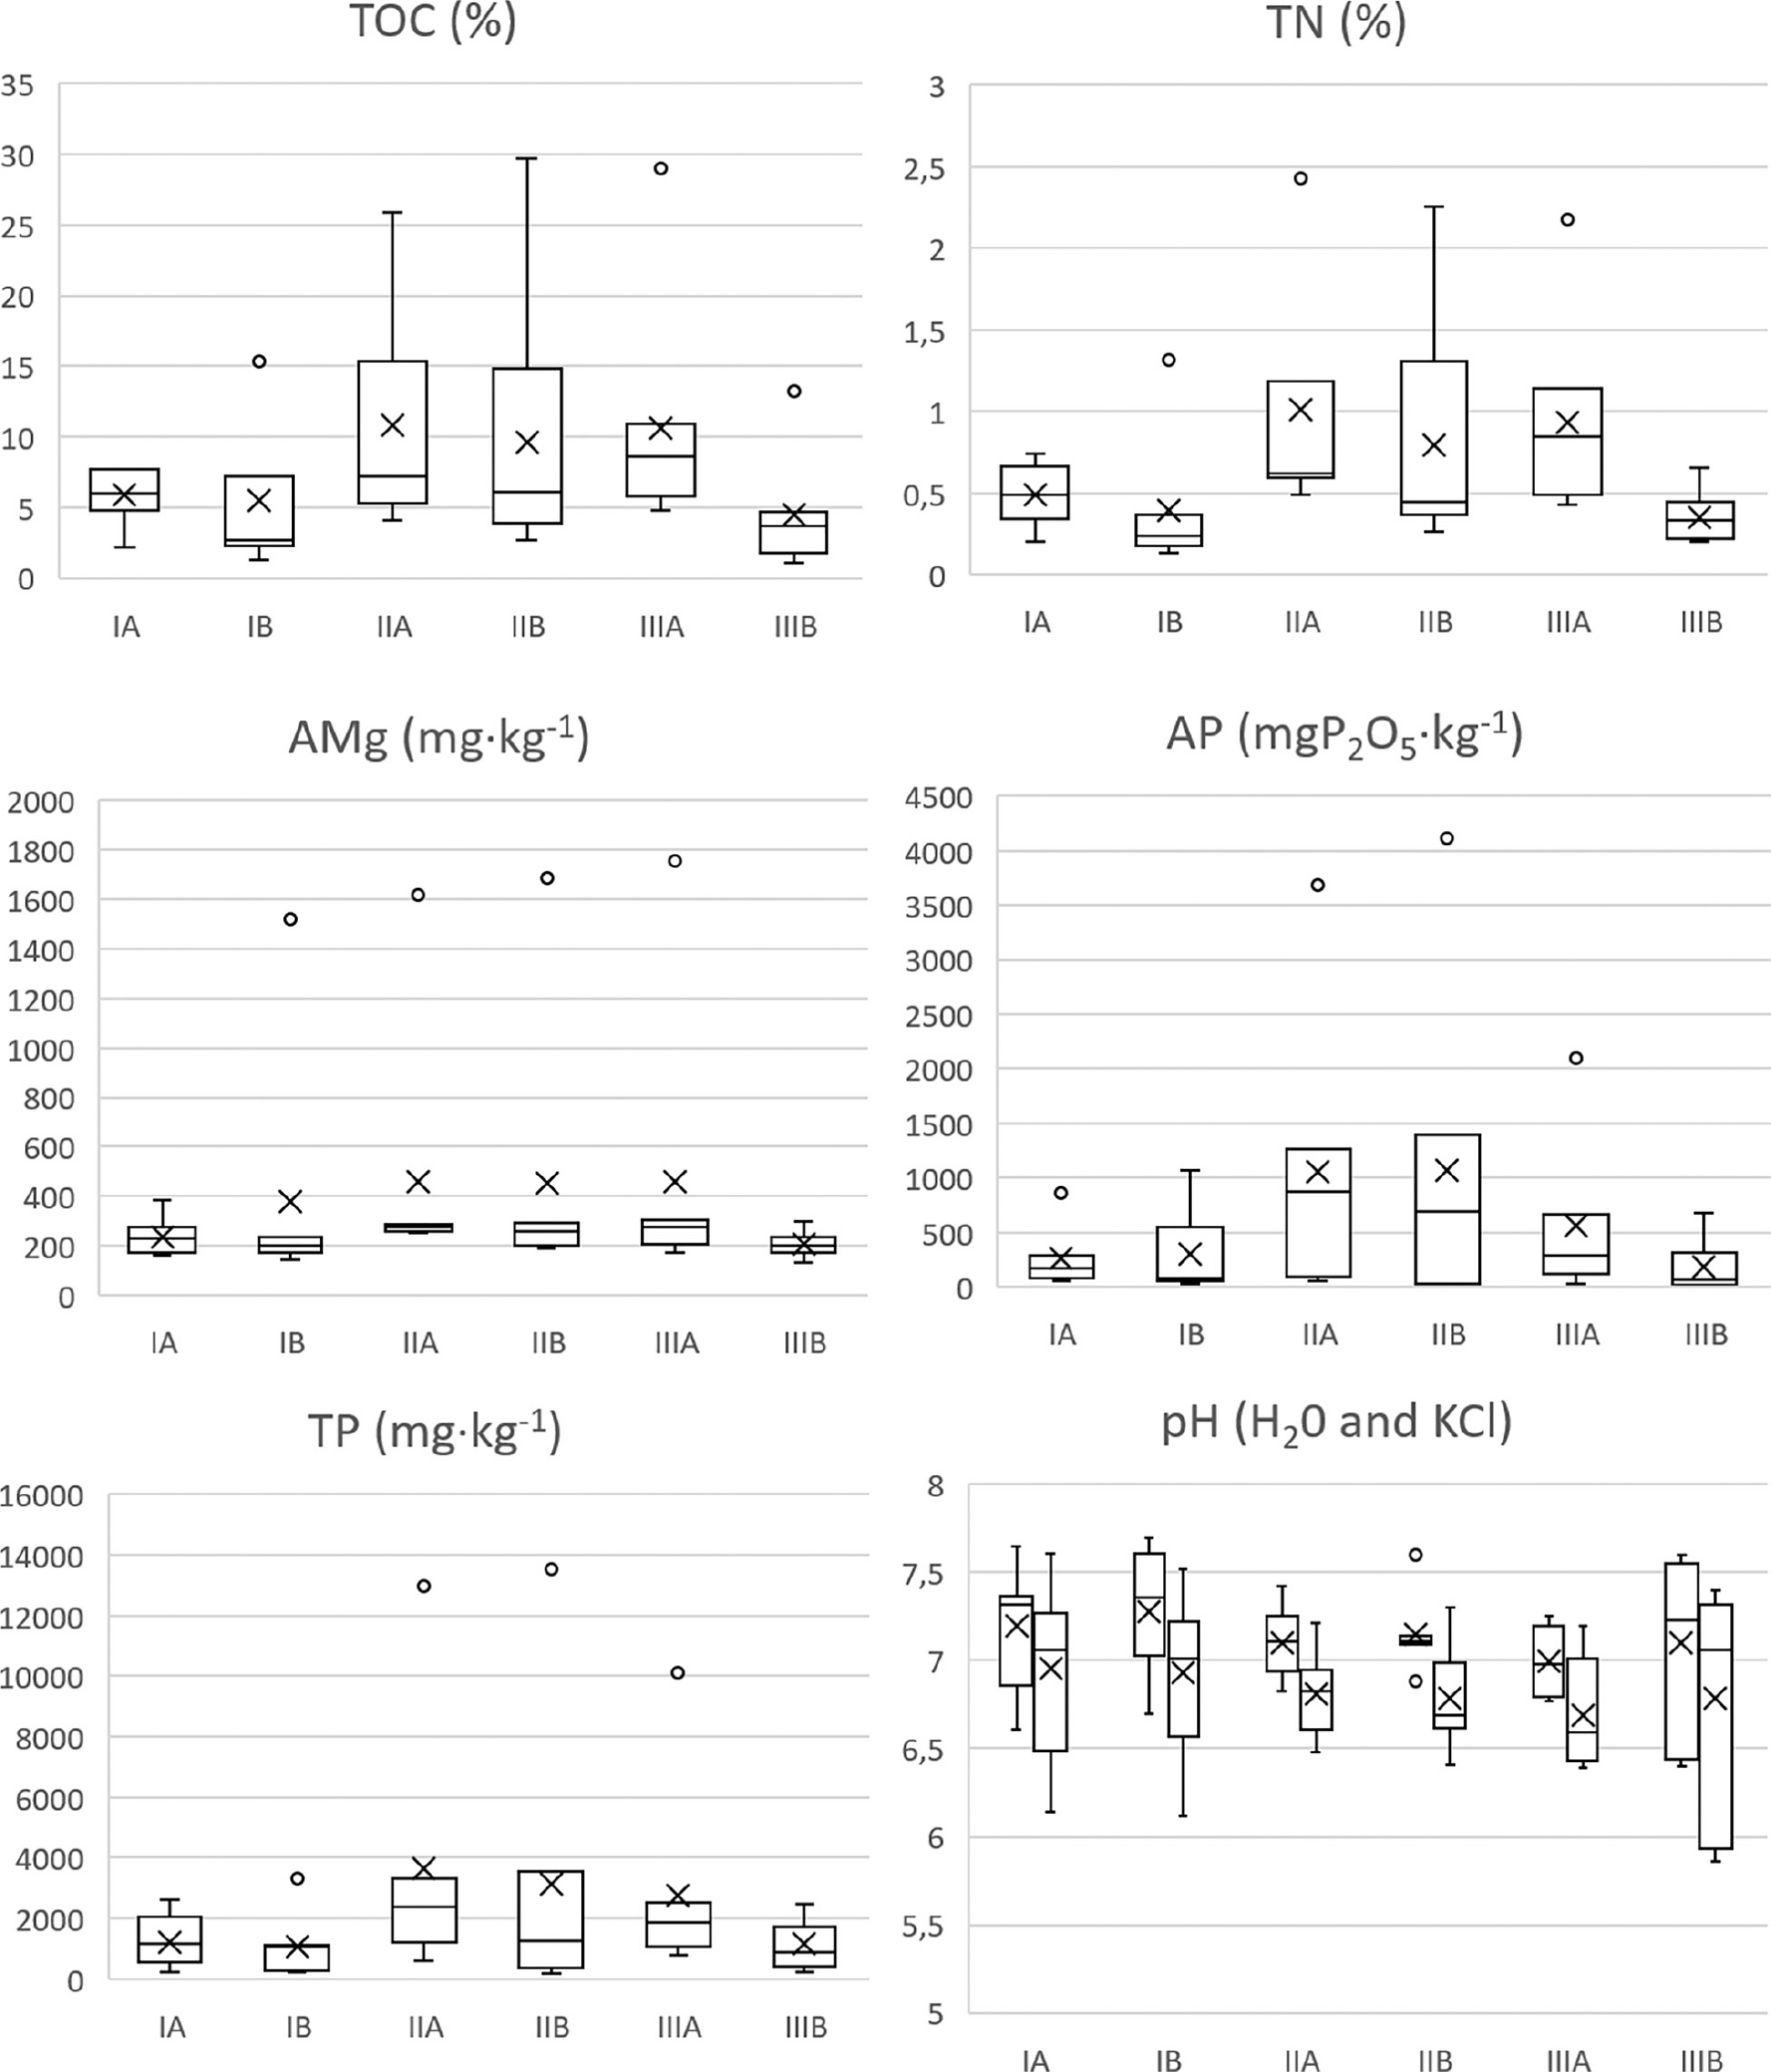
Fig. 5.
Variation of soil properties depending on the sampling location along the transect. Explanations: IA – upper part, upper depth; IB – upper part, lower depth; IIA – middle part, upper depth; IIB – middle part, lower depth; IIIA – lower part, upper depth; IIIB – lower part, lower depth (see Fig. 3). Explanation: The box represents the IQR, the horizontal line inside the box indicates the median, the cross (×) denotes the mean value and whiskers indicate the minimum and maximum values excluding outliers; outliers are shown as individual points.
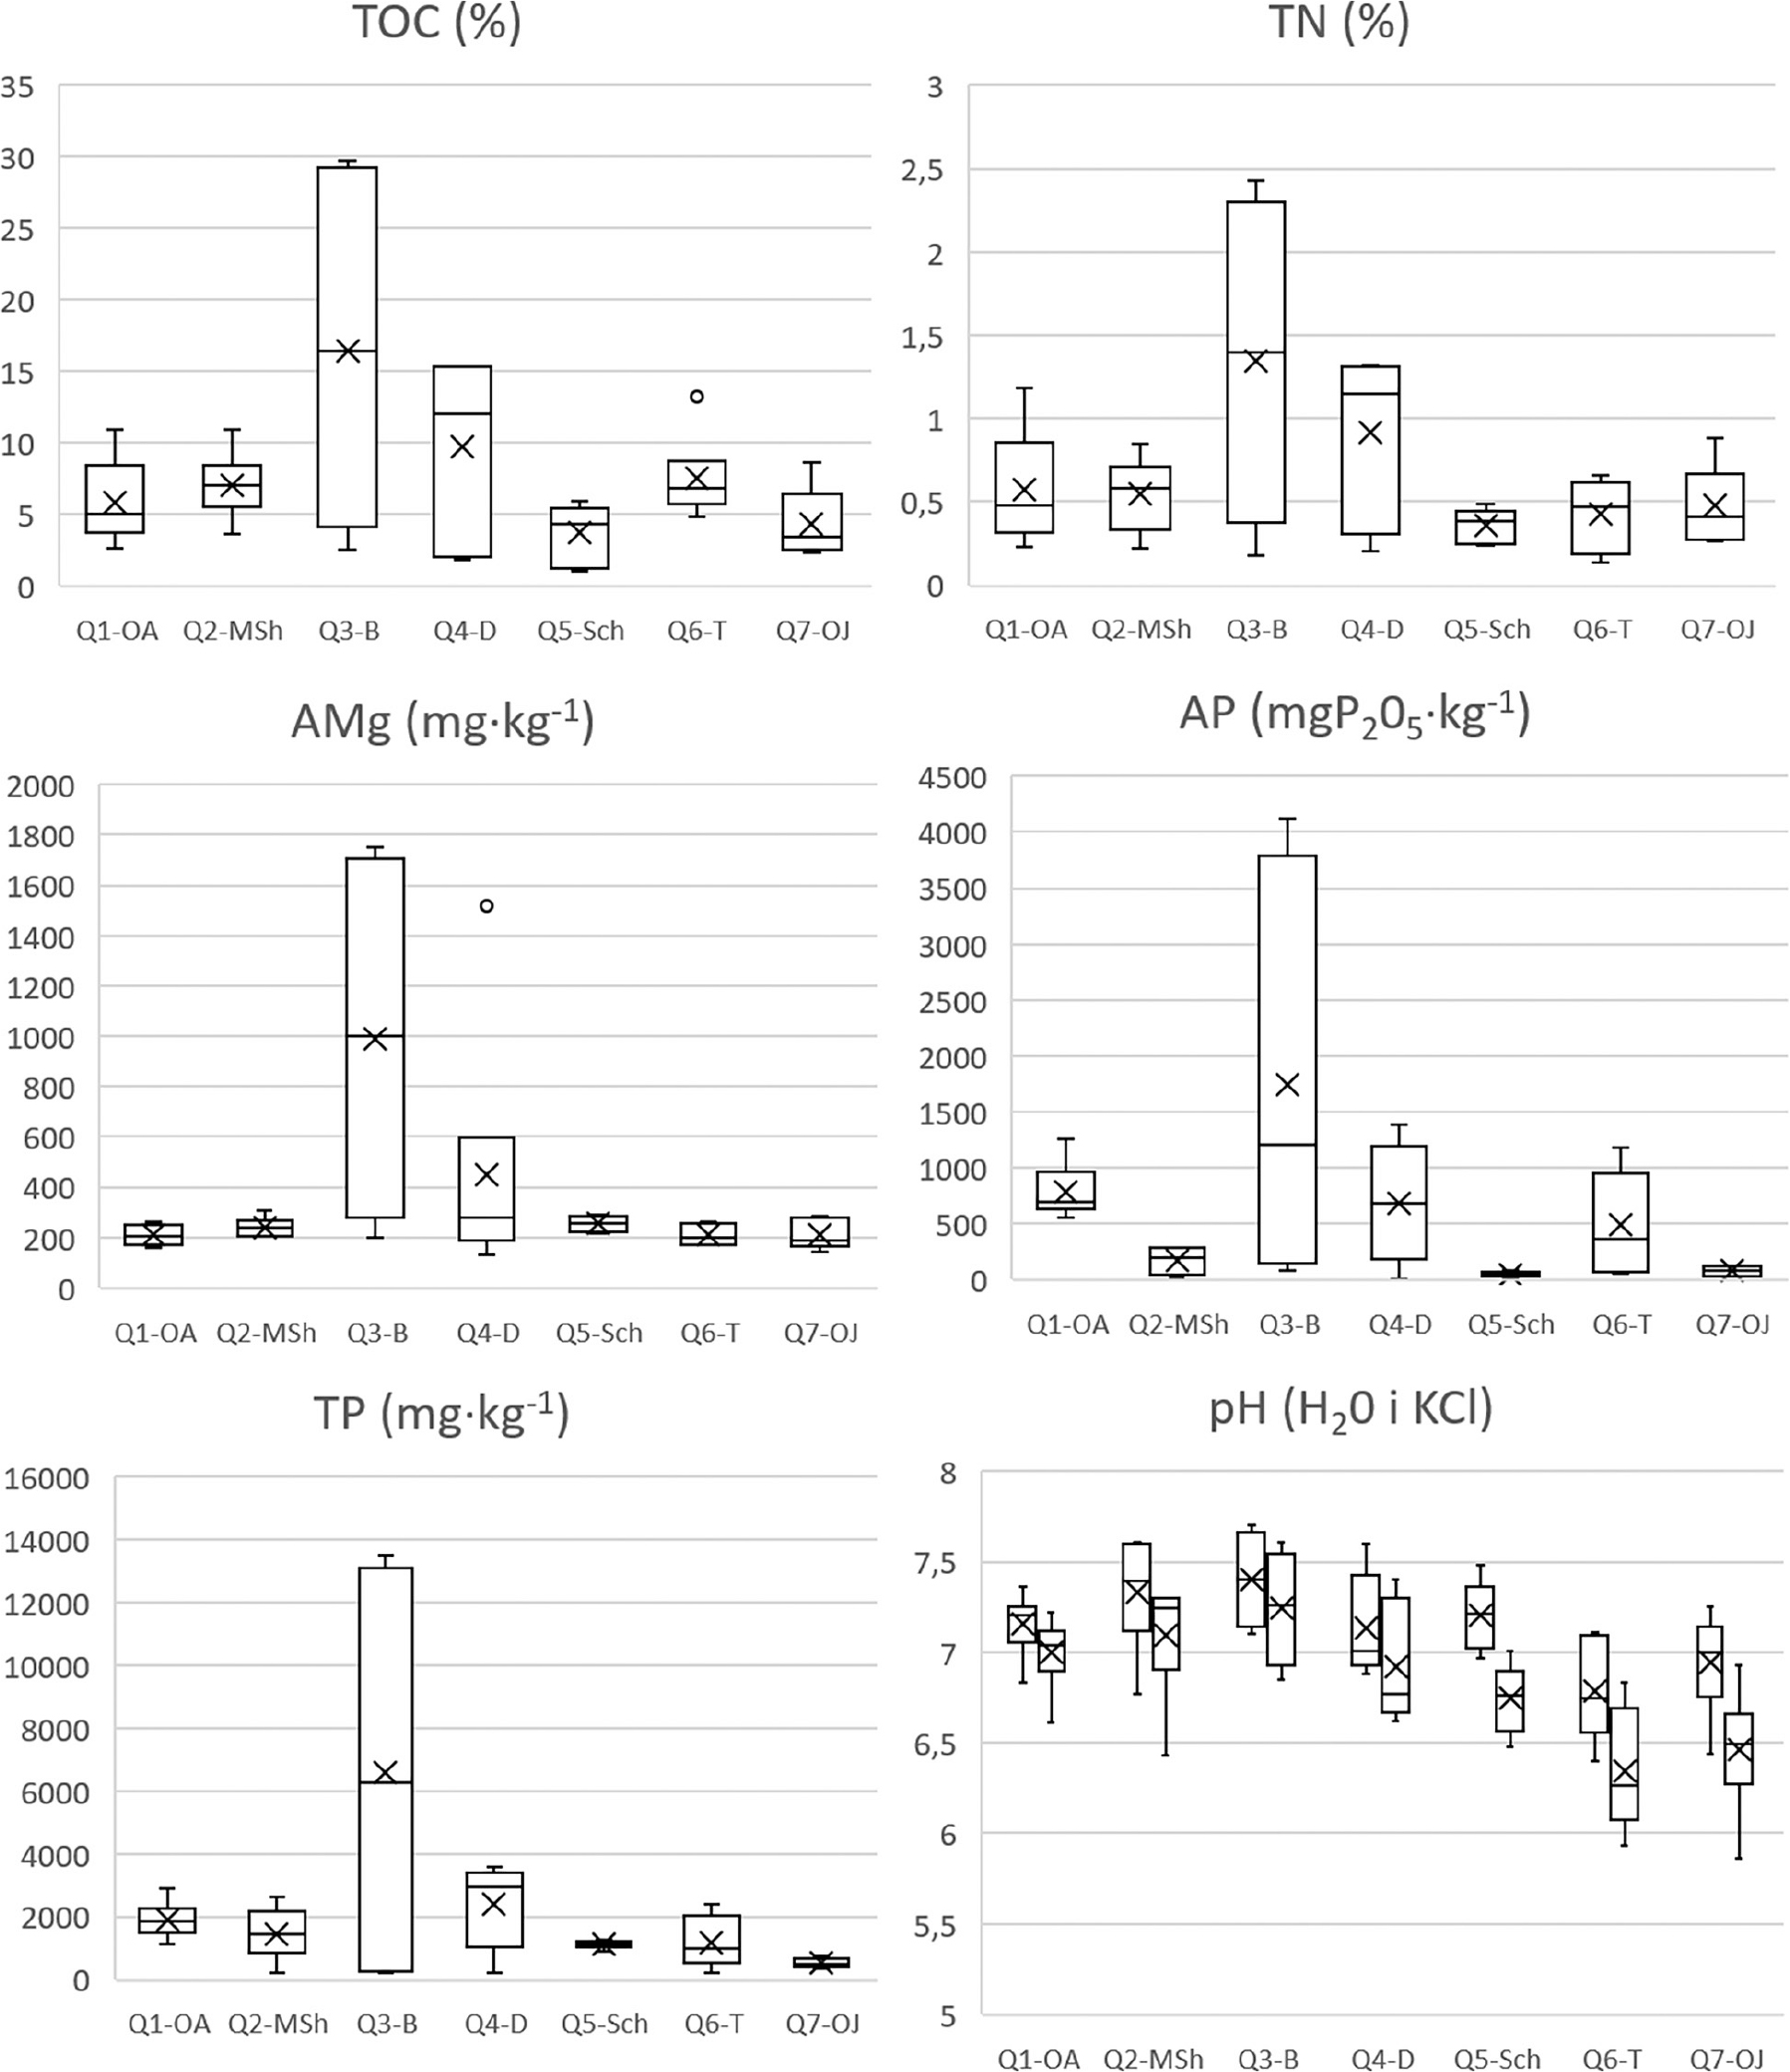
Fig. 6.
Variation of soil properties between individual qutans. Explanations: Q1-OA – Ovulgi Alisho, Q2-MSh – Murodali Sherali, Q3-B – Bibijon, Q4-D – Dushacha, Q5-SCh – Suchti Chuqurak, Q6-T – Tushqoq, Q7-OJ – Ovulgi Jalol (see Fig. 1). Explanation: The box represents the IQR, the horizontal line inside the box indicates the median, the cross (×) denotes the mean value and whiskers indicate the minimum and maximum values excluding outliers; outliers are shown as individual points.
Soil chemical properties
The basic descriptive statistics and normality test results are presented in Table 2. The Shapiro–Wilk test was conducted to assess the normality of the distribution for continuous variables. The results showed that the distributions for all chemical parameters deviated from normality (p < 0.01).
Table 2.
Descriptive statistics grouped by chemical parameters and depth of soil sample collection, along with normality test results.
| Parameter | Depth | Descriptive statistics | CV | W | p | |||||||
|---|---|---|---|---|---|---|---|---|---|---|---|---|
| n | M | Mdn | Min | Max | IQR | SD | SK | |||||
| TN (%) | A | 21 | 0.81 | 0.61 | 0.20 | 2.43 | 0.39 | 0.56 | 1.95 | 0.64 | 0.77 | <0.01 |
| B | 21 | 0.51 | 0.34 | 0.14 | 2.26 | 0.21 | 0.51 | 2.50 | 0.62 | 0.65 | <0.01 | |
| TOC (%) | A | 21 | 9.09 | 6.99 | 2.13 | 29.03 | 3.41 | 6.73 | 2.18 | 0.49 | 0.72 | <0.01 |
| B | 21 | 6.55 | 4.03 | 1.08 | 29.69 | 4.45 | 6.77 | 2.34 | 1.10 | 0.72 | <0.01 | |
| AMg (mg · kg−1) | A | 21 | 385.2 | 263.5 | 160.0 | 1752.5 | 71.0 | 435.4 | 2.91 | 0.27 | 0.46 | <0.01 |
| B | 21 | 346.8 | 214.0 | 132.0 | 1687.5 | 74.0 | 420.9 | 2.93 | 0.35 | 0.45 | <0.01 | |
| AP(mg · P2O5 · kg−1) | A | 21 | 622.8 | 250.7 | 32.7 | 3684.2 | 744.2 | 875.9 | 2.53 | 2.97 | 0.68 | <0.01 |
| B | 21 | 518.1 | 76.3 | 4.4 | 4120.2 | 646.8 | 929.5 | 3.21 | 8.48 | 0.58 | <0.01 | |
| TP (mg · kg−1) | A | 21 | 2540.2 | 1885.0 | 224.8 | 12,980.0 | 1436.0 | 3140.7 | 2.70 | 0.76 | 0.61 | <0.01 |
| B | 21 | 1782.0 | 1112.0 | 201.2 | 13,520.0 | 1343.0 | 2858.6 | 3.79 | 1.21 | 0.52 | <0.01 | |
1 Annotation: n – subgroup size; AP – available phosphorus; CV – coefficient of variation; IQR – interquartile range; M – mean; Max – maximum value; Mdn – median; Min – minimal value; OA – organic-humus; P – p-value; SD – standard deviation; SK – Skewness; TN – total nitrogen; TOC – total organic carbon; TP – total phosphorus; W – Shapiro-Wilk’s test statistics. A – stands for samples originating from the upper soil depth, representing the OA or humus (A) horizons; B – stands for samples collected from lower soil depth, located below the humus layers, mainly from the subsoil B (see Fig. 3).
From the descriptive statistics, higher values are observed at the upper depth for all parameters (Table 2; Fig. 5). The highest values for the analysed chemical parameters were found in the middle part of the qutans (II). The only exceptions to this trend are TN and TOC, which reach their highest values at the upper depth in the lower part of qutan (IIIA). The coefficient of variation (CV) indicates very strong (AP, TP), strong (TOC in the lower depth and TN), medium (TOC in upper depth) and weak (AMg) variability in the parameter values.
Outliers were observed for all chemical parameters within qutan Q3-B (Fig. 6), particularly throughout the entire profile of the middle part (IIA, B) and the upper part of the profile in the lower section of the qutan (IIIA), where the results were significantly above the average values. Additionally, significantly higher values were found within qutan Q4-D for TN across the entire profile of the middle part (IIA, B), in the lower part of the profile in the upper section (IB) and the upper part of the profile in the lower section of the qutan (IIIA) (Fig. 6). For AMg, the elevated values were observed in the lower part of the profile in the upper section of the qutan (IB).
Phosphorus (P) content varied across the individual qutans. Both available P (4120 mg·kg−1) and total P (13520 ·mg·kg−1) were highest in the central parts of Q3-B and Q4-D, where the surface is flat, making these the most P-enriched values among all samples (Fig. 6).
TP shows less variability (Fig. 5) compared with AP. The highest concentrations of AP were also found in the Q4-D (1068 mg·kg−1) and Q1-OA (1262 mg·kg−1) sites, where TP also exhibited high values. However, high concentrations of TP do not affect AP concentrations in the Q2-MSh, Q5-Sch and Q7-OJ qutans. In these qutans, the highest AP values were generally found in the O and A horizons of the second sectors of the transects. In contrast, lower AP values were recorded in Q5-Sch (4.3676.30 mg·kg−1), Q7-OJ (33.14–119.46 mg·kg−1) and lower TP values in Q7-OJ (367–775 mg·kg−1) (Fig. 6).
Available magnesium concentrations varied across the individual qutans (Fig. 6). The average AMg values for the transect sections (I, IIB) of each qutan are as follows: Q3-B (990 mg·kg−1), Q4-D (450 mg·kg−1), Q5-Sch (254 mg·kg−1), Q2 (241 mg·kg−1), Q6-T (210 mg·kg−1), Q1-OA (209 mg·kg−1) and Q7-OJ (209 mg·kg−1).
Similar trends were observed for organic carbon (TOC) and TN, as with phosphorus. The highest TOC concentrations were found in section IIB (Q3-B, 29.69%) and section IIIA (Q3-B, 29.03%). Similarly, the highest nitrogen content was recorded in the same sections, with values of 2.425% for Q3-B in section IIB and 2.258% for Q3-B in section IIIA. Additional differences in TOC and TN concentrations are presented in Figure 5. The C/N ratio generally falls within a narrow range of 4–24 across most positions, except for Q6-T (C/N-53). These ranges are indicative of efficient organic matter metabolism by microorganisms.
Differences in chemical parameters
A non-parametric test (Mann–Whitney test) for independent samples revealed a statistically significant difference in the mean TN concentrations between the upper depth (A) and lower (B) soil layers. The mean TN in the upper layer (A) was 0.812 (standard deviation [SD] = 0.563), while in the lower layer (B) it was 0.512 (SD = 0.513) (Table 3). Specifically, TN concentrations were significantly higher in the upper layer than in the lower layer.
Table 3.
Results of difference test for upper and lower soil layer.
| Parameter | Unit | Depth | Descriptive statistics | Mann–Whitney test | ||||
|---|---|---|---|---|---|---|---|---|
| M | SD | Average rank | U | Z | p | |||
| Total nitrogen | [%] | A | 0.81 | 0.56 | 27.24 | 100.0 | -3.031 | 0.002 |
| B | 0.51 | 0.51 | 15.76 | |||||
| Total organic carbon | [%] | A | 9.09 | 6.73 | 25.95 | 127.0 | -2.352 | 0.019 |
| B | 6.55 | 6.77 | 17.05 | |||||
| Magnesium | [mg · kg-1] | A | 385.21 | 435.36 | 24.40 | 159.5 | -1.532 | 0.125 |
| B | 346.76 | 420.87 | 18.60 | |||||
| Available phosphorus | [mg · P2 O5 · kg-1] | A | 622.77 | 875.94 | 24.12 | 165.5 | -1.385 | 0.166 |
| B | 518.10 | 929.51 | 18.88 | |||||
| Total phosphorus | [mg · kg−1] | A | 2540.28 | 3140.65 | 24.71 | 153.0 | -1.698 | 0.090 |
| B | 1781.98 | 2858.58 | 18.29 | |||||
1 Annotation: SD – standard deviation; A – stands for samples originating from the upper soil depth, representing the OA or humus (A) horizons; B – stands for samples collected from lower soil depth, located below the humus layers, mainly from the subsoil (B) (see Fig. 3).
A statistically significant difference for organic carbon (TOC) was found in the Mann–Whitney non-parametric test (U = 100; p < 0.019), with higher mean values in the upper depth (A) (M = 9.089; SD = 6.731) compared with the lower depth (B) (M = 6.546; SD = 6.769) (Table 3). For the remaining parameters, no significant differences were found between the upper and lower depths.
As far as differences in chemical parameters between qutan parts are concerned, a significant difference was found only for the TN parameter (Tables 4 and 5). Specifically, samples IB and IIIB exhibited significantly lower ranks compared with the other samples. This indicates that samples IB and IIIB share similar properties and are distinct from samples IA, IIA, IIIA and IIB, which are more similar to one another. No significant differences were observed for the other parameters.
Table 4.
Descriptive statistics for six types of soil samples.
| Parameter | Unit | Parameter | IA | IB | IIA | IIB | IIIA | IIIB | Total |
|---|---|---|---|---|---|---|---|---|---|
| Total nitrogen | [%] | M | 0.49 | 0.39 | 1.01 | 0.80 | 0.93 | 0.35 | 0.66 |
| SD | 0.19 | 0.42 | 0.69 | 0.73 | 0.61 | 0.16 | 0.55 | ||
| Min | 0.20 | 0.14 | 0.49 | 0.27 | 0.43 | 0.21 | 0.14 | ||
| Max | 0.74 | 1.32 | 2.43 | 2.26 | 2.18 | 0.66 | 2.43 | ||
| Total organic carbon | M | 5.85 | 5.47 | 10.79 | 9.66 | 10.62 | 4.51 | 7.82 | |
| SD | 1.95 | 4.95 | 7.63 | 9.71 | 8.40 | 4.06 | 6.79 | ||
| Min | 2.13 | 1.22 | 4.08 | 2.64 | 4.80 | 1.08 | 1.08 | ||
| Max | 7.66 | 15.30 | 25.84 | 29.69 | 29.03 | 13.24 | 29.70 | ||
| AMg | [mg · kg−1] | M | 236.7 | 381.0 | 461.3 | 452.1 | 457.64 | 207.2 | 366.0 |
| SD | 76.9 | 502.2 | 508.9 | 546.2 | 573.00 | 53.3 | 423.4 | ||
| Min | 160.0 | 142.0 | 255.0 | 187.0 | 171.0 | 132.0 | 132.0 | ||
| Max | 382.0 | 1517.5 | 1615.0 | 1687.5 | 1752.5 | 301.0 | 1752.5 | ||
| Available phosphorus | [mg · P2O5 · kg−1] | M | 258.9 | 305.4 | 1050.7 | 1065.4 | 558.8 | 183.5 | 570.4 |
| SD | 277.8 | 384.8 | 1261.4 | 1462.4 | 718.6 | 246.0 | 893.6 | ||
| Min | 58.9 | 33.1 | 58.9 | 4.4 | 32.7 | 8.7 | 4.4 | ||
| Max | 858.9 | 1068.2 | 3684.2 | 4120.2 | 2097.2 | 682.3 | 4120.2 | ||
| Total phosphorus | [mg · kg−1] | M | 1224.1 | 1065.6 | 3631.7 | 3138.2 | 2765.0 | 1142.2 | 2161.1 |
| SD | 856.4 | 1081.1 | 4228.0 | 4710.7 | 3286.4 | 810.5 | 2990.8 | ||
| Min | 224.8 | 204.8 | 598.0 | 201.2 | 775.0 | 220.4 | 201.2 | ||
| Max | 2605.0 | 3330.0 | 12,980.0 | 13,520.0 | 10,090.0 | 2455.0 | 13,520.0 |
Table 5.
Results of Kruskal–Wallis test in six samples.
| Sample parameter | Average rank | ||||
|---|---|---|---|---|---|
| Total nitrogen | Total organic carbon | AMg | Available phosphorus | Total phosphorus | |
| [%] | [mg · kg−1] | [mg · P2O5 · kg−1] | [mg · kg−1] | ||
| IA | 21.00 | 21.07 | 18.07 | 20.43 | 19.14 |
| IB | 11.43 | 16.43 | 15.14 | 18.79 | 14.71 |
| IIA | 31.14 | 28.14 | 30.00 | 28.36 | 29.71 |
| IIB | 23.07 | 22.14 | 25.93 | 23.29 | 22.86 |
| IIIA | 29.57 | 28.64 | 25.14 | 23.57 | 25.29 |
| IIIB | 12.79 | 12.57 | 14.71 | 14.57 | 17.29 |
| H Kruskal–Wallis | 15.733 | 9.359 | 9.459 | 5.165 | 7.117 |
| df | 5 | 5 | 5 | 5 | 5 |
| p | 0.008 | 0.096 | 0.092 | 0.396 | 0.212 |
Discussion
In this study, we demonstrated how soil chemical properties vary between different summer livestock camps and within each camp, depending on grazing intensity and topography. Our study examined the variability of soil properties along a transect within summer livestock camps (qutans). These camps differ in surface area, slope and proximity to water sources.
Summer livestock camps located above springs are characterised by steep surfaces and a mosaic of vegetation, whereas camps with even steeper slopes often have shallow soil profiles, with excrement deposited directly on the bedrock (Fig. 7A). This variation in terrain and camp characteristics likely leads to differences in soil chemical properties between camps. Erosion from cattle grazing and surface runoff leads to the accumulation of organic-mineral material in the central and lower sections of qutans, especially where steeper slopes cause greater runoff (Fig. 7B). The accumulation of organic matter in lower areas indicates that soil chemical properties also vary within individual camps depending on slope and runoff.
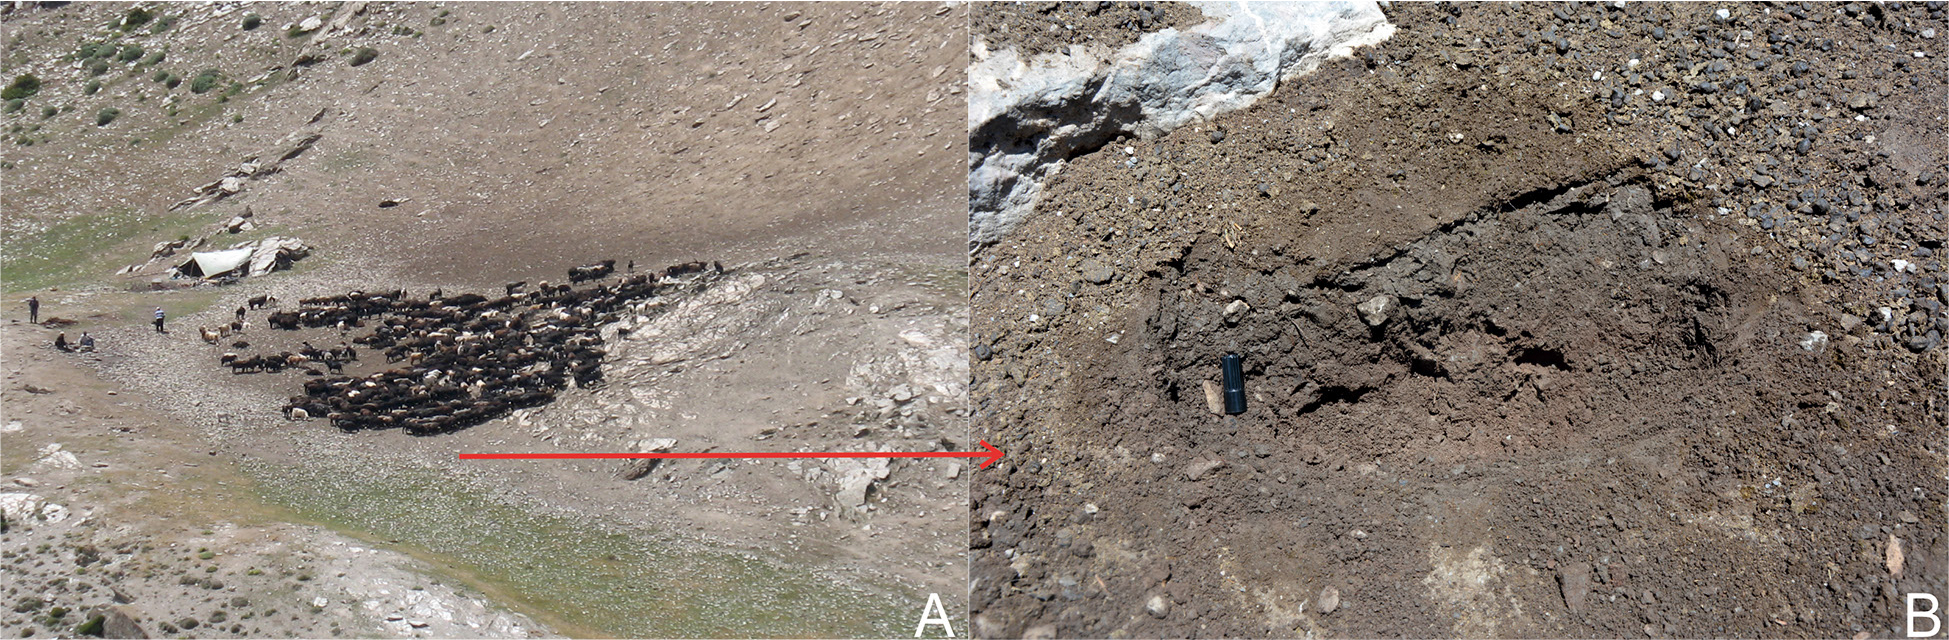
Fig. 7.
Contemporary usable qutan: located on a steep, eroded slope A – and accumulating organic-mineral materials as a result of erosion B.
On the other hand, summer livestock camps with relatively gentle slopes (Q5-SCh) feature a thick organic horizon or its lack, primarily composed of animal-derived material. These areas are often almost devoid of plant cover, with only a single species growing in the shade of rocks, where the impact of animal fertilisation is minimal. Most of the summer livestock camps in the study area are located at altitudes between 2600 m a.s.l. and 3000 m a.s.l. (Rahmonov et al. 2017a). In contrast to the Kuli Kalon Basin, summer livestock camps near Artuch village are situated on brown mountain soils with thicker profiles, reaching depths of up to 1 m. These areas are characterised by abundant vegetation, which is particularly vibrant in early spring and clearly marks the boundaries of the qutans, visible from distances of 10–15 km. In the Kuli Kalon Basin, the central areas of the summer camps appear mostly black, with narrow strips of vegetation marking the borders (Figs 2A, C, E).
The Urej River Basin, like other regions of the Fann Mountains, is characterised by significant elevation differences and high geomorphological diversity over relatively short distances. This variation contributes to a landscape with diverse terrain slopes and aspects, which in turn influence the range of vegetation, soil mosaic and the suitability of the area for summer livestock grazing, particularly goat and sheep breeding. Steep, high ridges and deep, narrow valleys foster soil erosion processes due to intensive water runoff, which often strips the soil cover down to the parent rock as a result of intensive grazing from historical times to the present (Rahmonov et al. 2017b, 2024). Consequently, most soil profiles in this area lack surface horizons, such as organic (O) and humus (A) layers. This situation has been observed mainly in unused qutans, such as Suchti Chuqurak (Q5-SCh), Tushqoq (Q6-T) and Ovulgi Jalol (Q7-OJ). In the case of Suchti Chuqurak (Q5-SCh), the area of qutans in 1987 was cultivated for barley by kolkhoz (Rahmonov et al. 2017a, b, 2024), which accelerated the soil erosion. The distinct physiographical features of the region play a key role in the formation of specific types of mountain soils (Kuteminskiy 1960, 1966); therefore, the occurrences of qutans in this region are also closely linked to terrain forms.
An important factor influencing soil properties is seasonal cattle grazing, which takes place from May to August and occurs both in stationary and transhumant systems, depending on climatic conditions. By the end of May, air temperatures in the Fan Mountains increase (to about 24°C) and with the end of the school year, the breeding and grazing season for domestic livestock begins. At the same time, sheep return from wintering grounds; in both cases, the grazing season ends in September. The terrain in the Urej River basin is highly diverse in geomorphological terms. The vast majority of the catchment area is characterised by slopes steeper than 40°, covering almost 98% of the basin. In contrast, the flattest surfaces (0–20°) occupy only 1.9 km2 (0.7%) and are located in the Kulikalon Basin and in the vicinity of the village of Artuch (Rahmonov et al. 2024). Grazing on slopes steeper than 30° accelerates soil erosion and the degradation of soil horizons, thereby negatively affecting soil condition and stability. Additionally, livestock herds arrive at the summer livestock camp (qutans) both during the day and at night, where, as noted above, they remain for approximately 10 h. This results in the deposition of substantial amounts of animal excrement (dung and urine) into the soils of actively used qutans, including Ovulgi Alisho (Q1-OA), Murodali Sherali (Q2-MSh), Bibijon (Q3-B), Dushacha (Q4-D) and Ovulgi Jalol (Q7-OJ). The area of these camps typically ranges from 10 acres to 40 acres. In these areas, specific soil types form that are noticeably different from those found just beyond the borders of the qutan. This phenomenon has been observed in other mountain regions around the world, including cattle camps in New Zealand (Sheath, Boom 1985), the Pyrenees (Aldezábal et al. 1999) and the French Alps (Deléglise et al. 2019). Rahmonov et al. (2017a) also documented variations in soil chemistry relative to the distance from the qutan in the Fann Mountains.
The natural soils on which qutans are formed, according to the international classification (IUSS Working Group WRB 2022), include Calcaric Skeletic Fluvic Cambisol (Ochric) (Q3-B, Q4-D – lateral moraines), Calcaric Hyperskeletic Leptosol (Q1-OA, Q2-MSh – foot of the slope with active scree) and Cambisol (Q5-Sch, Q6-T, Q7-OJ – mountain slope). The position of the qutan within the terrain and the degree of slope inclination significantly influence the formation of the organic horizon and its distribution within the qutan.
In the studied qutans, notable differences were observed in the thickness of the organic-humus and humus horizons, as well as their enrichment (subsoil) in the individual studied cross-sections. The Q3-B area, and partly Q4-D, have relatively flat surfaces and are not subject to erosion, resulting in considerable thickness of the O and OA horizons. Organic matter from cattle appears in the form of a cover, creating a distinct boundary with the mineral horizons (A, AB), accumulating in layers.
In contrast, in section I of the transects, the horizons form as mixed organic-humus horizons (OA). The mineral material in these areas comes from higher elevations, both due to grazing and surface runoff, which explains the dominance of the earth fraction (73.9–91.9%) in the analysed samples. Only in the Q1-OA site is the rock fragments fraction (>10–2 mm) dominant, comprising 39.8%. Similar results regarding soil horizon diversity and granulometric composition were observed at similar altitudes in the Pamir-Alay range (Tajikistan) by Rahmonov et al. (2017a) and Kabała et al. (2021).
In the Q5-Sch and Q7-OJ positions, horizon B reaches the surface directly due to the destruction of the humus horizon caused by overgrazing, the degree of slope and the susceptibility of the soil material to erosion. The fertility of qutan Q5-Sch led to its cultivation with wheat in 1988–1989, but the preceding ploughing further accelerated erosion, ultimately destroying the humus horizon.
Regarding granulometric composition, the analysed soil samples exhibit significant variability, particularly in the fraction >2.0 mm, which is most commonly associated with high altitude environments. In all samples, the fine fraction (2.0–0.1 mm) dominates within the humus horizon, partly due to material displacement caused by erosion from cattle near the qutans. This trend may also reflect the sampling focus, as only humus horizon samples were analysed. In this respect, the analysed soils differ from typical soils found in the upper mountain zone, which are characterised by high stoniness, a relatively coarse structure (low clay content), high carbonate levels, a neutral to alkaline reaction and low humus content (Kann 1965, Agakhanyantz, Lopatin 1978, Rahmonov et al. 2017a, Kabala et al. 2021). The analysed samples also exhibit a similar pH, largely due to the high carbonate content of the parent rock. Additionally, cattle excrement contributes to pH levels, further influencing soil chemistry.
The analysed soil horizons are rich in TN, organic carbon (TOC) and TP compared with neighbouring areas with less animal excrement. These elevated concentrations are closely related to cattle dung and urine. Higher values of TOC, TN and TP are found in almost all sections of IA (level OA), IIA and IIIB in the top layers, where animal excrement often forms a hard crust over the mineral layer. This crust, influenced by clay minerals, typically has low infiltration capacity, which results in lower concentrations of TOC, TN and TP in the deeper layers. It is important to note that plant communities are rarely present in qutan areas, limiting their contribution to the formation of soil organic matter.
The highest values of TOC, TN, AP, AMg and TP were recorded in Q3-B and Q4-D across almost all cross-sections and depths (Fig. 6). These findings confirm that grazing intensity and terrain morphology strongly influence nutrient accumulation in the soil. This is mainly due to the relatively flat surfaces of these areas, which are characterised by varied terrain morphology that systematically promotes the accumulation of organic matter from animal excrements, leading to the formation of a thicker organic horizon. In these areas, organic matter is not removed by surface runoff, which explains the thicker horizon and higher content of TOC, TN and TP. For example, in cross-section IIIB (Q4-D), the parent rock is located at a depth of 15 cm, with only the O or OA horizon above it. These results are also confirmed by similar TN content (Q3-B: IIa-2.425, 2.258%) and organic carbon (Q3-B: 29.69; 29.03%), despite varying depths – these levels show even distribution.
Similar findings for organic carbon (3.93–5.49%) and TN (0.50–0.84%) have been reported in studies of soil properties in livestock camps on summer pastures in the Pyrenees (Badía et al. 2008) and in sheep camps in Australia, where the C/N ratios were also comparable to those observed in the analysed area (Niu et al. 2009). Another possible explanation for these findings could be the random or point accumulation of specific factors. Similar patterns are observed in the distribution of magnesium and AP, where the highest values also occur in locations Q3-B and Q4-D. The reasons for this differentiation are similar to those of TOC, TN and TP.
Although the TP values are higher in these areas, they do not significantly impact the concentration of AP. Phosphorus, once released by mineral salts, quickly precipitates into less soluble forms, meaning only a portion of it remains available to plants. Additionally, low temperatures can further limit phosphorus availability. A drop in temperature below 13°C can reduce phosphorus availability by up to 70% (Li et al. 2020), which could help explain the low content of AP compared with TP.
Animal faeces contain more TP than AP because a substantial portion of phosphorus in animal excreta occurs in organic forms, such as phytates, which are not directly available to plants (Barnett 1994, Pagliari, Laboski 2012). Organic phosphorus requires microbial mineralisation to become plant-available. This process is relatively slow and strongly dependent on environmental conditions, such as soil moisture and temperature, which may lead to a dominance of TP over AP in the studied soils. Areas of intensive grazing, where animals regularly deposit excrement, are often devoid of vegetation. Accumulated dung can form a compact crust on the soil surface, promoting surface runoff at the expense of water infiltration into deeper soil layers. Consequently, water retention is reduced, and microbial processes responsible for organic phosphorus mineralisation are slowed.
Soil temperature controls microbial activity and the rate of chemical reactions governing phosphorus cycling. Higher temperatures enhance microbial activity, accelerating the mineralisation of organic phosphorus (Mishra et al. 2015, Wu et al. 2019). In mountainous areas such as the Fann Mountains, extremely low or high temperatures may limit mineralisation and indirectly affect phosphorus availability by altering water retention and microbial conditions (Wu et al. 2019). Microorganisms can partially adjust their activity in response to temperature fluctuations, but this adaptation does not fully compensate for the constraints imposed by unfavourable thermal conditions (Bogati et al. 2024).
Soil pH plays a key role in regulating phosphorus availability (Amin 2023, Holland et al. 2024). Under acidic conditions, phosphorus is strongly bound by aluminium and iron oxides and hydroxides, reducing its availability to plants (Lemanowicz 2018, Huang et al. 2021). In alkaline soils, particularly those rich in calcium carbonate (CaCO3), phosphorus can precipitate as sparingly soluble calcium phosphates, further limiting its availability (Xu et al. 2010, Wuenscher et al. 2015, Tandy et al. 2021). In practice, phosphorus availability is highest at near-neutral pH levels, whereas both low and high pH levels can restrict its plant accessibility.
Calcium carbonate primarily affects phosphorus dynamics by increasing pH and promoting the formation of insoluble calcium phosphates. High CaCO3 concentrations in the studied soils (averaging 10–20% in the Fann Mountains; Rahmonov et al. 2017b) favour phosphorus precipitation, thereby limiting the pool of AP for plants. Variations in soil mineral composition and particle-size distribution further influence phosphorus retention and release (Lemanowicz, Krzyżaniak 2015). In slope soils, fine particles are often washed away, reducing the soil’s water-holding capacity and consequently slowing the mineralisation of organic phosphorus. The measured soil pH in the qutans ranged from slightly acidic to slightly alkaline (6.4–7.7 in H2O), generally near neutral, which is considered optimal for phosphorus availability. However, AP remained low in some qutan areas (Q2-MSh, Q5-SCh and Q7-OJ). The causes of low AP concentration in the case of Q2-MSh are related to the fresh inflow of animal excrement and its daily cleaning, which disrupts the natural processes of mineralisation of organic phosphorus substances. The soil in the Sukhti Chuqurak region (Q5-SCh) is largely devoid of organic matter due to past ploughing, and its loss has accelerated erosion processes that have affected the AP content. In the case of Ovulgi Jalol (Q7-OJ), the difference in AP compared with other analysed sites results from the degree of slope of the terrain and its intensive use, which translates into the lack of vegetation cover (apart from single species, Table 1).
In the vicinity of the studied qutans, across different plant communities, the results for AP and AMg ranged from 2.62 mg·kg−1 to 119 mg·kg−1 and 137 mg·kg−1 to 568 mg·kg−1, respectively. While the AP values are relatively low, they are comparable to the available magnesium concentrations observed in this study (Rahmonov et al. 2017a). It is important to note that only one sample in Rahmonov et al. (2017a) was taken from a qutan area, which featured an organic-humus horizon (OA), summer livestock camps, a very hard crust and a clearly layered surface with a 35° slope. The results from this location (39°15'41.37"N; 68°13'04.56"E) in terms of organic carbon (TOC) (11.4%), TN (1.072%), TP (9696 mg·kg−1) and available AP (1739 mg·kg−1) are similar to those found in Q3-B, Q4-D and Q6-T in some sections. This similarity further emphasises the role of animal herds in influencing soil chemistry. The lack of differentiation in some parameters can be attributed to the similarity in the composition of organic-humus, enriched soil horizons and the parent rock in these areas.
The role of animals in enriching the soil with phosphorus and nitrogen through their presence in various environments has been well documented (Rahmonov et al. 2014, Szymański et al. 2016). In open areas, animal excrement accelerates plant colonisation and soil-forming processes. However, in active qutans, these processes are inhibited, leading only to the formation of organic and humus horizons (Figs 2B and 8A). In contrast, in inactive camps (Q5-Sch), the soil’s fertility facilitates the regeneration of the humus horizon that was previously degraded by grazing. In the Urej River Valley, mountain soils, where ecological systems are developing, are used for intensive summer grazing.
Grazing influences soil chemistry, but it also leads to the degradation of soil cover and its biological resources (Abbasi et al. 2007, Hagedorn et al. 2010). The mosaic distribution of organic matter is partly because, during the hottest part of the day (when temperatures reach 30°C), cattle seek cooler areas, such as the limits of the qutan, shrub canopies (Fig. 8) and the shade of rocks. This behaviour contributes to the high concentrations of TP and other soil properties in specific areas, a pattern also observed by other researchers (Metson, Saunders 1978, Pineiro et al. 2010, Ferré et al. 2020). As a result, large amounts of animal excrement accumulate in specific areas of the camp. The transfer of excrement to these areas represents a loss of nutrients from the surrounding land. Over time, the redistribution of nutrients within the pasture leads to an uneven distribution of soil fertility, which can disrupt the nutrient balance across the entire ecosystem (Haynes, Williams 1999, Güsewell et al. 2005).
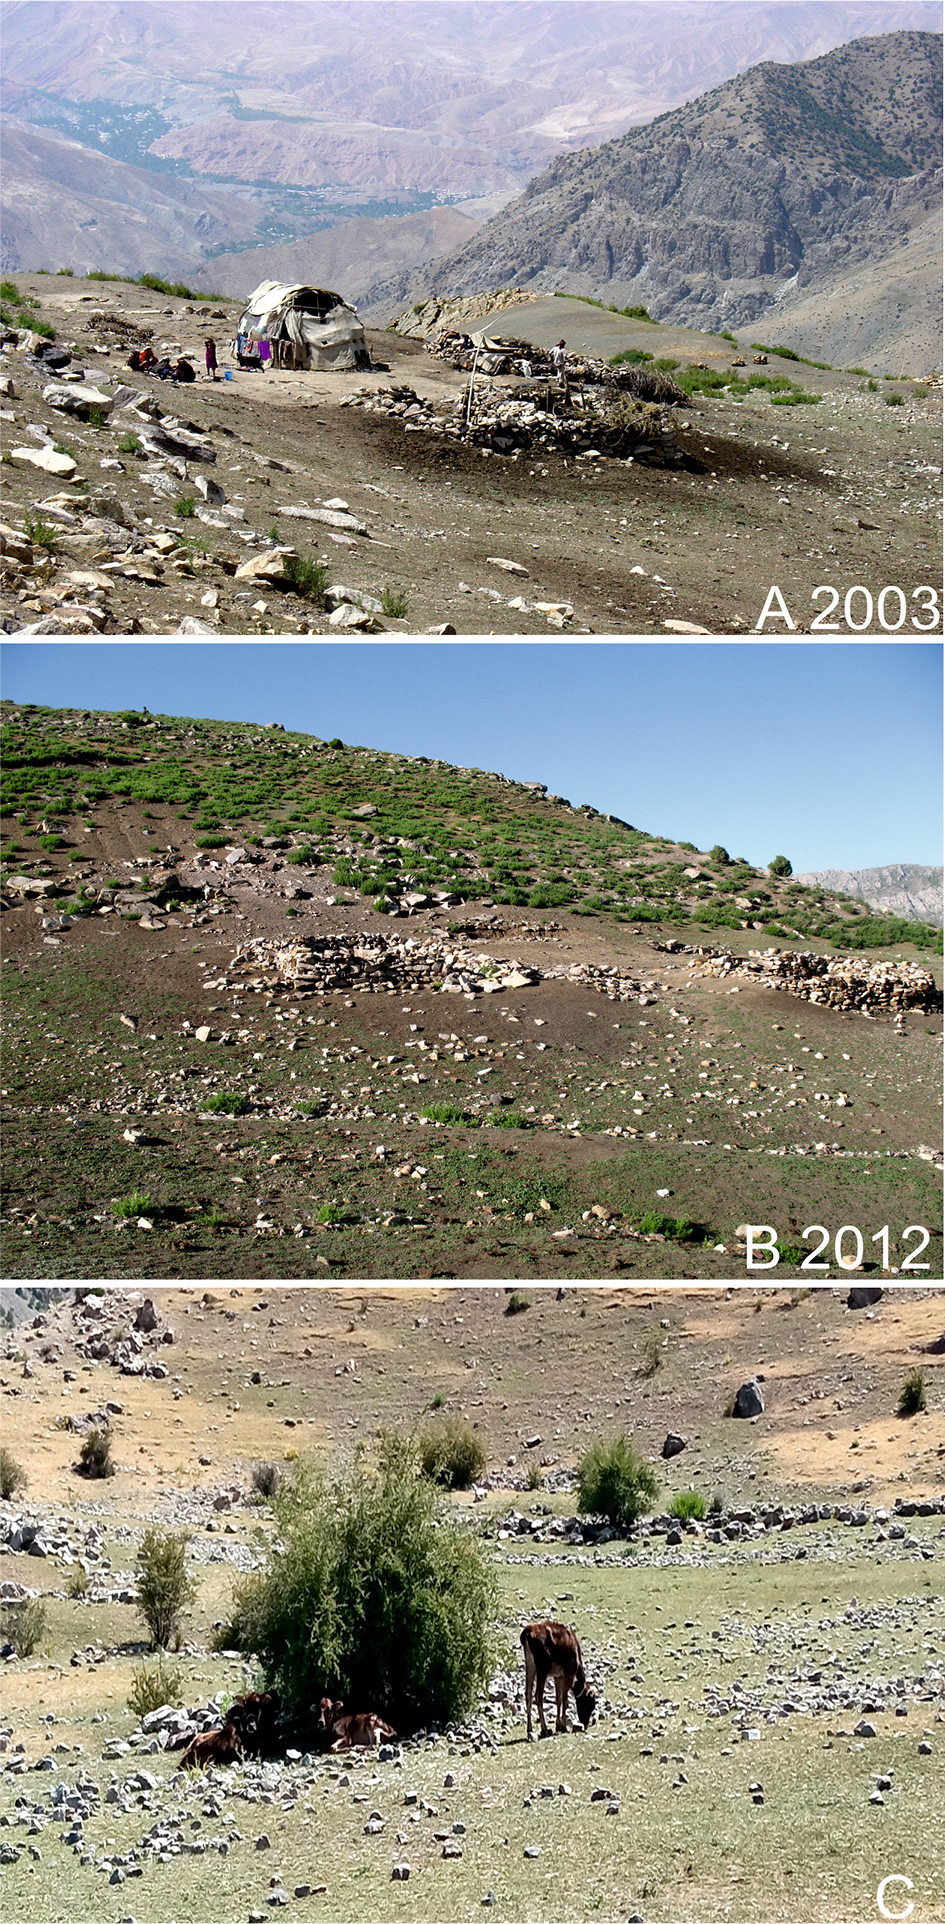
Fig. 8.
Effects of using a summer livestock camp: qutan used in 2003 (A) and not used in 2012 – Tushqoq (Q6-T) (B), with bushes serving as potential resting areas for animals in Suchti Chuqurak (Q5-SCh) (C)
Conclusions
Analyses were conducted to assess the formation of chemical properties in the soils of summer livestock camps, focusing on variations in chemical parameters along a transect that crosses the qutans and spans different soil depths. The results support the initial hypothesis that soil chemical properties vary both between qutans and within individual qutans, primarily due to topography and grazing patterns. The following conclusions can be drawn from the study:
The formation of the organic horizon in summer livestock camps depends on the topography and grazing intensity. Qutans with relatively flat surfaces and varied microtopography favour the accumulation of organic matter from animal excrement, resulting in the formation of a thick organic layer. Qutans with steep slopes, on the other hand, are more susceptible to surface runoff, which can wash away organic matter and, consequently, affect the overall soil chemistry.
Uneven deposition of animal excrements, resulting from the qutan topography and surface runoff, leads to the formation of so-called nutrient ‘hot spots,’ causing pronounced variability in soil chemical properties over relatively small areas within the qutan. Elevated concentrations of nitrogen, organic carbon and phosphorus are typically observed in the central parts of the qutan. In contrast, lower concentrations occur at their margins, which are more exposed to erosion caused by livestock trampling and surface runoff. Consequently, the chemical properties of soils within qutan areas differ significantly from those of soils in even the nearest neighbouring areas, forming so-called nutrient islands.
The chemical characteristics of soil in qutans vary depending on the location and whether the area is used for grazing. In the case of summer livestock camps that have been closed for economic reasons, continuous soil development processes occur. In areas permanently grazed, on the other hand, organic matter from animal excrement accumulates, and soil formation processes are partially inhibited due to the formation of a hard organic crust covering the soil.
Statistical analysis confirmed that TN and TOC are statistically significantly higher in the humus horizon (A) compared with the subsoil horizon (B).
Issues related to soil development within qutan areas and their immediate surroundings are of particular importance in the context of climate warming and carbon sequestration, especially since the qutans in Central Asia occupy extensive areas of mountainous regions.
Acknowledgements
We would like to thank the Reviewers for their careful reading of the manuscript and for their valuable comments and suggestions, which helped us to improve the quality of the paper
Notes
[4] Contributed by Authors’ contributions
Conception and design: OR; Acquisition of data: OR, MS, KPK, BI and ZBI; Analysis and interpretation of data: OR, MS and ZBI; Drafting and/or revision of article: OR, MS and ZBI; Approval of the submitted version for publication: OR, MS, KPK, BI and ZBI.