
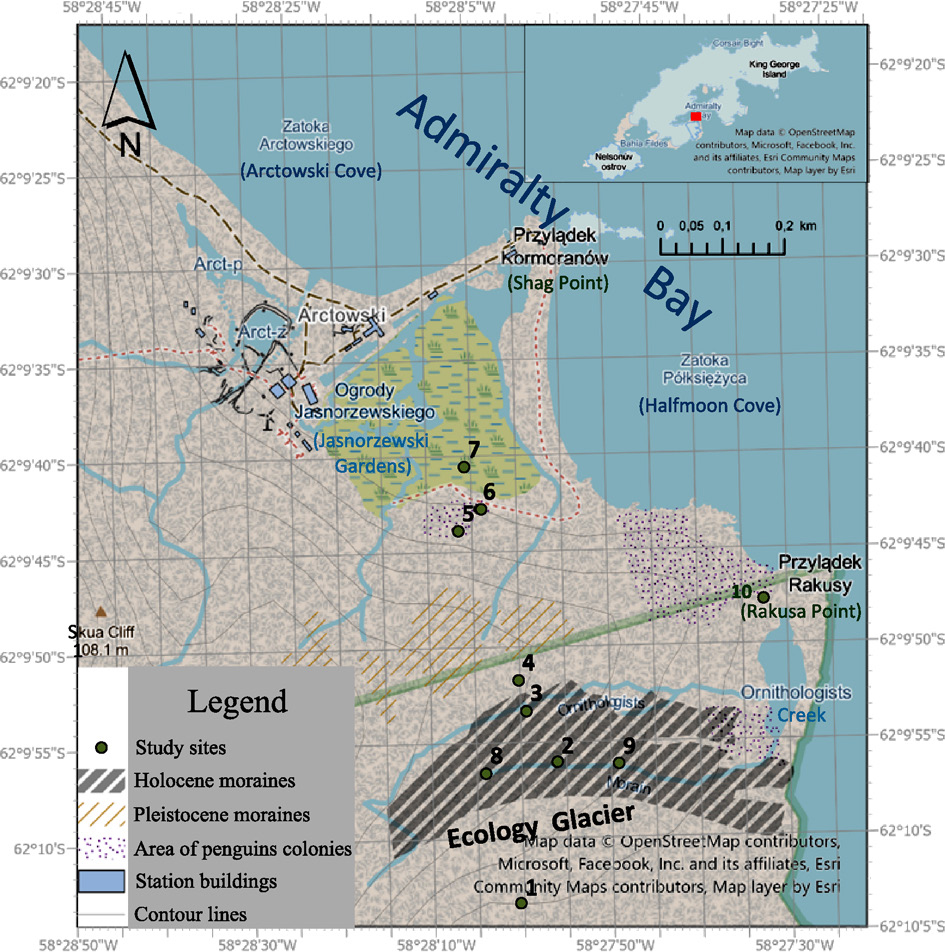
Fig. 1.
Location of study sites in the vicinity of the Arctowski Station (location of topographic features as in 1980s).
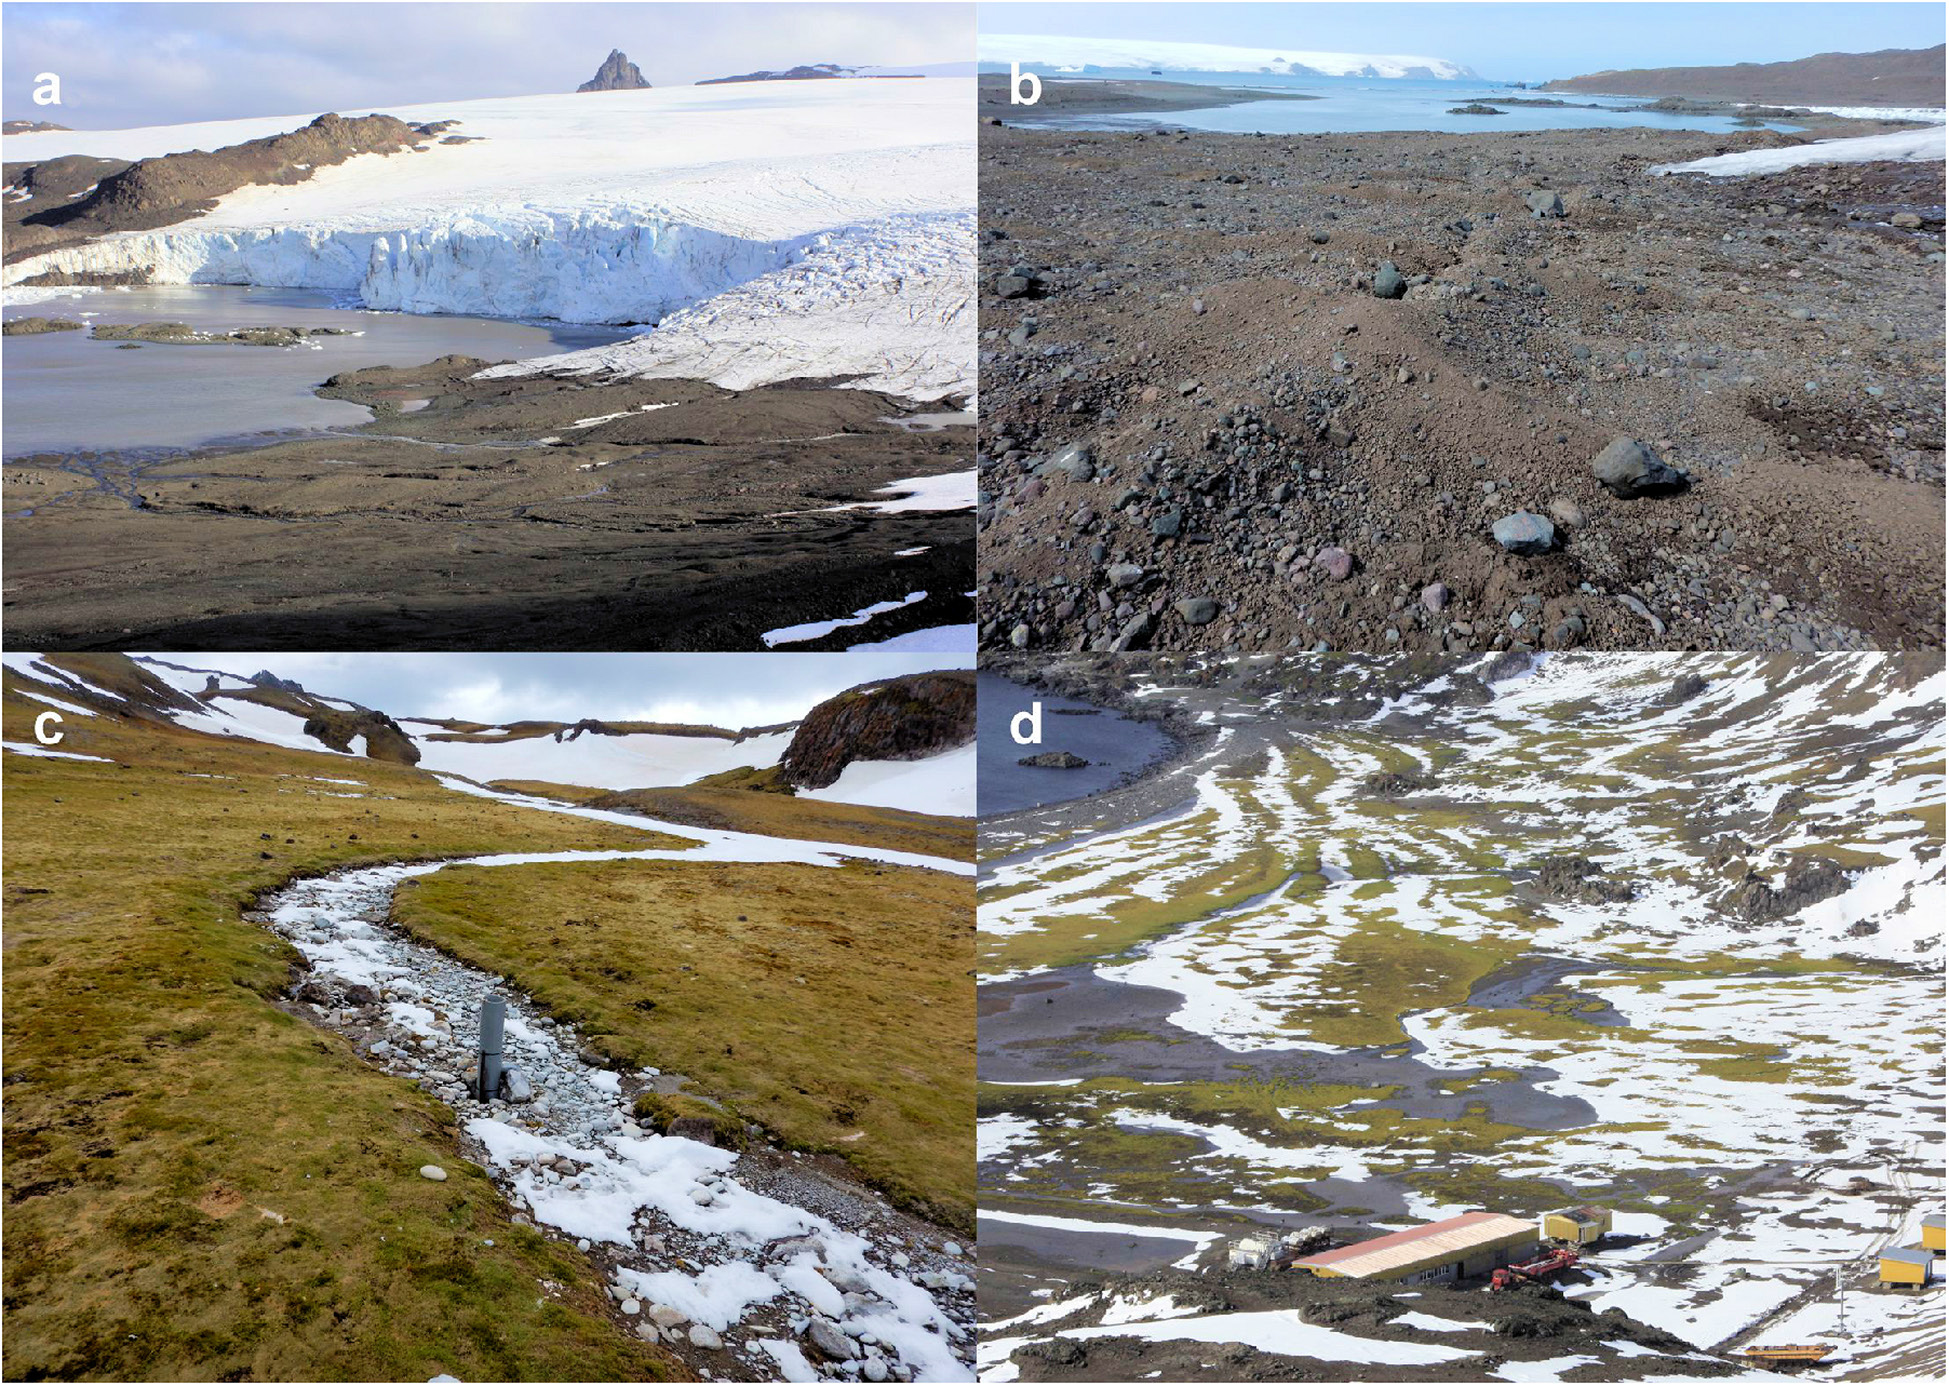
Fig. 2.
Studied sites described in the text, pictures from January 2016: (a) Ecology Glacier ice cliff, part of the land edge and marginal zone; (b) morainic sediments in the marginal zone of Ecology Glacier; (c) the relief and moss-lichen land coverage in the Ornithologists Creek Valley; (d) the Jasnorzewski Gardens moss-lichen marshy meadow.
Table 1.
Description of study sites and codes of investigated soils (according to: IUSS Working Group WRB 2022).
| Study site | Latitude | Longitude | Altitude | Landform | General description | Soil groups with qualifiers |
|---|---|---|---|---|---|---|
| [m a.s.l.] | ||||||
| Site 1 | 62°10'03"S | 58°28'00"W | 47.0 | Snout of Ecology Glacier | 150 m from glacier snout’s terminus | – |
| Site 2 | 62°09'56"S | 58°27'56"W | 30.0 | Terminal moraine | Debris deposited close to the glacier’s terminus | CR-sk.an |
| Site 3 | 62°09'53"S | 58°27'59"W | 48.0 | Older end moraine | Older glacial deposits | CR-cs.an-oh |
| Site 4 | 62°09'5l"S | 58°28'00"W | 42.0 | Valley bottom | Valley formed by fluvial-glacial processes | CR-an-fv.nv |
| Site 5 | 62°09'51"S | 58°28'06"W | 14.0 | Valley slope | Debris of Miocene rocks with ornithogenic soil | CR-dy.gl.oc |
| Site 6 | 62°09'43"S | 58°28'04"W | 7.0 | Alluvial fan | Created by joint action of gravity (talus) and alluvial processes | CR-dy.gl.oc |
| Site 7 | 62°09'42"S | 58°28'05"W | 1.5 | Marine terrace | Marshy coastal meadow of Jasnorzewski Gardens | CR-dy.hu |
| Site 8 | 62°09'56"S | 58°28'04"W | 42.0 | Depression between moraine ridges | Low-lying area located within glacial deposits | CR-sk.an |
| Site 9 | 62°09'56"S | 58°27'49"W | 26.0 | Depression between moraine ridges | Low-lying area located within glacial deposits | CR-sk.an |
| Site 10 | 62°09'48"S | 58°27'34"W | 7.0 | Valley slope | Penguin rookery on Penguin Ridge in the vicinity of Rakusa Point | LP-oc.tu |
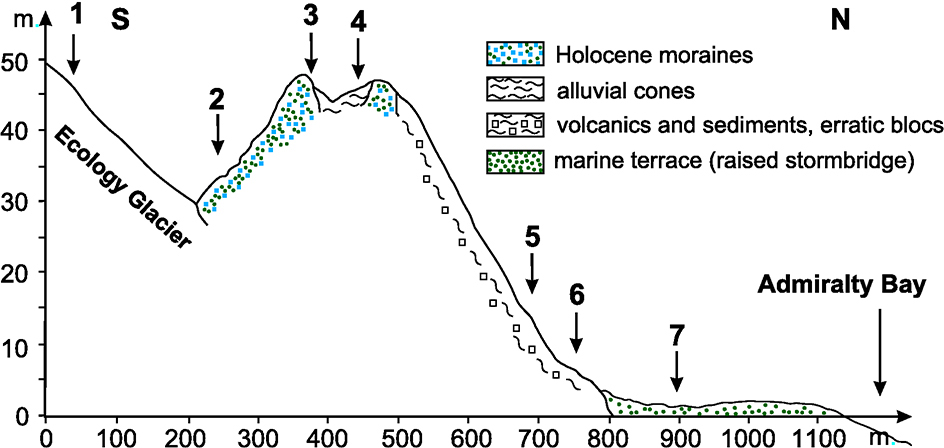
Fig. 3.
Hypsometric profile with basic study sites (1–7).
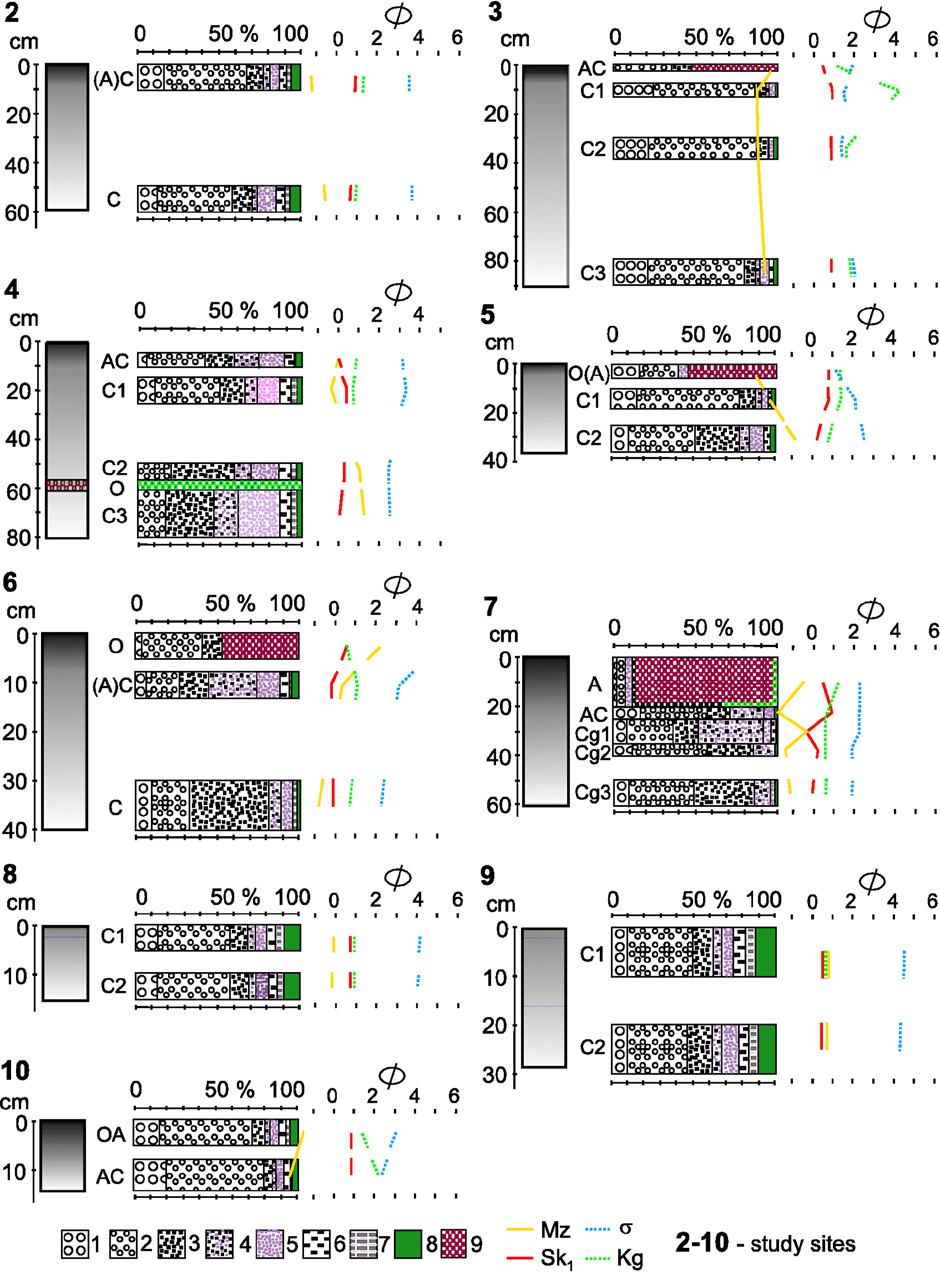
Fig. 4.
Particle size distribution in the studied soils: 1 – coarse gravel, 2 – medium and fine gravel, 3 – coarse sand, 4 – medium sand, 5 – fine sand, 6 – silty sand, 7 – silt 8 – clay, 9 – organic matter; Folk, Ward’s (1957) statistical parameters of grain size: Mz – mean diameter, δ – standard deviation (sorting), Sk1 – skewness, kg – kurtosis.
Table 2.
Selected hydro-physical properties of soils.
| Study site | Sampling depth | Soil horizon | Capillary water capacity WKW | Actual moisture Wa | Bulk density So | Field water capacity Wp | Specific density Cw |
|---|---|---|---|---|---|---|---|
| [cm] | [%] | [g · cm−3] | [%] | [g · cm−3] | |||
| 2 | 8–13 30–38 | (A)C C | 15.57 9.90 | 12.00 8.13 | 1.72 1.92 | 7.94 7.06 | 2.34 2.59 |
| 4 | 05–10 15–25 50–57 70–80 | AC C1 C2 C2 | 19.10 11.55 27.89 23.72 | 17.84 12.25 19.27 26.34 | 1.57 1.79 1.28 1.43 | 11.30 9.51 13.43 9.80 | 2.63 2.57 2.50 2.19 |
| 7 | 20–25 25–35 50–60 | AC Cg1 Cg3 | 28.04 20.07 21.08 | 8.67 10.34 15.80 | 1.40 1.67 1.68 | 6.00 5.17 6.20 | 2.90 2.64 2.95 |
| 8 | 0–50 10–15 | C1 C2 | 14.80 15.40 | 11.50 11.30 | 1.73 1.78 | 7.84 7.60 | 2.40 2.41 |
| 9 | 0–10 20–30 | C1 C2 | 15.30 13.90 | 12.00 11.70 | 1.77 1.81 | 7.90 7.42 | 2.47 2.46 |
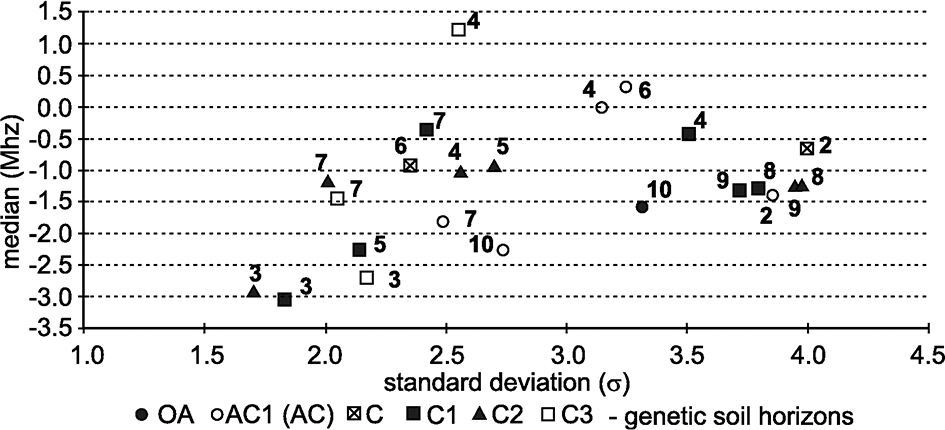
Fig. 5.
Genetic groups of sediments of the western coast of Admiralty Bay.
Table 3.
Main physico-chemical properties of soils.
| Study site | Sampling depth | Soil horizon | Colour according to Munsell1 | PH | Corg | Ntotal | C/N | |
|---|---|---|---|---|---|---|---|---|
| [cm] | H2O | KCl | [% | |||||
| 2 | 0–10 50–60 | (A)C C | 5YR 3/2 5YR 3/2 | 8.3 8.8 | 6.6 7.1 | 0.40 0.43 | 0.014 0.016 | 28.6 26.7 |
| 3 | 0–2 08–13 30–38 80–90 | AC C1 C2 C3 | 5YR 3/2 5YR 3/2 5YR 3/2 5YR 3/2 | 6.2 5.9 7.8 7.7 | 4.0 3.8 6.1 6.2 | 1.14 0.41 0.27 0.37 | 0.115 0.029 0.014 0.011 | 9.9 14.0 19.2 33.9 |
| 4 | 0–3 05–10 15–25 50–57 59–61 70–80 | O AC C1 C2 O C3 | 5YR 4/4 5YR 2.5/2 5YR 3/2 5YR 3/3 5YR 4/4 5YR 3/2 | 5.0 5.7 6.1 6.3 6.7 6.6 | 3.7 3.6 4.3 4.5 5.1 4.8 | 9.58 1.90 1.60 0.53 7.40 0.60 | 0.395 0.192 0.182 0.193 0.359 0.036 | 24.2 9.9 8.8 2.7 20.6 16.7 |
| 5 | 0–5 10–18 25–35 | O(A) C1 C2 | 5YR 3/4 7.5YR 7/2 5YR 4/6 | 3.8 4.4 3.9 | 3.1 3.2 2.5 | 15.92 1.83 1.78 | 1.603 0.613 0.366 | 9.9 3.0 3.2 |
| 6 | 0–5 08–13 30–40 | O (A)C C | 10YR 2/2 10YR 3/1 10YR 2/1 | 7.3 4.9 4.4 | 6.7 3.6 2.9 | 5.13 3.51 0.77 | 1.903 0.564 0.082 | 2.7 6.2 9.3 |
| 7 | 00–20 20–25 25–35 35–40 50–60 | A AC Cg1 Cg2 Cg3 | 10YR 3/2 10YR 2.5/1 10YR 2.5/1 10YR 2.5/1 10YR 2.5/1 | 5.6 5.0 4.8 5.2 5.3 | 3.8 3.1 3.3 3.7 3.7 | 8.26 0.53 0.32 0.21 0.38 | 0.850 0.086 0.041 0.026 0.030 | 9.7 6.2 7.8 8.2 12.7 |
| 8 | 0–5 10–15 | C1 C2 | 5YR 3/2 5YR 3/2 | 8.6 8.8 | 7.0 7.1 | 0.41 0.42 | 0.015 0.015 | 27.3 28.0 |
| 9 | 0–10 20–30 | C1 C2 | 5YR 3/2 5YR 3/2 | 8.7 8.8 | 7.1 7.1 | 0.43 0.41 | 0.016 0.015 | 28.7 27.3 |
| 10 | 0–5 8–14 | OA AC | 10YR 2/1 10YR 2/3 | 7.1 6.8 | 6.9 6.6 | 4.26 5.06 | 2.755 2.635 | 1.5 1.9 |
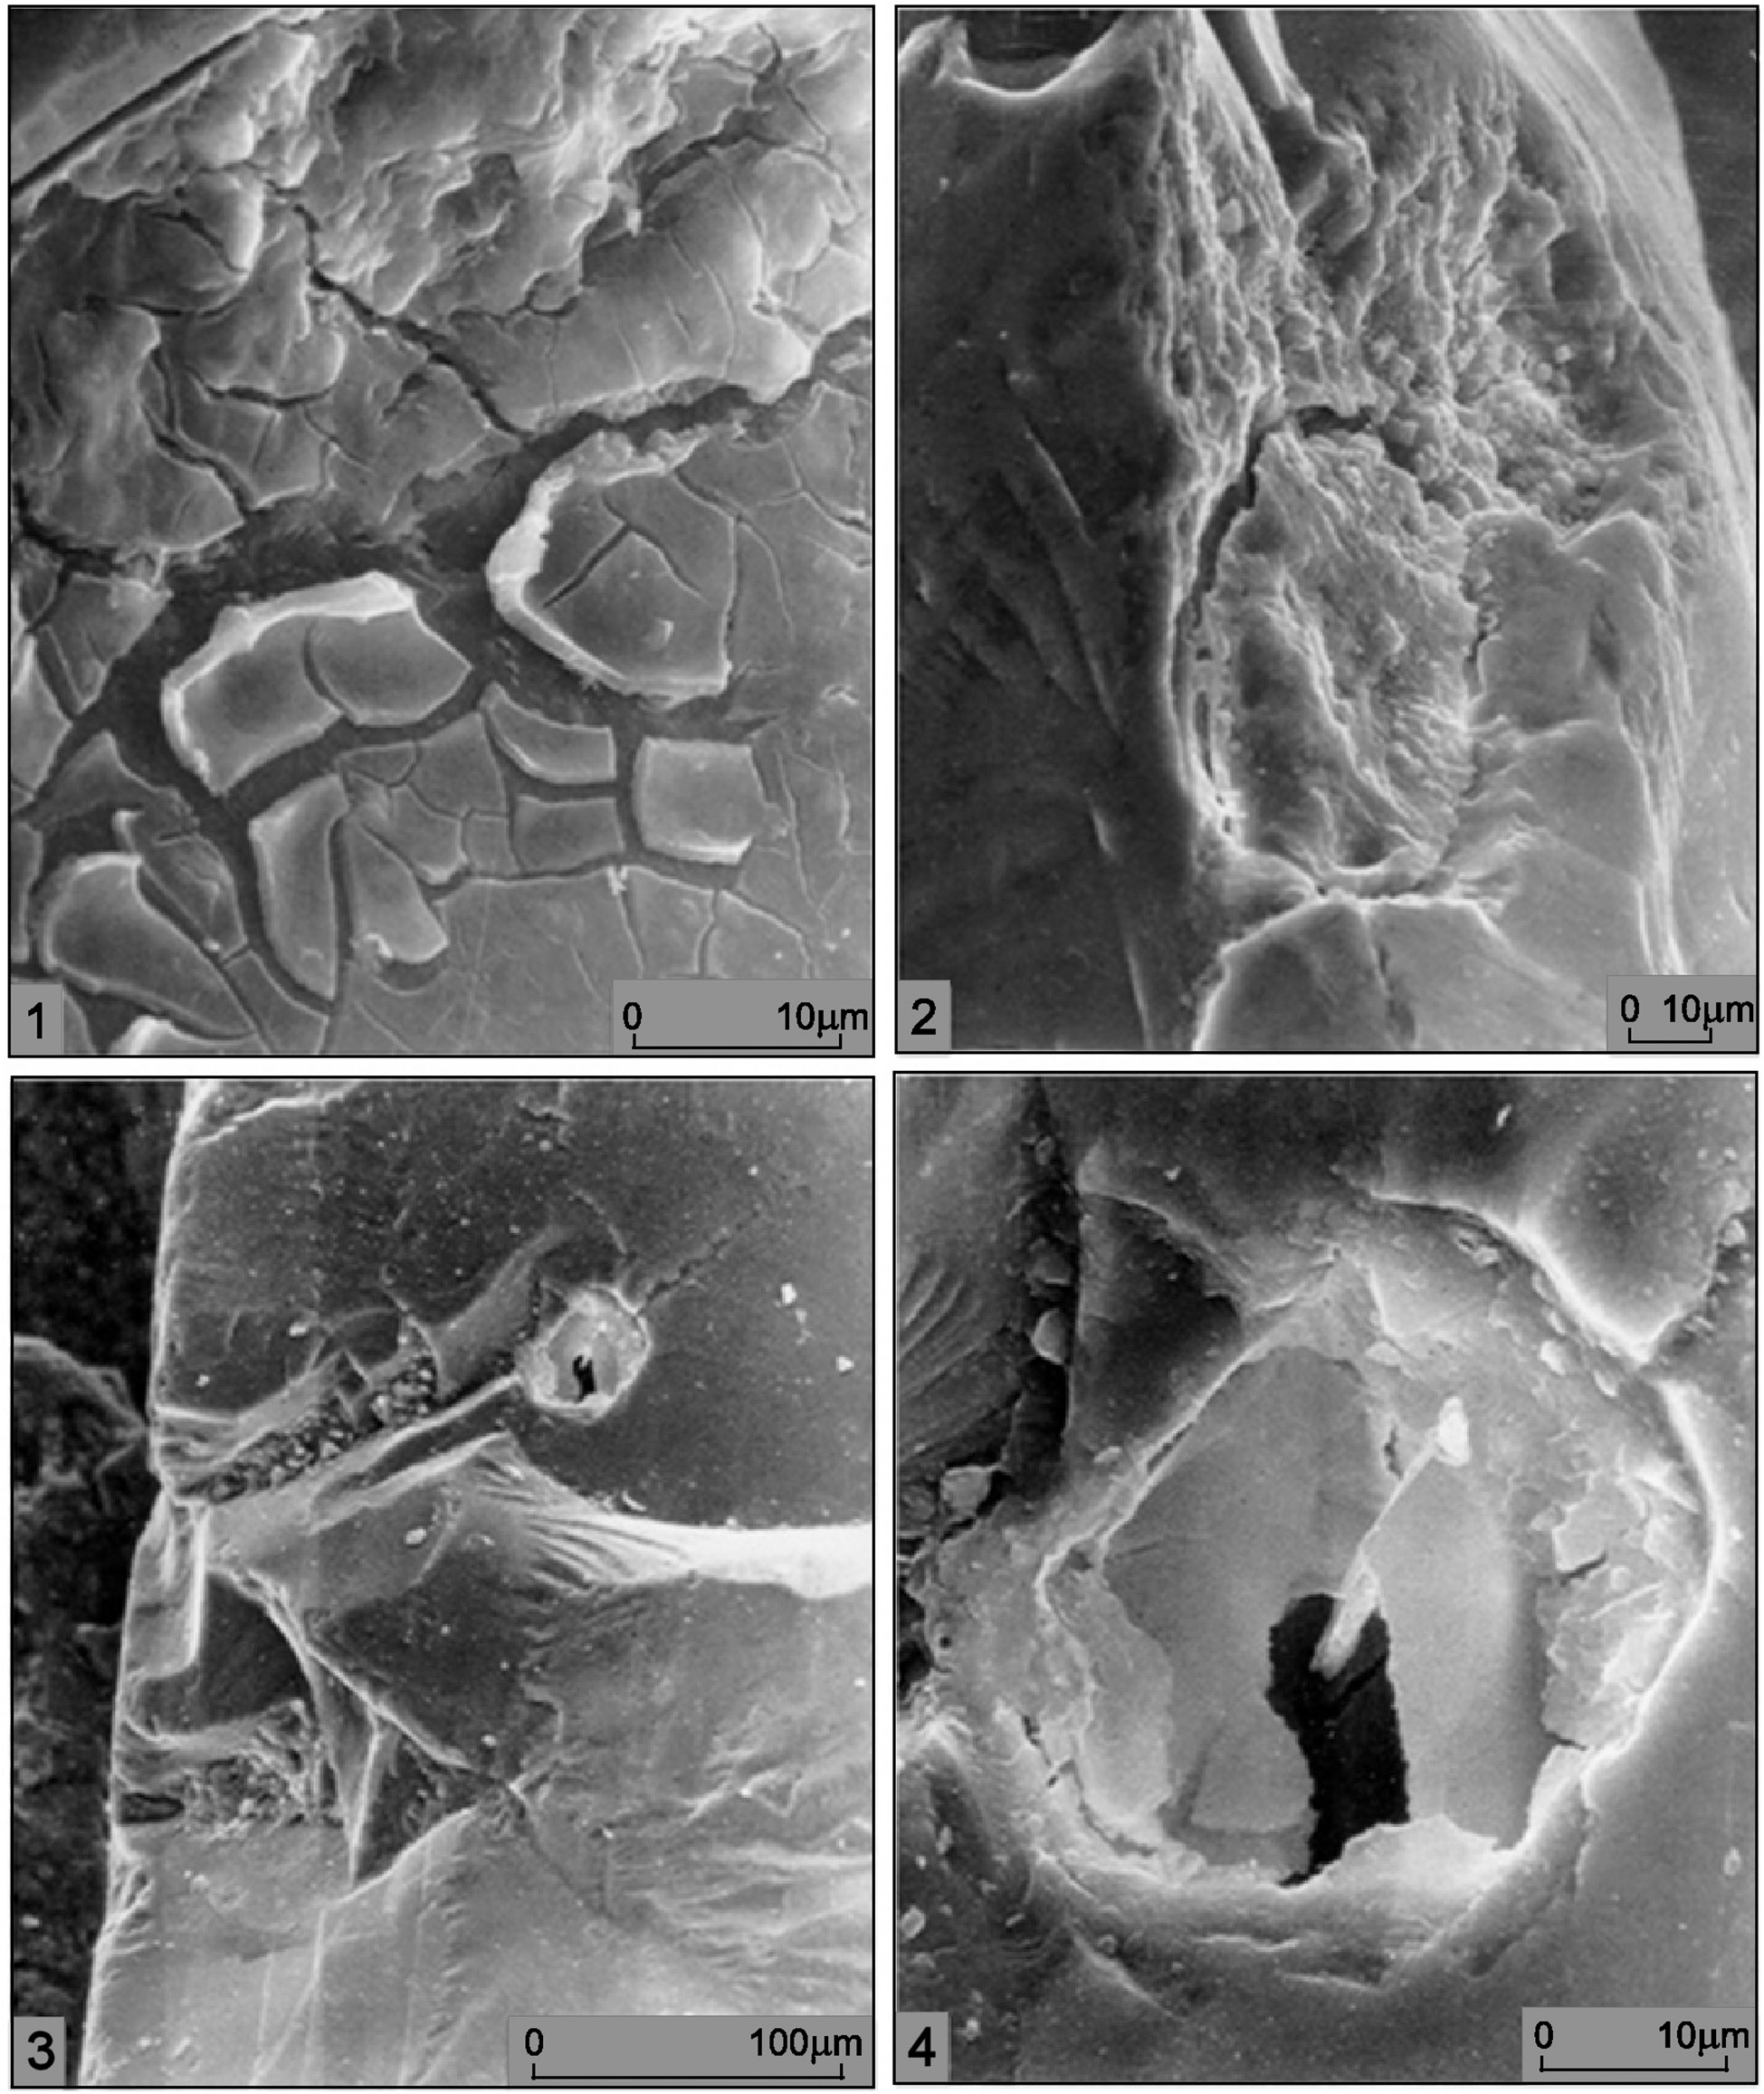
Fig. 6.
Electron microscope images of soil grain surfaces: 1 – Fractures and exfoliation of a probable siliceous crust on a grain, resulting from cryohydrothermic weathering (site 3, depth 8–13 cm). 2 – Fractures and microslits initiating frost disintegration and exfoliation of a grain (site 6, depth 8–13 cm). 3 – Traces of physical (chipped spot surface, mechanical cuts) and chemical selective decay (cavern) on a grain; sample from a penguin field. 4 – Cavern of chemical decay.
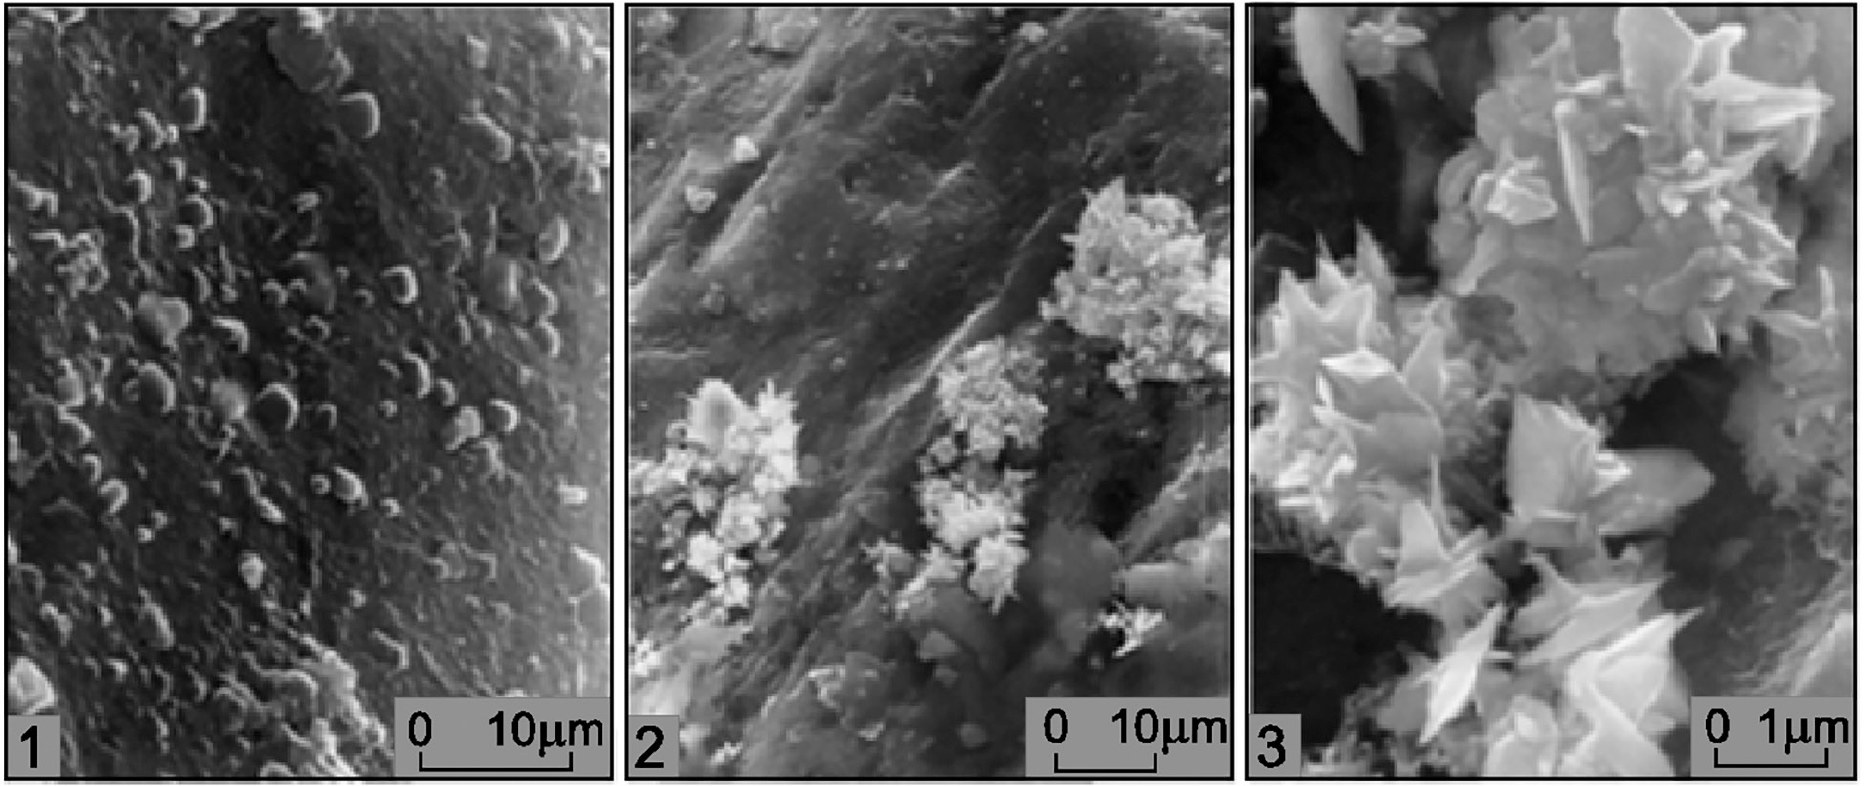
Fig. 7.
Electron microscope images of post-sedimentary features in soils: 1 – Crystallisation of secondary minerals on a quartz grain; sample from a penguin field, depth 0–5 cm. 2 & 3 – Concentration of crystals on a grain, formed as products of reaction between strongly mineralised water solution and soil silica (site 6, depth 8–13 cm).
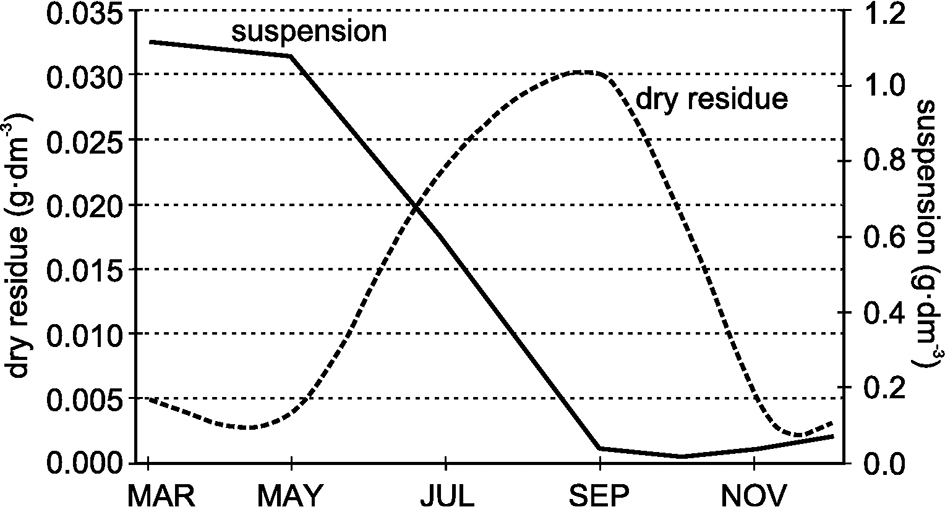
Fig. 8.
Dynamics in variation of dry residue and suspended matter from meltwater of the Ecology Glacier, King George Island.