
Environmental monitoring plays a crucial role in assessing the state of the environment (Lovett et al. 2007, Likens, Lindenmayer 2018). Systematic environmental monitoring provides continuous or periodic measurements of various environmental factors (Kostrzewski, Majewski 2018, 2021). Environmental monitoring can be conducted through specialised programmes, such as hydrological and meteorological monitoring. However, it is advantageous to adopt an integrated approach that incorporates multiple dimensions of environmental assessment to gain a thorough understanding of environmental conditions. One such comprehensive approach is the Integrated Monitoring of the Natural Environment (ZMŚP), a subsystem of the State Environmental Monitoring Programme in Poland (Kostrzewski 1993, Kostrzewski et al. 1995, Kostrzewski, Majewski 2021). The primary objective of ZMŚP is to collect data systematically and continuously from monitored geoecosystems in river and lake catchments at different spatial and temporal scales, relying on focused stationary studies (Kostrzewski 1993, Kostrzewski et al. 1995, Kostrzewski, Majewski 2021). In terms of organisation and the implementation of measurement systems, ZMŚP aligns with the European ICP Integrated Monitoring programme (ICP IM – International Co-operative Programme on Integrated Monitoring of Air Pollution Effects). This initiative fulfils the obligations outlined in the Convention on Long-range Transboundary Air Pollution (CLRTAP). The ICP IM programme aims to assess the current state and forecast longterm changes in terrestrial and freshwater ecosystems, with a particular focus on the effects of air pollution, including nitrogen and sulphur compounds, as well as climate change (Johansson et al. 1990). Currently, the ICP IM measurement network comprises 48 active monitoring stations reporting results across 15 countries (30th Annual Report 2021). Since 2016, nine ZMŚP monitoring stations have been incorporated into the ICP IM measurement system, which requires the reporting of measurement data annually to the IM programme headquarters, known as the Programme Centre, based at the Swedish University of Agricultural Sciences (SLU).
The ZMŚP programme comprises a network of 12 monitoring stations (hereafter referred to as stations) situated in various landscape zones throughout Poland. The ZMŚP includes 17 programmes that collect data on nearly all natural environment components within the studied catchments. This includes both abiotic and biotic elements recorded over various time scales. Some parameters, such as meteorological and selected hydrological measurements, are gathered continuously. Other assessments are conducted over medium-term periods, ranging from 1 month to 1 year, while hydrobiological evaluations of rivers, studies on invasive species and soil analyses are performed infrequently, typically every few years. Most programmes are divided into two measurement ranges: basic and extended monitoring. Basic monitoring is mandatory for all stations, while extended monitoring provides optional parameters. In total, 425 measurement parameters are recorded within the ZMŚP, of which 239 are required for all stations as obligatory parameters (Kostrzewski, Majewski 2021). The ZMŚP programme has already accumulated 1.2 million monitoring records, with an additional 120,000 records added annually. The available measurement series for specific stations includes research conducted since 1994.
In recent years, the volume of available data has increased dramatically due to the development of various systems that automatically record hydrological and meteorological parameters in real-time, along with remote sensing data (Bollen et al. 2022). The European Water Framework Directive (Directive 2000/60/EC) emphasises the need for operational tools to facilitate the interpretation of data collected through environmental monitoring. Such tools include a data repository that utilises various database management systems. The primary purpose of creating repositories is to collect and process the large volumes of data gathered over time. Examples of global and regional open hydrological databases include WATERBASE – Water Quantity, the Global Runoff Data Centre (GRDC), the Environment Agency Hydrology Data Explorer in the UK, the National Water Data Archive: HYDAT, the USGS Surface Water Data for the Nation (WDFN) and the public data repository of the Polish Institute of Meteorology and Water Management – National Research Institute (IMGW-PIB). The data from these databases can be downloaded directly through the website interface or by using R packages. For example, the climate package (Czernecki et al. 2020) allows users to download data from the public repository of the IMGW-PIB. The dataRetrieval package (De Cicco et al. 2025) is specifically designed for retrieving hydrological data from the U.S. Geological Survey (USGS). Additionally, the tidyhydat package provides access to data from the Water Survey of Canada (Albers 2018).
The potential applications of database systems in processing hydrological monitoring results have been discussed in several studies, including White et al. (2008) on The Tidal Creek Database, Carleton et al. (2005) on The Watershed Monitoring and Analysis Database (WMDA) and Bollen et al. (2022) on the river system of Flanders.
As is pointed out in the literature, a particularly effective method for managing large volumes of monitoring data is Online Analytical Processing (OLAP) systems. In OLAP systems, data is organised in data warehouses based on a multidimensional data model, enabling advanced analyses, including filtering, sorting and multilevel data grouping. In implementations where data is stored in relational database structures, the Relational Online Analytical Processing (ROLAP) model is used, where multidimensional analysis is performed using structured query language (SQL) queries based on fact tables and dimensions (Boulil et al. 2014). The application of OLAP systems in analysing environmental data is explored in the works of McGuire et al. (2008) and Berrahou et al. (2015) in the context of river system ecology and Pinet et al. (2010) and Boulil et al. (2014) regarding river quality monitoring implemented under the Water Framework Directive.
Data collection is only one aspect of environmental monitoring. In addition to data collection, the analysis and presentation of the gathered information play a crucial role. Monitoring data is often summarised in reports that evaluate the state of the environment (Kostrzewski et al. 2011, Tylkowski et al. 2017). For instance, each ZMŚP station prepares annual reports based on data collected during a specific hydrological year. These reports follow a standardised template applicable to all stations, allowing for comparability and highlighting regional differences. The ZMŚP data are also utilised at the national level to generate annual assessments regarding the state of monitored geoecosystems in Poland. Additionally, a multi-year series of ZMŚP data has been utilised to create comprehensive synthesis reports (Kostrzewski, Kruszyk 2006, Kostrzewski, Majewski 2018). The primary goal of environmental reports is to accurately present the results, accompanied by clear and concise interpretations. Environmental reports are essential for government administrations, local government units and non-governmental organisations, providing critical information for data-driven decision-making. This is vital for effective natural resource management, environmental protection and the development of crisis management strategies. Furthermore, environmental reports play a significant role in educating the public about the state of the natural environment, thus contributing to increased ecological awareness. To improve the comparability of findings across various levels (local, regional and global), reports should be developed using standardised methodologies for data collection and analysis. Standardised reports facilitate the analysis of trends and relationships over time and across different locations. In the development of environmental reports, the effective presentation and visualisation of data are critical components that significantly enhance the clarity and impact of the findings. Currently, the reports are typically generated using basic software such as Microsoft Excel, which allows for the creation of simple charts. A more modern approach involves using programming languages such as R. The R computational environment provides various tools for data processing, analysis and presentation, along with several packages specifically designed for hydrological data. It offers resources for retrieving hydrological data (such as climate, dataRetrieval and tidyhydat), analysing data (including fasstr, Goetz, Schwarz 2024) and modelling hydrological data (such as hydroTSM, Zambrano-Bigiarini 2024). Utilising R Markdown alongside visualisation packages such as ggplot2 and plotly for interactive plots allows for automating the reporting process. Additionally, integrating PostgreSQL with R, instead of relying on graphical user interface tools such as MS Excel, ensures the reproducibility of reports by fully documenting both the processing steps and the creation of outputs. The purpose of this paper is to demonstrate the potential of using open-source tools, such as PostgreSQL and R, to collect, process and publish monitoring data results in the form of standardised, interactive reports. This is illustrated using hydrological monitoring data collected from the measurement programme ‘H1 – Surface Waters – Rivers’ conducted at the Parsęta Base Station as part of the ZMŚP initiative.
Figure 1 illustrates the main components of our framework designed to collect, process and publish multi-year daily hydrological monitoring data gathered through the ZMŚP programme. The core of the ZMŚP programme’s IT system is a relational database that runs on PostgreSQL version 16.6, operating on a 64-bit architecture and featuring a PostGIS extension for managing spatial data. PostgreSQL is one of the most widely used environmental database management systems (Gebhardt et al. 2010, Boulil et al. 2014, Berrahou et al. 2015, Bollen et al. 2022). This advanced database server is available under an open-source licence and has been actively developed for over 30 years under the PostgreSQL Global Development Group. PostgreSQL provides a comprehensive set of functionalities for data collection, archiving, verification and aggregation. These capabilities are further enhanced by the use of the R computational environment, which provides tools for data analysis and visualisation (R Core Team 2024) and allows for automating data reporting.
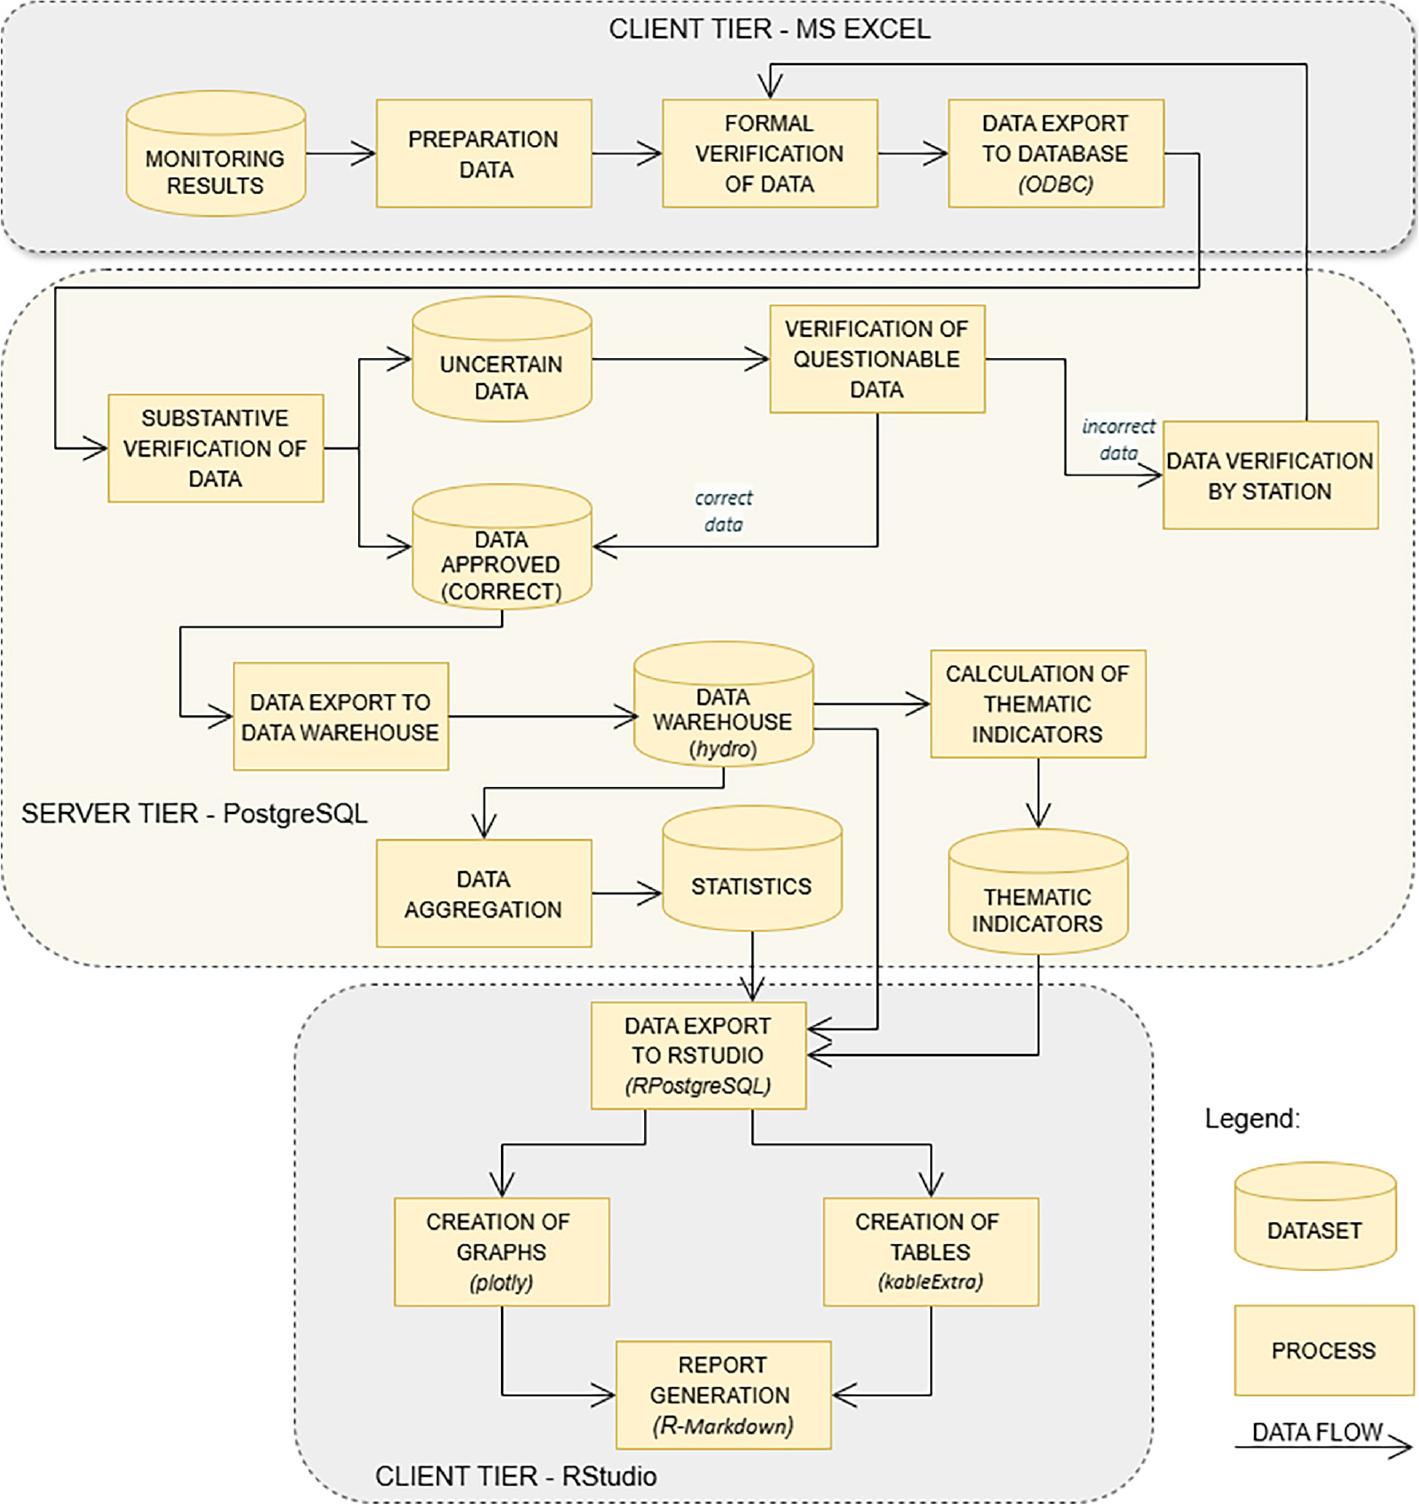
Diagram illustrates the structure of the framework for processing and reporting hydrological monitoring data.
The most essential resource in the database is the data collected through the H1 – surface water ZMŚP programme. Its primary objective is to improve our understanding of the water cycle, which plays a key role in the migration of elements within the studied catchments (Kostrzewski et al. 1995, 2016, Kijowska, Bochenek 2011, Kejna, Strzyżewski 2014, Vuorenmaa et al. 2018, Lenartowicz 2021). Runoff formation results from the interplay between water input, retention, subsurface inflow, evapotranspiration and surface runoff processes (Lenartowicz 2021). Understanding water circulation dynamics at the catchment scale is crucial for comprehending how geoecosystems operate. In this context, discharge measurements are particularly significant, as they form the basis for calculating the catchment water balance – a topic of growing importance in light of recent water shortages.
For instance, hydrological monitoring provides data on discharge and water levels, while meteorological monitoring includes parameters such as temperature and precipitation. Although these variables are measured continuously, the database stores daily aggregated values. Data are entered annually by monitoring stations using a dedicated Microsoft Excel plugin. To access the database, users must install an ODBC driver for the PostgreSQL system and configure the appropriate connection parameters.
Along with monitoring data, important resources also include information about the measurement network. This encompasses basic data on river and lake catchments, monitoring stations, sites and associated institutions such as scientific units and national parks, including laboratories. Each catchment is described by a set of essential reference data, which includes a unique identifier, name, type and boundaries of the catchment. Additionally, it identifies its landscape class and location within the context of the division into physico-geographic regions (Solon et al. 2018). This information is further supplemented by land cover and land use data, following the classification system used in the CORINE Land Cover database at level three. Furthermore, several indicators have been calculated for each catchment, describing its geometric, morphometric, geomorphological and hydrographic features. All changes in the measurement system – such as the transition from manual measurements to automatic registration, which may impact the interpretation of results – are also archived. Information concerning the ZMŚP measurement network is enhanced by the range of measurements conducted. For each measured parameter, the following details are provided: code, unit of measurement, frequency of measurements and coding rules for recording results in the database.
A key step in archiving monitoring results in the database is the verification process, which aims to identify and eliminate errors that may occur during field research, processing the measurement results and data entry into the database. Data verification is a crucial part of the quality assurance/quality control (QA/QC) system, essential for the credibility of reports, syntheses and modelling results. Control at the database level includes the following stages: formal verification, substantive verification and verification of questionable values.
Formal verification occurs when data are entered into the database by monitoring stations using a plugin in MS Excel. Formal verification focuses on the structure of the transferred data, which includes aspects such as the order of columns, data types, codes used and documentation of required parameters. Monitoring results are compared with reference values defined by the ZMŚP Expert Team. This comparison helps identify obvious errors that may have occurred during data preparation for transfer. The verification procedure also checks for duplicates at both the spreadsheet and database levels. The outcome of formal control is the identification of incorrect data. For these errors to be recorded in the database, the station must either correct them or, if correction is not feasible, flag the incorrect result. Flagged values are entered into the database but excluded from statistical analysis and thematic indicators calculations.
Substantive verification, the second phase of control, occurs at the system administrator level and is executed on the server side using SQL and PL/pgSQL procedures (Kruszyk 2023). Various procedures are employed during this phase, including commonly used methods for verifying the accuracy of physicochemical and chemical properties (such as ion balance, conductivity tests and selected ion ratios), as well as examining the relationships between the distributions of specific measurement parameters and identifying outliers. Outlier detection is particularly relevant for meteorological and hydrological parameters. Typical statistical tests used at this stage include the 3-sigma test, Hampel test, extreme value range and quartile test (Budka et al. 2013). The quartile test enables the detection of a significant number of atypical observations (Budka et al. 2013). This phase examines both individual measurement results and aggregated data, such as monthly precipitation or mean annual discharge. Multiyear averages based on data collected from the database are used as reference data. As a result of substantive verification, measurement results are classified as approved values or marked as questionable if the control indicates uncertainty. For aggregated data, the entire measurement series may be classified as questionable.
Verification of questionable values, the final stage of data control focuses on classifying questionable values as either incorrect or acceptable for inclusion as approved (correct) data. This process involves a thorough analysis of control results, graphical analysis (e.g. a summary of flow versus precipitation distribution) and comparison of the controlled results with multi-year statistics. The final decision to classify questionable values as erroneous or correct data is made by the station (possibly the database administrator) in consultation with the ZMŚP expert. The station plays a key role in the process of verifying questionable values. It has information on the occurrence of above-average and extreme phenomena in the catchment area and on measurement system failures.
After the verification process, the measurement results were imported into a thematic hydro data warehouse. Data are retrieved directly from a relational database. The implementation of the warehouse was based on the ROLAP model, which enables the storage of multidimensional data in relational structures, including fact tables and dimension tables. A star schema was adopted, in which the central fact table is directly linked to multiple dimension tables. The facts are individual events subject to analysis and are described by appropriate measures, which in this case include daily flow values and total precipitation. The table of facts has been linked to tables of dimensions representing the time and location of the measurement station, respectively. Based on the data collected in the hydro warehouse, a series of aggregate values were calculated for different time scales: month, winter and summer half-year, hydrological year and multi-year. These were basic statistics: minimum and maximum values, arithmetic mean, sum, percentiles and standard deviation. PostgreSQL supports multi-level grouping, used in data warehouses, as well as analytical functions, including reporting, ranking and window functions. These functions enable the calculation of thematic indicators. Examples of hydrological parameters calculated based on discharge values are in Table 1. These include specific discharge, runoff depth, runoff coefficient, monthly discharge coefficient and discharge characteristics. Aggregated data were supplemented with metadata. This information includes the number of valid data records within, for example, an annual series, the completeness of the series, the range of years in the case of multi-year statistics and the type of source data used in the aggregation process. In the case of physicochemical and chemical data, the series metadata has been extended to include the analytical methods used and laboratory identifiers.
Summary of thematic indicators for hydrological data with formulas according to Bajkiewicz-Grabowska et al. (1993) and Ozga-Zielinska, Brzezinski (1997).
| Parameters | Description | Formula |
|---|---|---|
| Q | Discharge in cubic meters per second | |
| P | Precipitation in millimetres | |
| NQ, SQ, WQ | Minimum (NQ), mean (SQ) and maximum (WQ) values calculated based on daily discharge (Q) | |
| AQ | Relative amplitude of discharge | |
| Long-term discharge characteristics | ||
| WNQ, WSQ, WWQ | Maximum extreme discharges are the highest values calculated using annual NQ, SQ and WQ values. | |
| NNQ, NSQ, NWQ | Minimum extreme discharges are the lowest values calculated, respectively, using annual NQ, SQ and WQ values. | |
| SNQ, SSQ, SWQ | Mean discharge is the mean value calculated using annual NQ, SQ and WQ values. | |
| Hydrological parameters | ||
| q | Specific discharge is a discharge of water per unit area of a drainage basin expressed in litre per second per square kilometres. | |
| O | Runoff depth is calculated as the runoff volume from a drainage basin divided by its area in a specific time, and is expressed in millimetres. | |
| a | Runoff coefficient is the ratio of runoff depth to precipitation depth. | |
| k | Monthly discharge coefficient, k > 1 indicates months with the mean discharge (SQ) above the annual mean discharge calculated for the multi-year period, whereas k < 1 shows the months with mean discharge (SQ) below the annual mean discharge calculated for the multi-year period. | |
| Flow level categories | ||
| HH | High above normal | Q ≥ SWQ |
| HM | Above normal | SWQ ≥ Q ≥ NWQ |
| NF | Normal flow | |
| LM | Below normal | SNQ ≤ Q ≤ 0.5 · (NSQ + WNQ) |
| LL | Low below normal | Q ≤ SNQ |
For more advanced analysis and visualisations, the database capabilities can be enhanced using the R computational environment, in conjunction with the RStudio Integrated Development Environment (IDE). We utilise R and R Markdown to automate the reporting of hydrological monitoring data, producing an interactive HTML document. Our framework uses several R packages, including RPostgreSQL (Conway et al. 2025), plotly (Sievert 2020), kableExtra (Zhu 2024), along with tidyverse (Wickham et al. 2019) and the knitr package (Xie 2015). The framework consists of four main steps: (1) reading data from PostgreSQL into R, (2) pre-processing the data into the format required for generating plots and tables to be included in the final report, (3) creating interactive figures and (4) producing an interactive HTML document that serves as the report.
In the first step, we read data directly from PostgreSQL into R using the RPostgreSQL package. This package provides a DBI-compliant driver that enables R to connect with PostgreSQL database systems. Once connected, we can read data directly into R data frames, allowing for further processing, analysis and visualisation. In the second step, we pre-process the data from PostgreSQL to suit the requirements for generating plots and tables. During the third step, we employ the plotly package, which creates interactive web graphics by interfacing with the javaScript library ‘plotly.js’ (MIT-licenced). This package allows for the generation of interactive web graphics directly from ggplot2 graphs (Wickham 2016). However, to achieve optimal formatting and to facilitate the integration of multiple plots into a single graphic, we chose to use the interface based on ‘plotly.js’ rather than the ggplot2 library. In the fourth step, our R-based framework generates a report presented as an interactive HTML document, utilising the data prepared in the ZMŚP database. The output comprises 10 figures and 3 tables. To generate the final report, we utilise the R Markdown language, which enables the combination of code, results and commentary to create dynamic and fully reproducible documents (Xie et al. 2018). Additionally, we use the kableExtra package to format tables within HTML documents.
The following section presents a case study that demonstrates the applicability of our framework, as illustrated in Figure 1. Our framework can be reproduced using the provided R code and sample data, which serve as supporting materials for this paper.
We utilise the framework shown in Figure 1 to generate a report for the upper Parsęta catchment. Parsęta is one of the monitoring stations in the ZMŚP network, with data dating back to 1994. Our analysis covers a multi-year series of data from 1994 to 2024, describing changes in hydrological conditions. The complete report is included in the supplementary material. Below, we present a brief report based on several examples generated by our framework.
The upper Parsęta catchment is a young glacial geoecosystem situated within the Drawsko Lakeland mesoregion (Fig. 2, Solon et al. 2018). It was shaped during the deglaciation of the Pomeranian phase of the Vistulian glaciation (Marks 2005, Mazurek et al. 2024). Hydrological monitoring in this area is conducted as part of the ZMŚP Programme by the Geoecological Station of Adam Mickiewicz University in Storkowo. The primary conditions influencing the hydrological cycle in the upper Parsęta catchment stem from its location in Poland’s moderate climate zone, its geological framework – particularly the type and distribution of glacial and fluvioglacial deposits – and its topography, which includes landforms of glacial, postglacial and Holocene origin, as well as human-induced changes and various landuse types (Kostrzewski et al. 1994). Covering an area of 74 km2, the catchment features significant morphological and lithological diversity, which promotes groundwater retention and stable runoff. The Parsęta maintains a largely natural character, with a hydrographic network density of 1.1 km · km−2.
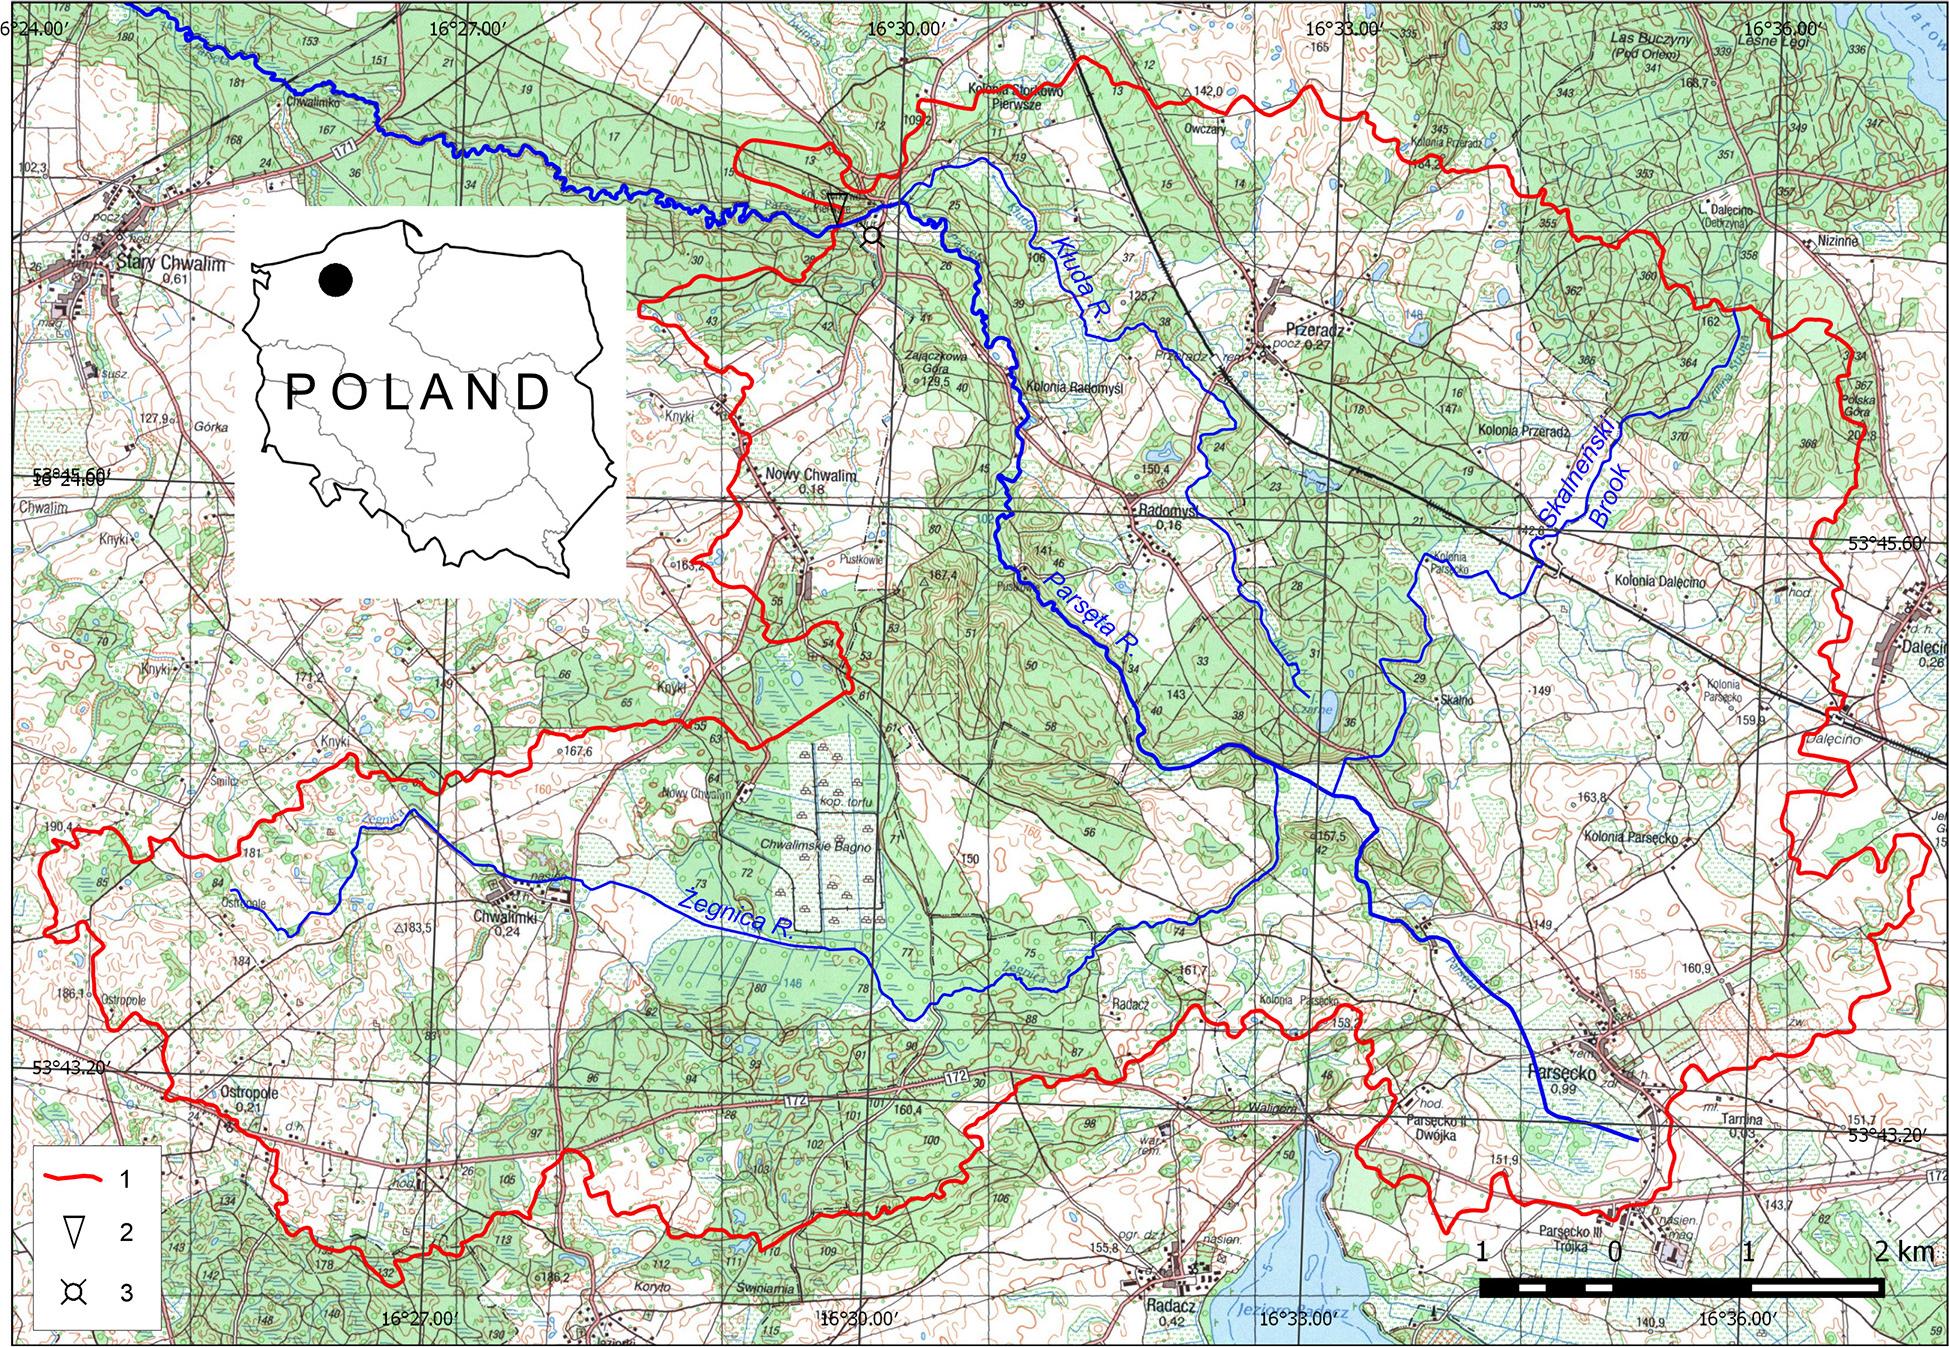
Upper Parsęta catchment.
1 – watershed of the upper Parsęta catchment, 2 – the hydrometric station closing the upper Parsęta catchment, 3 – meteorological station.
The landscape consists of terminal and kame moraine hills, outwash plains, kettle holes and river valleys of polygenetic origin (Mazurek 2011, Szpikowski et al. 2018). The average surface slope of the catchment is 8.4‰. The surface deposits are primarily composed of sandy gravels and clays, with dominant soil types including luvisols, cambisols, podzolic soils, as well as peaty and mucky soils (Mocek 1994). This configuration enhances both infiltration and subsurface retention. The catchment exhibits a mosaic pattern of land use, with 43.4% of the area comprising arable land (mostly located on moraines and kames), 34.6% forested (found on sandurs and depressions) and 15.4% consisting of grasslands, primarily situated in depressions and valley bottoms. According to Dynowska’s (1997) classification, the upper Parsęta displays a moderately developed nival regime, where the average spring month discharge ranges from 130% to 180% of the annual mean discharge. This regime is typical for rivers in northwestern Poland, where groundwater recharge contributes 60%–80% to the total flow (Wrzesiński 2018). Consequently, the catchment demonstrates a relatively low discharge variability coefficient, averaging 0.53; in 2024, this value was slightly higher at 0.56. Hydrologically, the catchment is representative of rivers primarily recharged by groundwater, which ensures discharge stability and limits seasonal fluctuations. Since 1985, discharge has been measured using the area-velocity method, and from 2016 onward, an OTT ADC acoustic current meter has been used. Daily water level readings and periodic velocity measurements form the basis for discharge estimation. Precipitation is recorded daily at a meteorological station located 200 m from the hydrological station.
The hydrological conditions observed in 2024 exhibited notable characteristics that warrant detailed examination. Annual precipitation reached 857.4 mm, exceeding the long-term average (1994–2024) by 164.2 mm. The average discharge for the year was 0.74 m3 · s−1, compared to the multi-year average of 0.59 m3 · s−1.
This combination of high precipitation and increased runoff suggests an efficient transformation of rainfall into discharge, facilitated by significant groundwater recharge and a well-developed retention system within the catchment area. An exceptional aspect of 2024 was the absence of low flow events – one of the few years recorded in this observation period without such occurrences. Most precipitation events during the winter months (November–April) prompted a clear runoff response (Fig. 3), resulting in a winter runoff total of 210.3 mm, nearly double that of the summer (102.7 mm). This distribution helped create a more stable flow pattern in the summer and reduced the risk of occurrences of ‘below-normal’ flow categories. Additionally, the flow regime structure in 2024 was notably distinct – ‘normal’ flows were dominant throughout the year, with ‘above-normal’ flow categories occurring mainly in winter. From March to October, all days experienced ‘normal’ flows, except for a single day (July 29) with ‘above-normal’ flow (Fig. 4B). The entire month of February exhibited ‘above-normal’ flows, apart from one day (February 7), with similar conditions occurring on several days in January, March, November and December. This contrasts sharply with the long-term average (1994–2024), during which ‘below-normal’ flows were recorded in every month, with ‘low below-normal’ flows in nine of those months (Fig. 4A). Viewed from a yearly perspective (Fig. 4C), 2024 resembled only 1997 and 1998, regarding the complete absence of ‘below-normal’ flow categories. The runoff coefficient in 2024 generally aligned with long-term seasonal trends, though significant deviations were observed in March, April, and from August to October (Fig. 5). March exhibited a peak exceeding 1.2, indicating a particularly strong hydrological response to precipitation. In contrast, April showed lower values, likely due to declining soil moisture and increasing evapotranspiration. While summer months typically exhibit lower runoff coefficient values, August, September and October have values comparable to some winter months. This deviation from long-term patterns may reflect localised rainfall and reduced evaporation towards the end of the growing season. Overall, the annual runoff coefficient for 2024 was 0.37, slightly lower than the long-term average of 0.46. The monthly discharge coefficient in 2024 closely mirrored the long-term average for 2000–2024 (Fig. 6), with values exceeding 1 from November to April, peaking at 2.75 in February. From May to October, values remained below 1 – a seasonal pattern typical of oceanic pluvial regimes. Notably, high precipitation in July resulted in a significant rise in the monthly discharge coefficient for that month compared to the long-term average, emphasising the catchment’s sensitivity to rainfall surpluses.
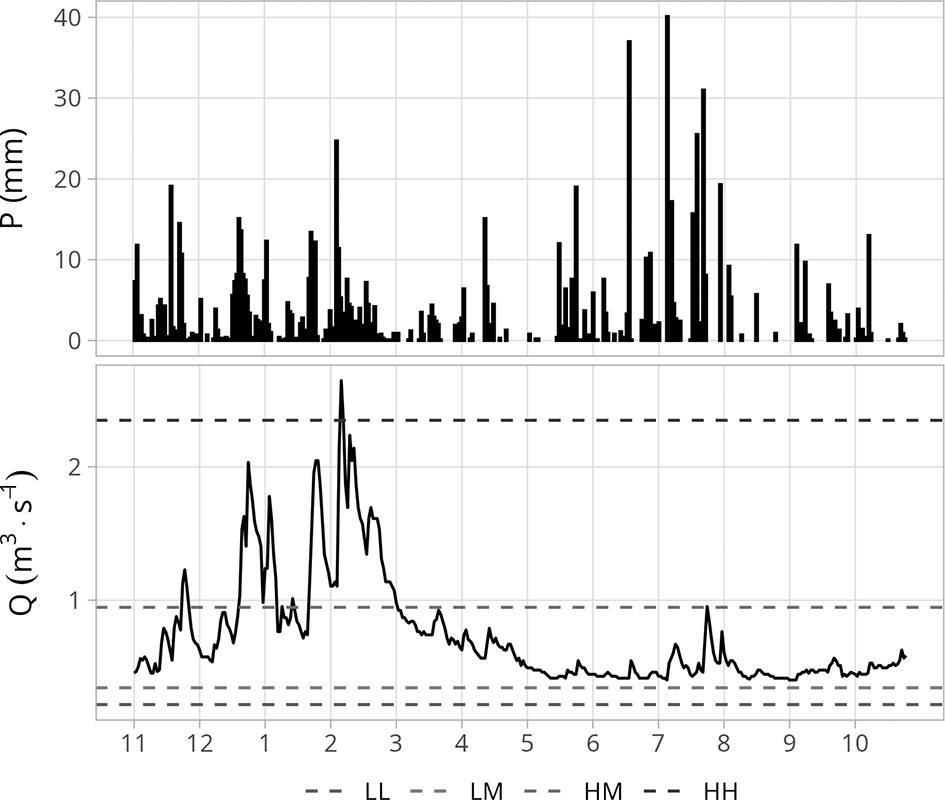
Variability of daily values of precipitation P – and discharge Q – in the hydrological year 2024. The discharge plot also shows the boundaries of flow level categories.
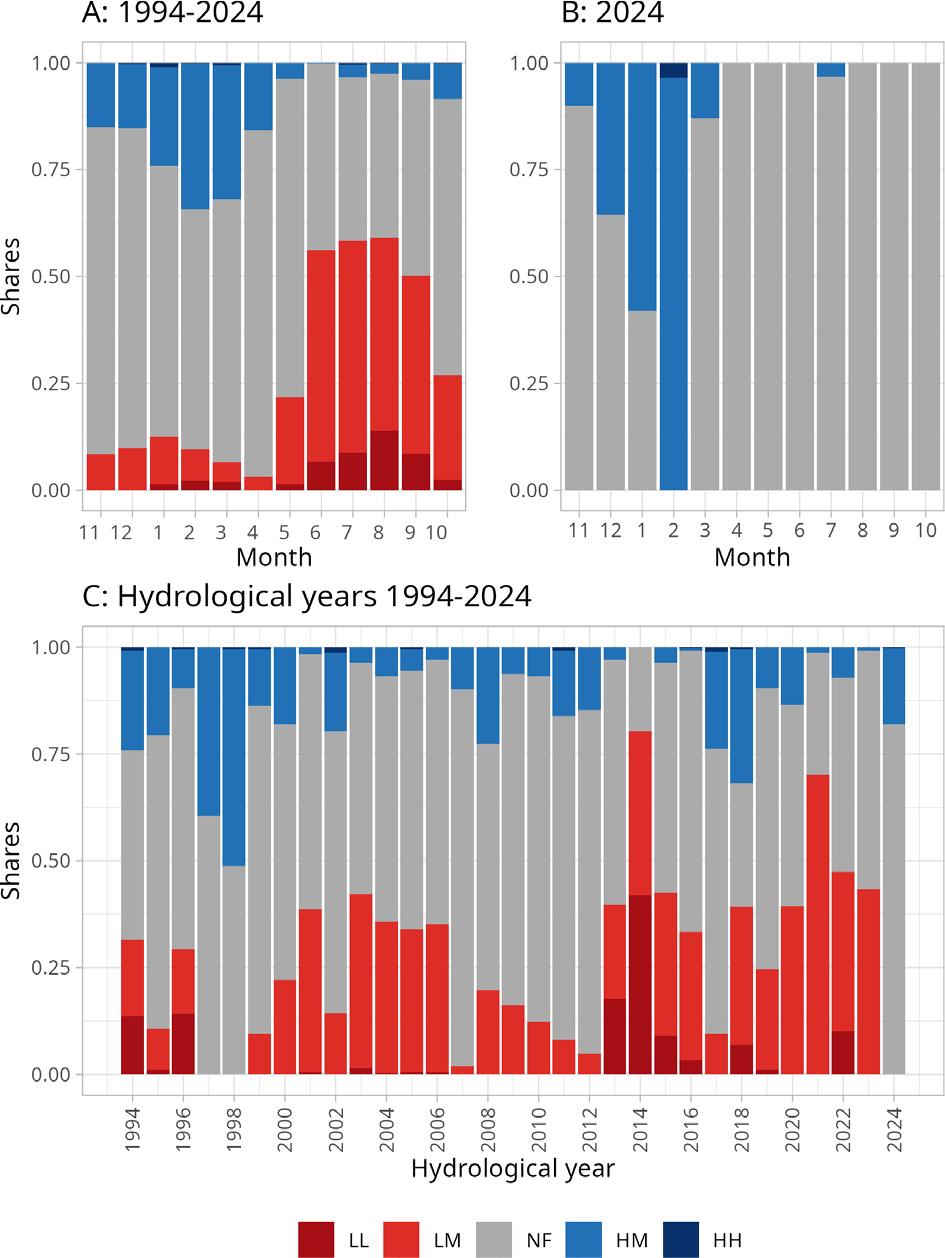
Shares of flow level categories: A – in individual months of 1994–2024, B – in the hydrological year 2024 and C – in hydrological years 1994–2024.
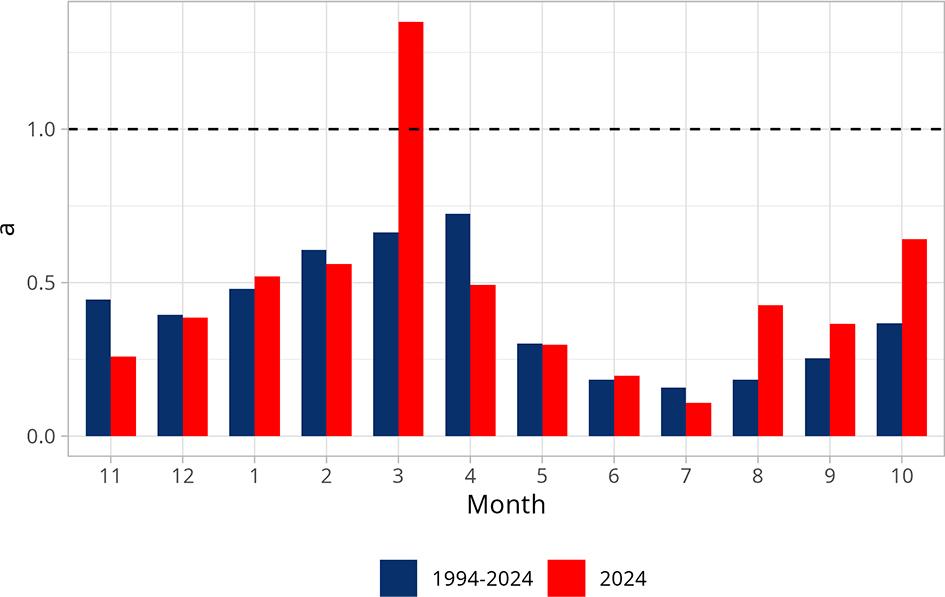
Variability of monthly values of the runoff coefficient (a) – in the hydrological year 2024 in comparison to the monthly runoff coefficient values calculated based on 1994–2024.
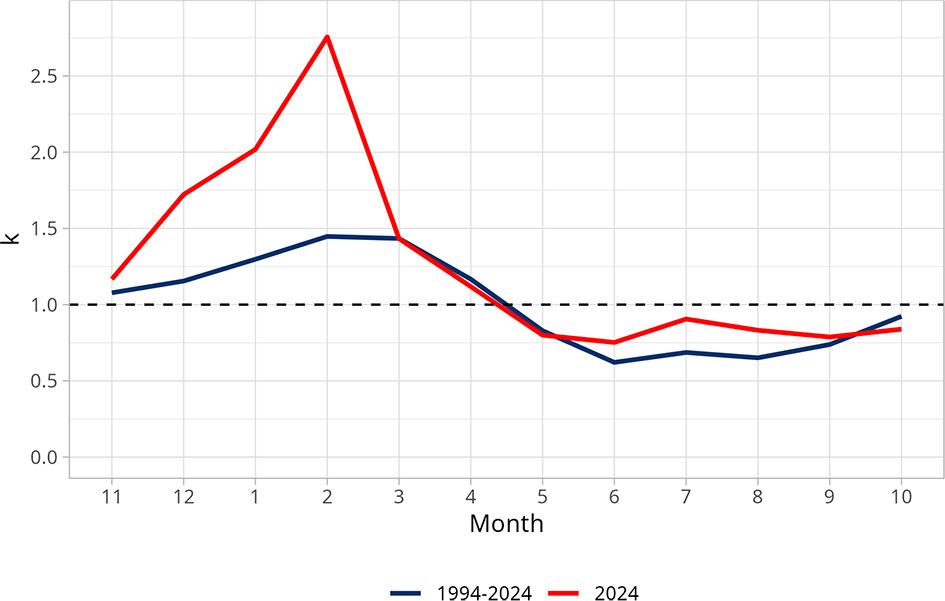
Variability of monthly discharge coefficient (k) – values in the hydrological year 2024 compared to the period 1994–2024.
In summary, the year 2024 exemplifies balanced hydrological conditions, characterised by high flows, which highlights the importance of winter precipitation and groundwater retention in the catchment’s water balance. This pattern aligns with a long-term trend of flow stabilisation, despite ongoing climate changes. The catchment’s lithological structure, geomorphology and land use contribute to its high hydrological resilience. The upper Parsęta can be classified as a river with an oceanic pluvial regime, exhibiting a low seasonal amplitude and discharge that is primarily recharged by groundwater, thereby serving as a representative model of a stable catchment-scale geoecosystem in the temperate transitional climate zone.
Comprehensive monitoring consists of three main tasks: (1) collecting measurements related to various environmental factors, (2) managing the data, and (3) presenting and analysing the data. Data management involves archiving the information, ensuring its accessibility and verifying its accuracy. To effectively carry out these tasks, using appropriate tools is essential. One key tool designed to store vast amounts of historical and integrated data from various sources is a data warehouse. Data warehouses are used as central repositories that store data in a way that is optimised for data analysis, the generation of reports and the development of insights across the integrated data. Data warehouses support analytical tasks through OLAP technologies. In the scientific literature, the issue of using data warehouses in environmental data analysis has been extensively discussed in publications by McGuire et al. (2008), Pinet and Schneider (2010), Boulil et al. (2014, 2015) and Bollen et al. (2022). These researchers pay particular attention to the issue of integrating heterogeneous environmental data from various sources, including sensors, remote sensing systems and automatic monitoring stations. extract, transform, and load (ETL) processes enable their consolidation into a single data repository, which is a key element of OLAP systems. Boulil et al. (2014) emphasise the importance of using open-source solutions (PostgreSQL, Mondrian and JRubik) in the implementation of OLAP systems. This approach not only significantly reduces implementation costs but also increases the availability of technology to a wide range of users, including public institutions involved in environmental monitoring. For geospatial data, Spatial Online Analytical Processing (SOLAP) systems are used. SOLAP combines the capabilities of classic OLAP systems with the functions offered by GIS systems. This is particularly important in the analysis of environmental data, where the spatial context is often crucial for the correct interpretation of results (McGuire et al. 2008, Boulil et al. 2015).
The aim of this study was to explore the potential of using open-source software for archiving, processing, analysing and presenting multidimensional environmental data. We used the Integrated Monitoring of the Natural Environment programme as a case study. This programme collects data from 12 monitoring stations that conduct 17 different measurement programmes, including hydrological monitoring, which provides data on water discharge, and meteorological monitoring, which gathers daily precipitation data. The existing multi-year measurement series consists of 1.2 million results collected from 1994 to the present and continues to grow, with approximately 120,000 new results added annually. These measurement results must be collected, checked for errors, processed, analysed and made accessible to other monitoring networks and the public in the form of datasets, reports and syntheses. Given the large volume of monitoring data, the Integrated Monitoring of the Natural Environment implemented a central repository for data collection and extended it through external applications that connect to the central database via an ODBC system for data access and reporting. The core component of the IT system is a relational database in which the results of environmental monitoring are stored. This database serves as the data source for the hydro data warehouse. Both databases are managed by the PostgreSQL system. The database server facilitates the structured archiving of research results according to the established data model and includes various mechanisms to optimise data access, such as indexing, RAM data buffering and transaction handling. Utilising SQL on the database side allows efficient use of the server’s computational resources. In contrast, procedures written in R or Python are typically executed on local computers with lower processing power. The SQL language allows for a range of operations on data, from querying it based on defined criteria to transforming it and performing complex calculations. In PostgreSQL, these capabilities are extended by the PL/pgSQL language, which is a full-fledged programming language and allows the use of a number of constructs unavailable to SQL (variable declarations, conditional constructs, loops, exception handling). Based on the PL/pgSQL language, a number of procedures used in the process of verifying measurement data have been implemented.
The second component of the information system that works with ZMŚP data is data presentation. For visualisation, we explored using the R programming language, along with R Markdown and the plotly library. R offers a comprehensive environment for data visualisation and analysis, while R Markdown provides tools for data reporting that ensure reproducibility and complete documentation of the results. The plotly library is used to create interactive visualisations.
By integrating PostgreSQL and R capabilities, we have fully automated the annual reporting process for hydrological monitoring data through an R-based framework. This framework is designed to visualise data at various levels of aggregation, including daily, monthly and annual presentations of discharge values and other hydrological parameters. The visualisations created using this framework illustrate the variability of hydrological conditions within the catchment area. By connecting the R capabilities to the hydro data warehouse, we streamline all pre-processing steps – such as aggregating data into different summaries and calculating hydrological parameters – within the database itself. This eliminates the need for additional steps from users. Furthermore, the combination of R, R Markdown and the plotly library allows us to present results interactively, providing functionality similar to that of a web application.
The generated report is structured to ensure clarity and ease of interpretation, even for individuals without specialised expertise. To finalise the report, users only need to add commentary on the results, making it practical and immediately applicable to a broad audience.
Due to the extensive range of the Integrated Monitoring of the Natural Environment, it serves as a prime example of utilising open-source software to manage monitoring data. This approach can be expanded to other measurement programmes within the Integrated Monitoring of the Natural Environment, including, for example, meteorology, precipitation chemistry, groundwaters and river hydrobiology – macrophytes and hydromorphological assessment of the riverbeds. The framework’s modular structure, which combines a relational database (PostgreSQL) with a flexible reporting environment (R), allows for easy adaptation to various types of data and measurement frequencies. Its application is not limited to annual reporting; it can also support continuous analysis, mid-term evaluations and the preparation of synthetic assessments across spatial and temporal scales.
Moreover, the integration of PostgreSQL and R can be used to streamline data processing for synthesising programmes that involve complex integrative tasks, such as modelling changes in the water and biogeochemical balance using the SWAT model (Bochenek, Gudowicz 2021) or assessing ecosystem services (Kostrzewski et al. 2014). By ensuring standardisation and reproducibility, the framework enhances the transparency and accessibility of monitoring results, contributing to evidence-based environmental management. This approach is also well-suited for national-scale syntheses, where data from all stations can be systematically compared.
The reporting can be further enhanced by implementing tools that allow for the creation of interactive web applications, providing full interactivity. In the R environment, such functionality can be achieved using Shiny. The use of interactive charts and dashboards enables users to explore spatial and temporal patterns across the entire monitoring network. Such visual tools are particularly valuable for identifying regional trends, supporting nationwide assessments and facilitating communication of results to stakeholders and decision-makers.
In the long term, such open-source – based solutions may play a key role in harmonising data workflows across national and international monitoring programmes, supporting environmental policy and scientific synthesis on multiple levels.