Fig. 1.
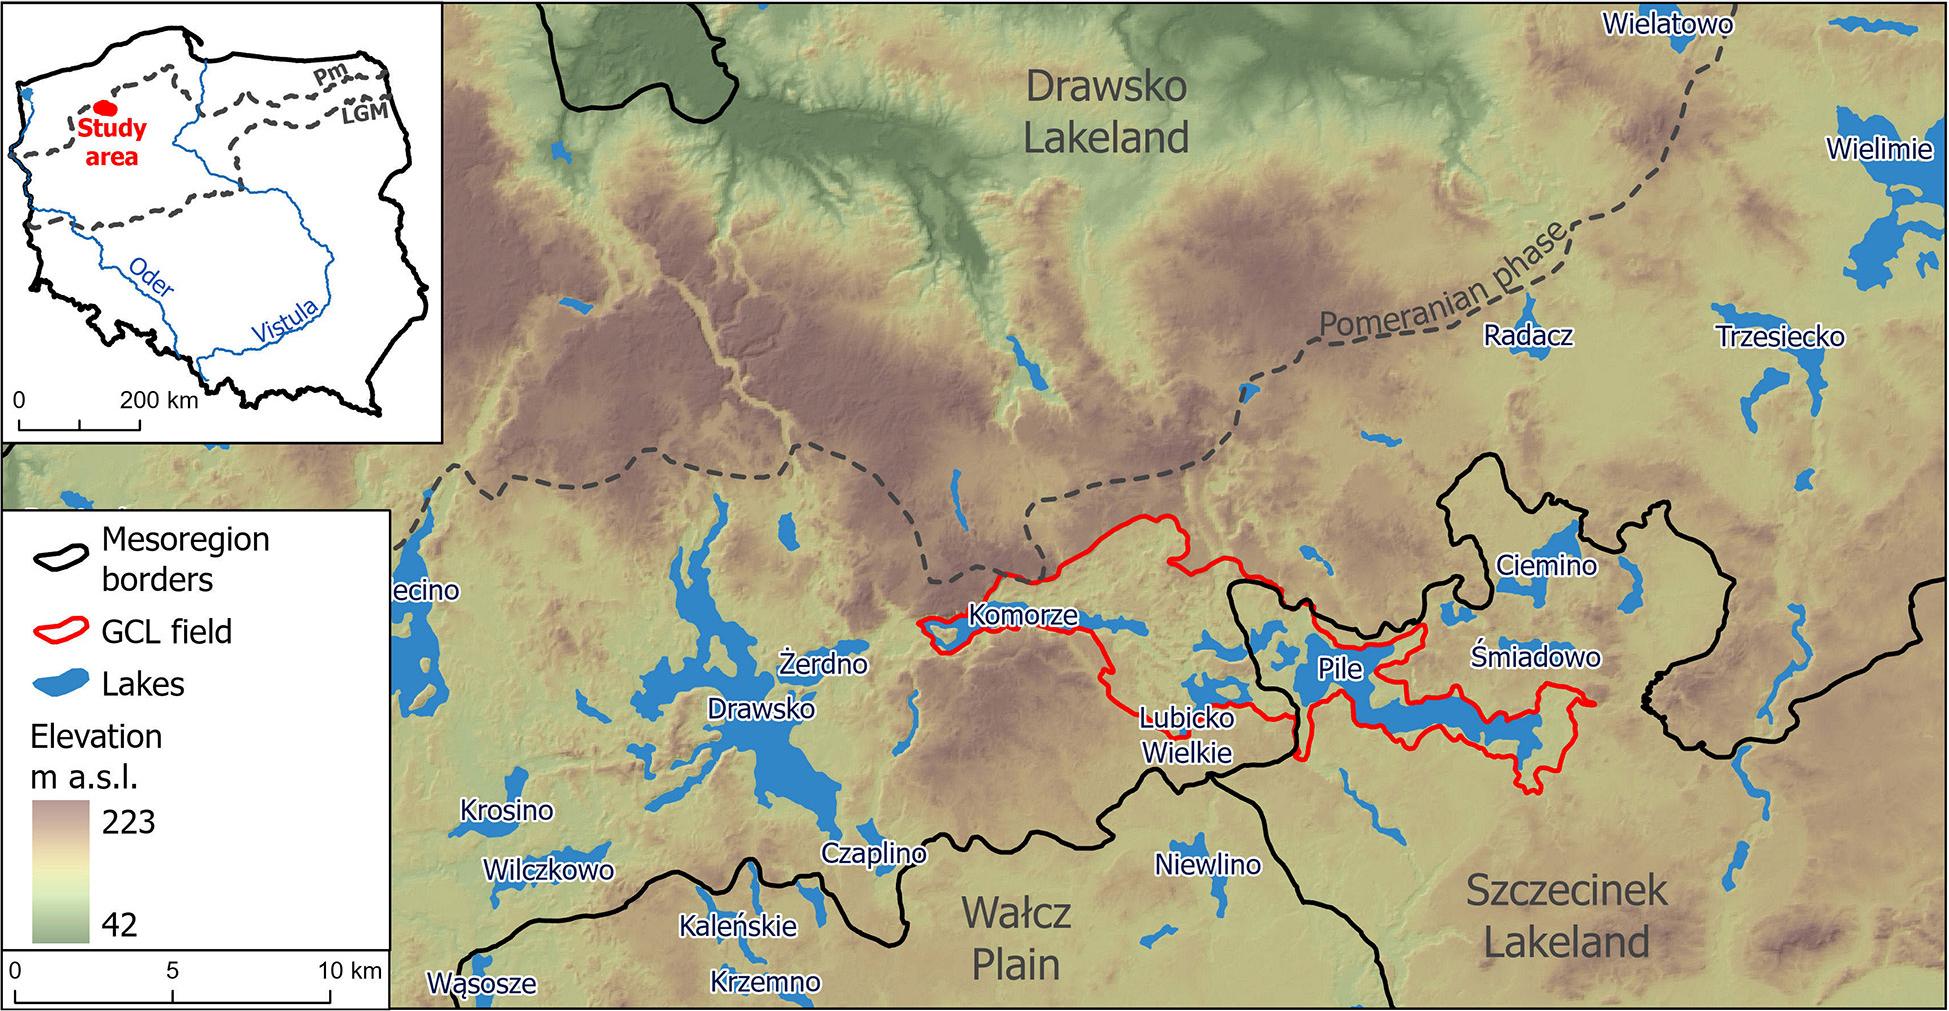
Fig. 2.
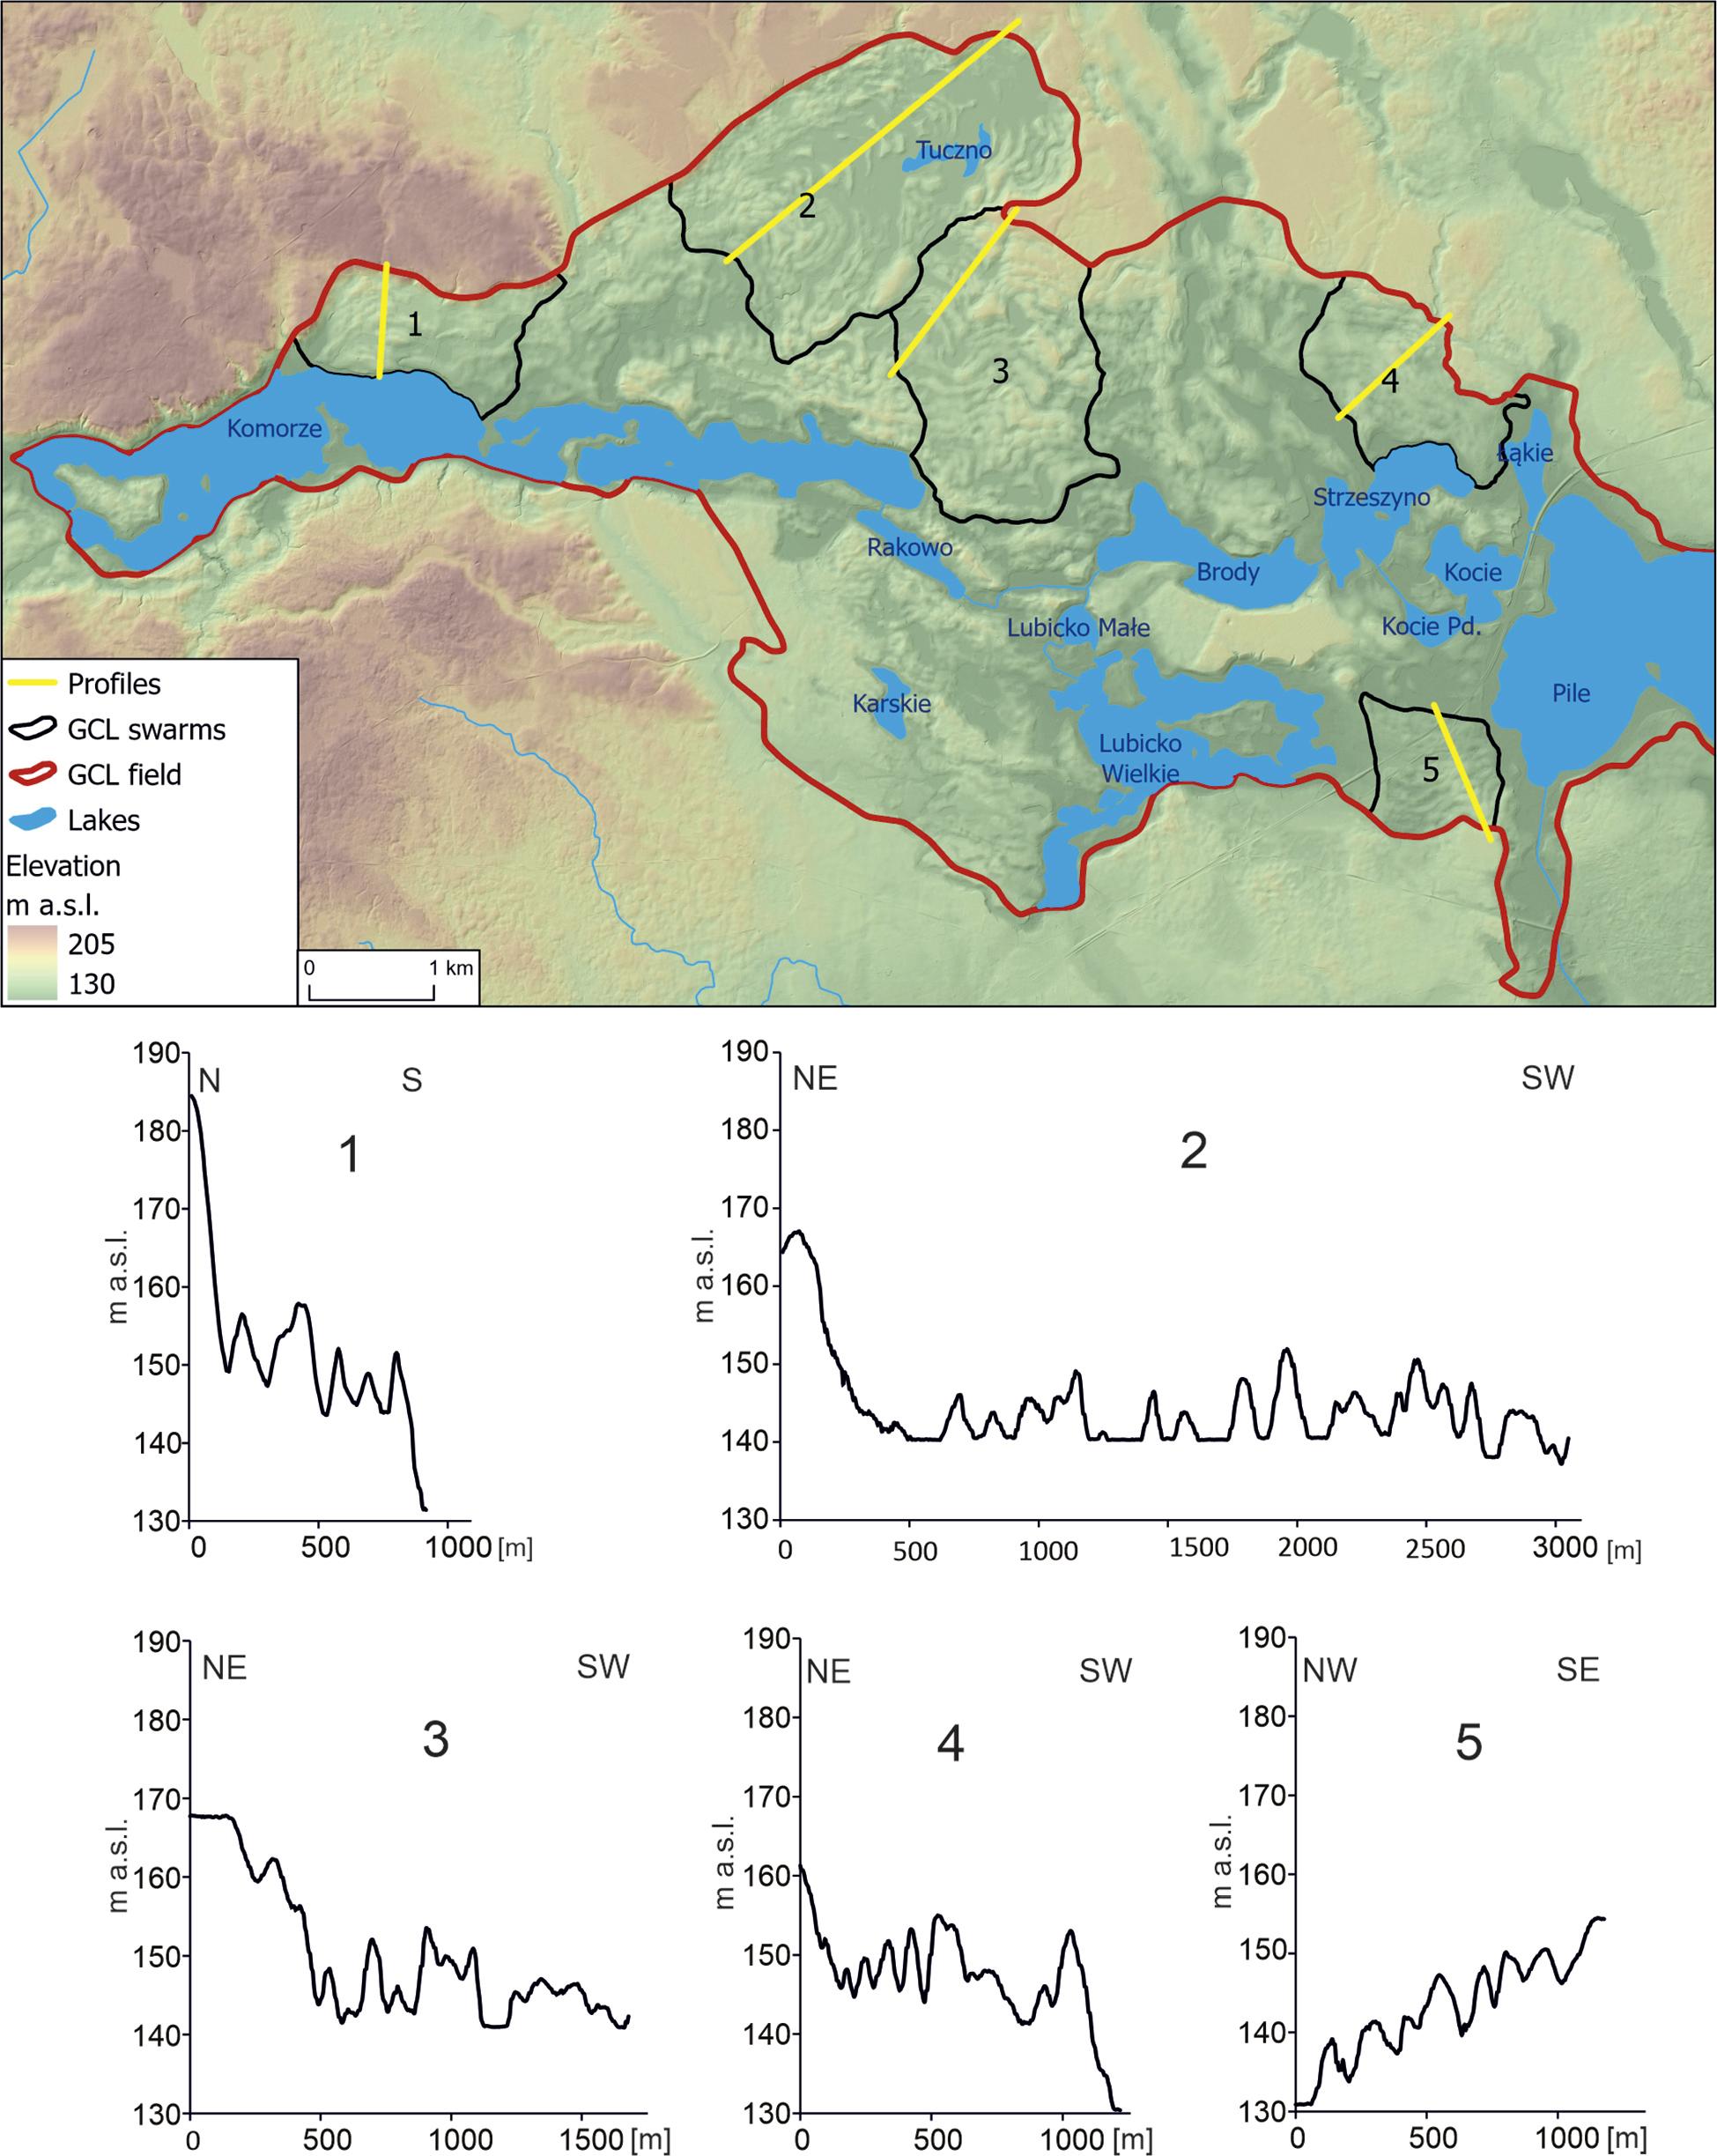
Fig. 3.
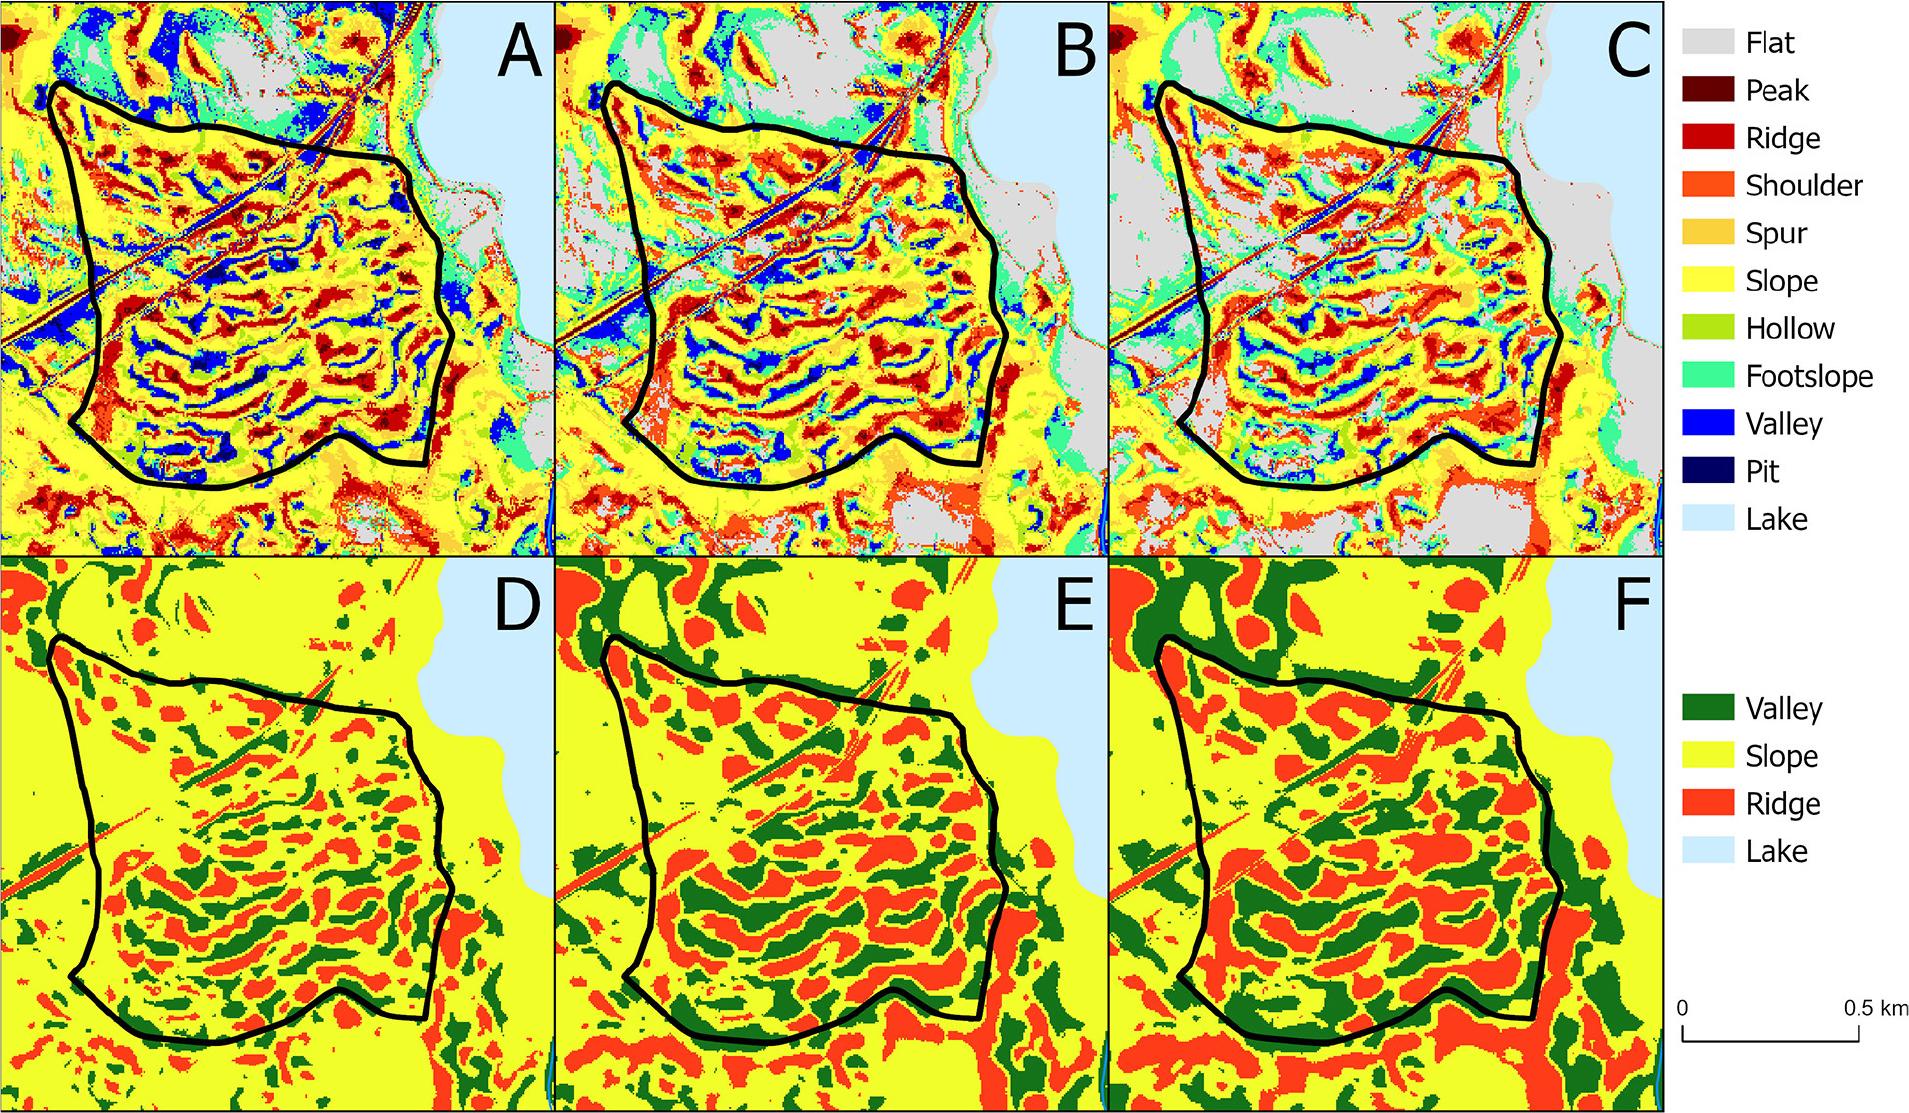
Fig. 4.
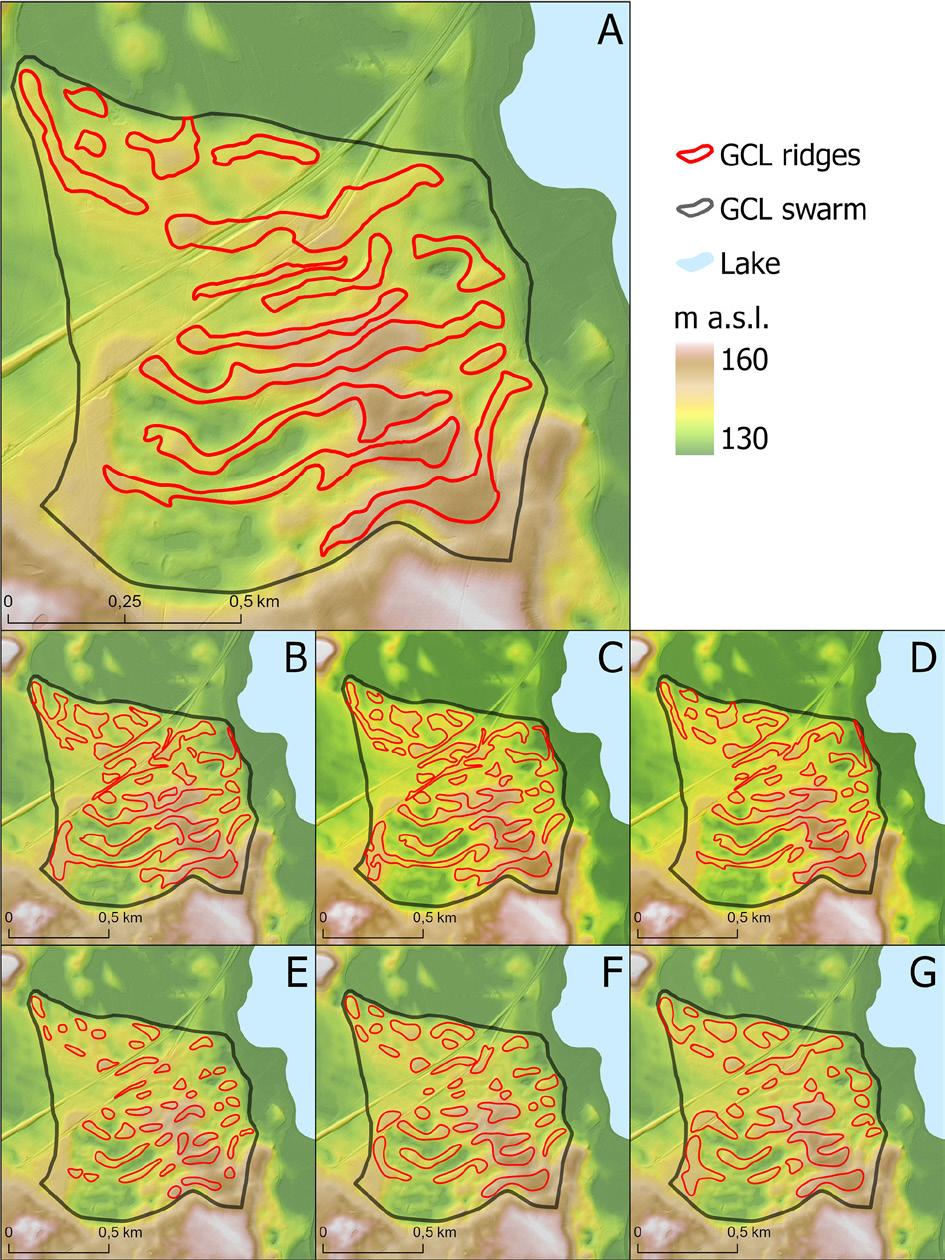
Fig. 5.
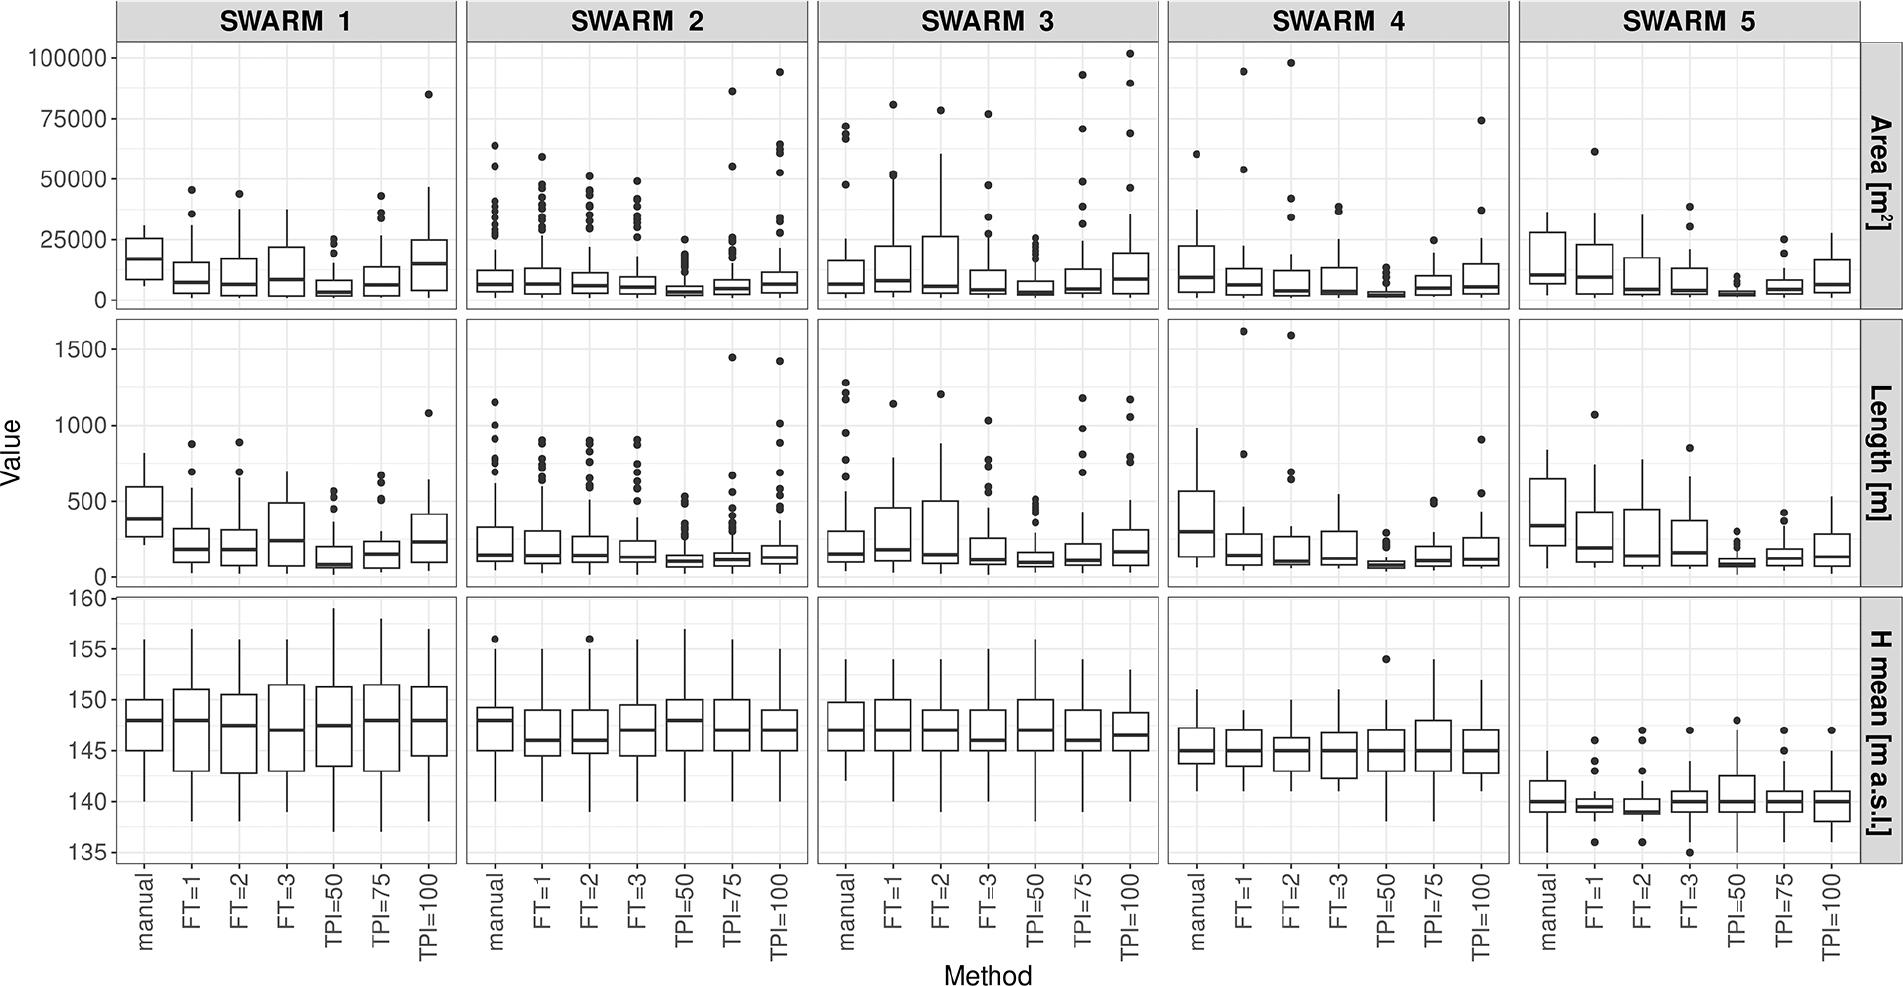
Fig. 6.
Morphometric parameters of glacial curvilineations (GCL) swarms (FT – flatness threshold)_
| Swarm | Parameter | Unit | Manual | Geomorphons | Topographic Position Index | ||||
|---|---|---|---|---|---|---|---|---|---|
| FT = 1 | FT = 2 | FT = 3 | N = 50 | N = 75 | N = 100 | ||||
| 1 | Swarm area | [ha] | 146.564 | ||||||
| Forms area | 26.307 | 29.103 | 28.246 | 27.043 | 19.582 | 27.999 | 32.795 | ||
| Share of area | [%] | 17.9 | 19.9 | 19.3 | 18.5 | 13.4 | 19.1 | 22.4 | |
| Swarm length | [m] | 2177 | |||||||
| Swarm width | 1216 | ||||||||
| Number of forms (n) | [–] | 15 | 26 | 24 | 22 | 32 | 27 | 16 | |
| 2 | Swarm area | [ha] | 499.229 | ||||||
| Forms area | 93.230 | 115.523 | 108.193 | 99.485 | 77.783 | 101.400 | 110.094 | ||
| Share of area | [%] | 18.7 | 23.1 | 21.7 | 19.9 | 15.6 | 20.3 | 22.1 | |
| Swarm length | [m] | 1951 | |||||||
| Swarm width | 3193 | ||||||||
| Number of forms (n) | [–] | 87 | 111 | 112 | 123 | 164 | 143 | 101 | |
| 3 | Swarm area | [ha] | 324.069 | ||||||
| Forms area | 58.185 | 77.292 | 74.856 | 66.390 | 50.352 | 66.887 | 73.693 | ||
| Share of area | [%] | 18.0 | 23.9 | 23.1 | 20.5 | 15.5 | 20.6 | 22.7 | |
| Swarm length | [m] | 1648 | |||||||
| Swarm width | 2553 | ||||||||
| Number of forms (n) | [–] | 38 | 48 | 46 | 66 | 88 | 62 | 46 | |
| 4 | Swarm area | [ha] | 155.969 | ||||||
| Forms area | 25.592 | 30.290 | 29.042 | 24.953 | 13.307 | 24.207 | 28.245 | ||
| Share of area | [%] | 16.4 | 19.4 | 18.6 | 16.0 | 8.5 | 15.5 | 18.1 | |
| Swarm length | [m] | 2015 | |||||||
| Swarm width | 1259 | ||||||||
| Number of forms (n) | [–] | 16 | 23 | 24 | 26 | 43 | 33 | 24 | |
| 5 | Swarm area | [ha] | 93.646 | ||||||
| Forms area | 23.343 | 28.340 | 26.629 | 22.331 | 13.568 | 21.352 | 25.533 | ||
| Share of area | [%] | 24.9 | 30.3 | 28.4 | 23.8 | 14.5 | 22.8 | 27.3 | |
| Swarm length | [m] | 1273 | |||||||
| Swarm width | 1052 | ||||||||
| Number of forms (n) | [–] | 15 | 20 | 24 | 25 | 43 | 34 | 25 | |
Morphometric parameters of glacial curvilineations (GCL) forms_ (FT – flatness threshold)_
| Swarm | Parameter | Unit | Manual | Geomorphons | Topographic Position Index | ||||||||||||||||||
|---|---|---|---|---|---|---|---|---|---|---|---|---|---|---|---|---|---|---|---|---|---|---|---|
| FT = 1 | FT = 2 | FT = 3 | N = 50 | N = 75 | N = 100 | ||||||||||||||||||
| Mean | Max | Min | Mean | Max | Min | Mean | Max | Min | Mean | Max | Min | Mean | Max | Min | Mean | Max | Min | Mean | Max | Min | |||
| 1 | Area | [ha] | 1.754 | 3.085 | 0.579 | 1.119 | 4.547 | 0.101 | 1.177 | 4.385 | 0.102 | 1.229 | 3.759 | 0.101 | 0.612 | 2.520 | 0.101 | 1.037 | 4.302 | 0.115 | 2.050 | 8.484 | 0.106 |
| Length | [m] | 428 | 819 | 212 | 243 | 875 | 25 | 263 | 886 | 21 | 284 | 698 | 21 | 150 | 566 | 14 | 197 | 669 | 30 | 311 | 1082 | 40 | |
| Hmean | [m a.s.l.] | 148 | 156 | 140 | 148 | 157 | 138 | 147 | 156 | 138 | 147 | 156 | 140 | 148 | 159 | 137 | 148 | 159 | 137 | 148 | 157 | 138 | |
| Hmax | 152 | 162 | 142 | 150 | 162 | 139 | 150 | 162 | 139 | 151 | 162 | 141 | 150 | 162 | 138 | 151 | 162 | 138 | 152 | 162 | 139 | ||
| Hmin | 141 | 149 | 134 | 143 | 154 | 133 | 143 | 152 | 133 | 143 | 152 | 134 | 144 | 154 | 136 | 144 | 154 | 136 | 143 | 153 | 134 | ||
| 2 | Area | [ha] | 1.072 | 6.374 | 0.104 | 1.041 | 5.920 | 0.107 | 0.966 | 5.114 | 0.101 | 0.809 | 4.910 | 0.101 | 0.474 | 2.503 | 0.101 | 0.709 | 8.611 | 0.100 | 1.090 | 9.429 | 0.103 |
| Length | [m] | 258 | 1151 | 44 | 225 | 901 | 25 | 216 | 898 | 14 | 191 | 903 | 14 | 124 | 533 | 21 | 148 | 1447 | 21 | 188 | 1422 | 21 | |
| Hmean | [m a.s.l.] | 148 | 157 | 140 | 147 | 156 | 140 | 147 | 156 | 140 | 147 | 157 | 140 | 148 | 158 | 141 | 148 | 156 | 141 | 148 | 156 | 141 | |
| Hmax | 151 | 161 | 141 | 150 | 161 | 141 | 150 | 161 | 141 | 150 | 161 | 141 | 150 | 161 | 142 | 150 | 161 | 142 | 151 | 161 | 142 | ||
| Hmin | 144 | 152 | 137 | 143 | 152 | 136 | 144 | 152 | 137 | 144 | 154 | 137 | 146 | 152 | 139 | 145 | 152 | 139 | 145 | 152 | 138 | ||
| 3 | Area | [ha] | 1.531 | 7.189 | 0.102 | 1.610 | 8.073 | 0.129 | 1.627 | 7.843 | 0.107 | 1.006 | 7.692 | 0.102 | 0.572 | 2.565 | 0.102 | 1.079 | 9.315 | 0.110 | 1.602 | 10.174 | 0.110 |
| Length | [m] | 298 | 1281 | 38 | 286 | 1142 | 28 | 298 | 1204 | 21 | 196 | 1034 | 14 | 137 | 513 | 28 | 191 | 1179 | 25 | 246 | 1170 | 28 | |
| Hmean | [m a.s.l.] | 148 | 155 | 142 | 148 | 155 | 140 | 148 | 154 | 140 | 147 | 156 | 140 | 148 | 156 | 139 | 147 | 154 | 140 | 147 | 153 | 140 | |
| Hmax | 151 | 164 | 144 | 151 | 164 | 141 | 151 | 164 | 141 | 150 | 164 | 141 | 150 | 164 | 140 | 150 | 164 | 141 | 150 | 164 | 141 | ||
| Hmin | 144 | 149 | 137 | 143 | 149 | 135 | 143 | 149 | 135 | 144 | 150 | 137 | 145 | 153 | 137 | 144 | 150 | 138 | 144 | 149 | 137 | ||
| 4 | Area | [ha] | 1.600 | 6.030 | 0.106 | 1.317 | 9.452 | 0.100 | 1.210 | 9.800 | 0.105 | 0.960 | 3.864 | 0.106 | 0.309 | 1.336 | 0.105 | 0.734 | 2.475 | 0.146 | 1.177 | 7.434 | 0.112 |
| Length | [m] | 382 | 985 | 62 | 263 | 1620 | 42 | 244 | 1594 | 57 | 205 | 547 | 55 | 95 | 292 | 35 | 157 | 506 | 42 | 208 | 905 | 55 | |
| Hmean | [m a.s.l.] | 146 | 151 | 141 | 146 | 150 | 142 | 145 | 150 | 141 | 146 | 152 | 141 | 146 | 154 | 139 | 146 | 154 | 138 | 146 | 152 | 141 | |
| Hmax | 149 | 157 | 145 | 148 | 157 | 143 | 147 | 157 | 143 | 147 | 157 | 142 | 147 | 157 | 139 | 148 | 157 | 142 | 148 | 157 | 142 | ||
| Hmin | 142 | 147 | 134 | 143 | 146 | 135 | 143 | 147 | 134 | 143 | 147 | 134 | 144 | 151 | 137 | 143 | 150 | 135 | 143 | 148 | 135 | ||
| 5 | Area | [ha] | 1.556 | 3.645 | 0.210 | 1.417 | 6.132 | 0.103 | 1.110 | 3.552 | 0.149 | 0.893 | 3.864 | 0.129 | 0.316 | 0.976 | 0.124 | 0.628 | 2.512 | 0.110 | 1.021 | 2.773 | 0.108 |
| Length | [m] | 411 | 839 | 57 | 300 | 1071 | 60 | 270 | 778 | 53 | 244 | 850 | 53 | 102 | 301 | 14 | 149 | 425 | 41 | 182 | 532 | 21 | |
| Hmean | [m a.s.l.] | 141 | 146 | 136 | 140 | 146 | 136 | 140 | 147 | 136 | 141 | 148 | 136 | 142 | 149 | 136 | 141 | 148 | 136 | 141 | 148 | 136 | |
| Hmax | 144 | 151 | 137 | 143 | 151 | 139 | 143 | 151 | 137 | 143 | 151 | 137 | 143 | 151 | 136 | 143 | 151 | 137 | 143 | 151 | 137 | ||
| Hmin | 136 | 138 | 134 | 137 | 142 | 132 | 137 | 140 | 132 | 137 | 141 | 132 | 139 | 146 | 135 | 138 | 143 | 134 | 138 | 142 | 134 | ||