
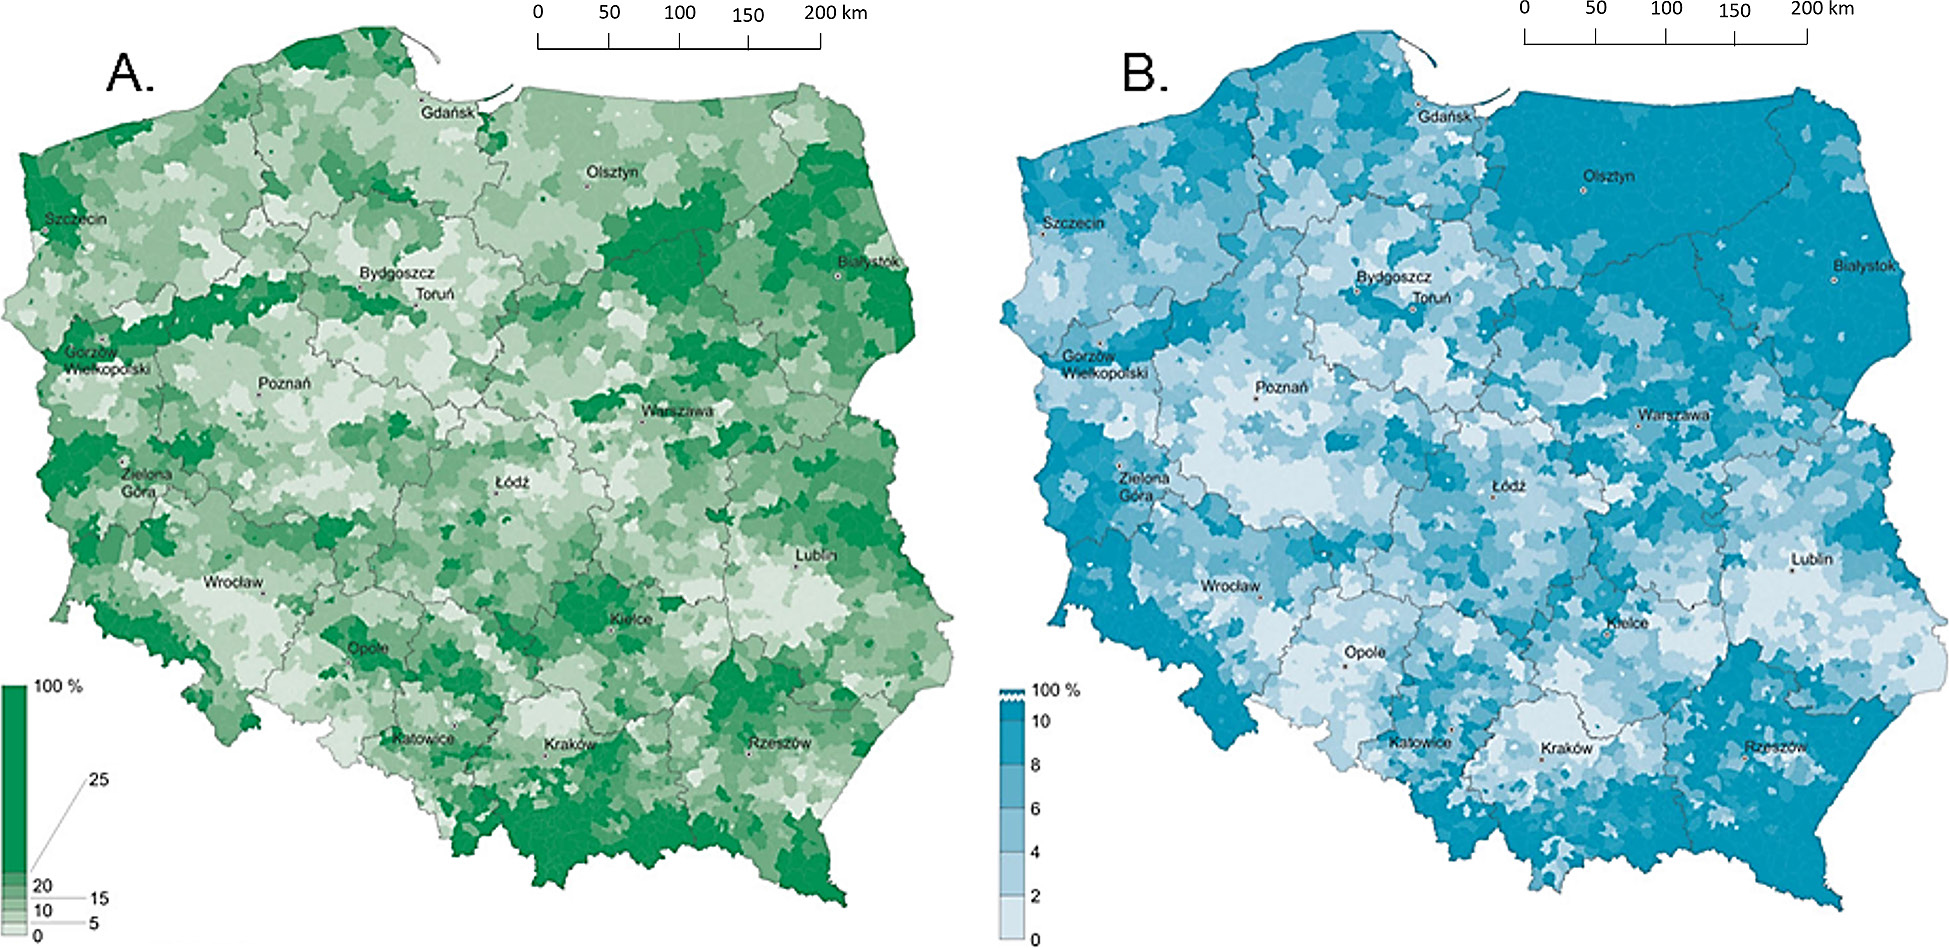
Fig. 1.
A – Share of meadows in the total area of agricultural lands, 2005; B – Share of pastures in the total area of agricultural lands, 2005. Maps from: Atlas of Agriculture of Poland (Bański 2010).
Table 1.
Selected mapping applications to support agricultural production management.
| 365FarmNet | SatAgro | OneSoil yield | EOSDA crop monitoring | |
|---|---|---|---|---|
| Access | 10 days demo then paid | Free demo then paid | Free demo then paid | Free demo then paid |
| Language | PL, DE, EN, FR | PL, Uk, ES, EN, DE, CS | PL, ES, CS, RU, FR, PT, DE, HU, UK | ES, RU, FR, PT, UK |
| Background maps, satellite data | Google Maps and satellite images from NASA, Sentinel-2 | Satellite images (Sentinel-2, PlanetScope, Landsat8, MODIS), maps (OSM, Google) | Google Maps and satellite images from NASA | Sentinel-2, PlanetScope, EOS SAT-1 |
| Cultivation/breeding | Any kind of cultivation (without details for grasslands)/breeding | Any kind of cultivation/breeding | Any kind of cultivation/breeding | Any kind of cultivation/breeding |
| Field options | Vegetation, crop condition, fertilisation, sowing, crop protection, harvest, weather | Crop condition, weather (IMGW), soil tests, sowing, harvesting, fertilisation, other biochemicals, alarms | Field, crop rotation, notes, fields by season, sowing, harvesting, crop classifications, weather | Vegetation, crop condition, weather, crop classification, tracking, soil moisture analytics, yield prediction, soil organic carbon, crop rotation, sowing, harvesting, notifications, irrigation |
| Satellite indicators | NDVI (Sentinel-2) | NDVI (Sentinel-2, PlanetScope), GDD | Maps with indicators in the paid version (for advisors, farmers, soil testing companies), for example, NDVI | NDVI, NDRE, MSAVI, RECI, NDMI |
| Additional options | Yes, it can be added (vehicle) | Yes, e.g., profitability | Yes, e.g., file converters | Yes, e.g., API access to satellite data |
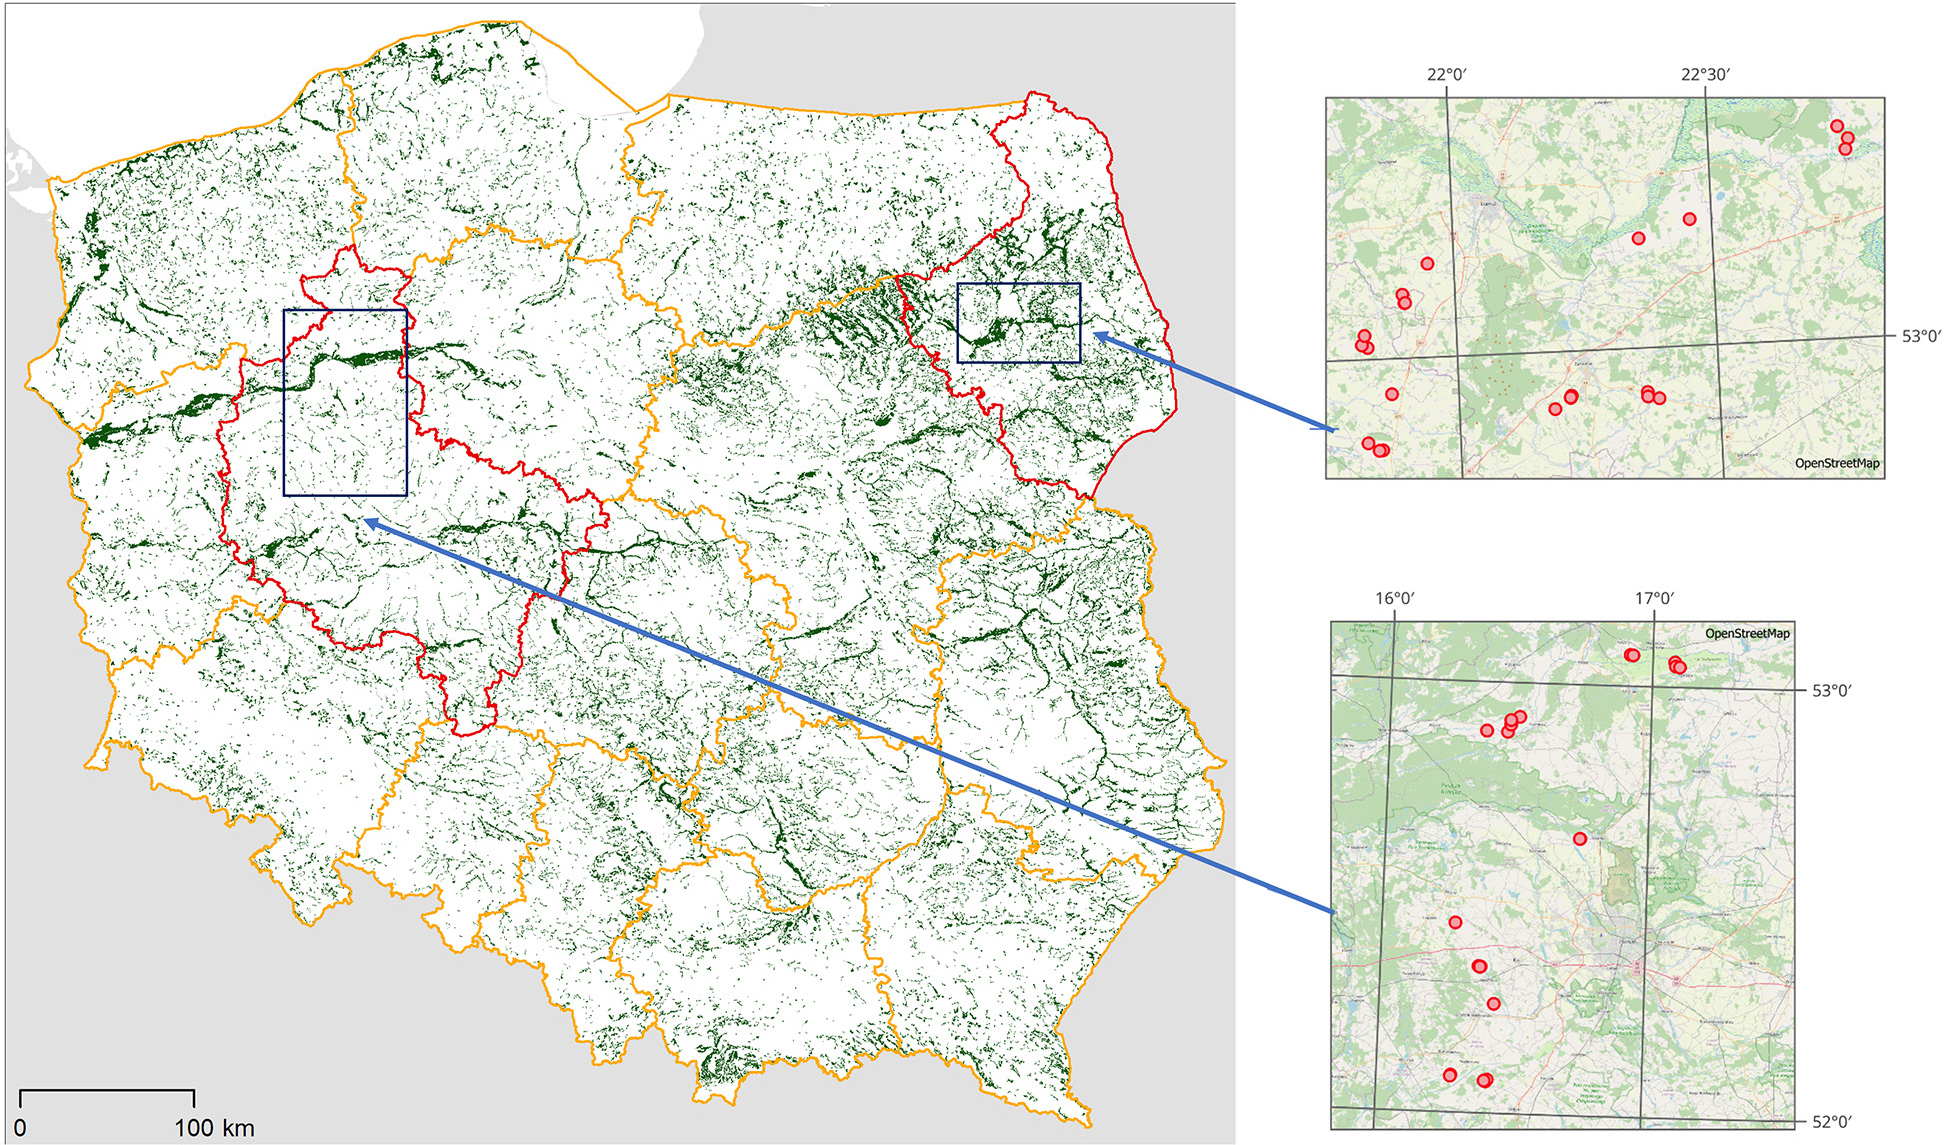
Fig. 2.
Poland – in situ data collection sites used to validate satellite data.
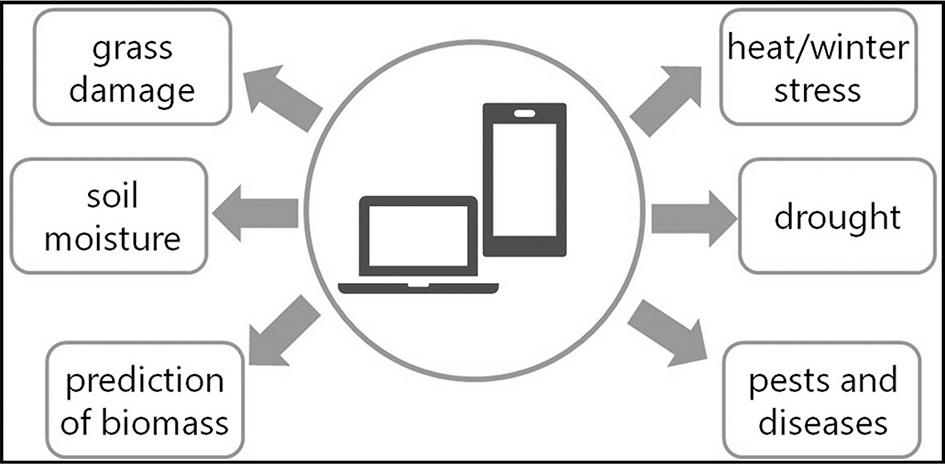
Fig. 3.
Main themes that can be monitored with the GRASSAT application.
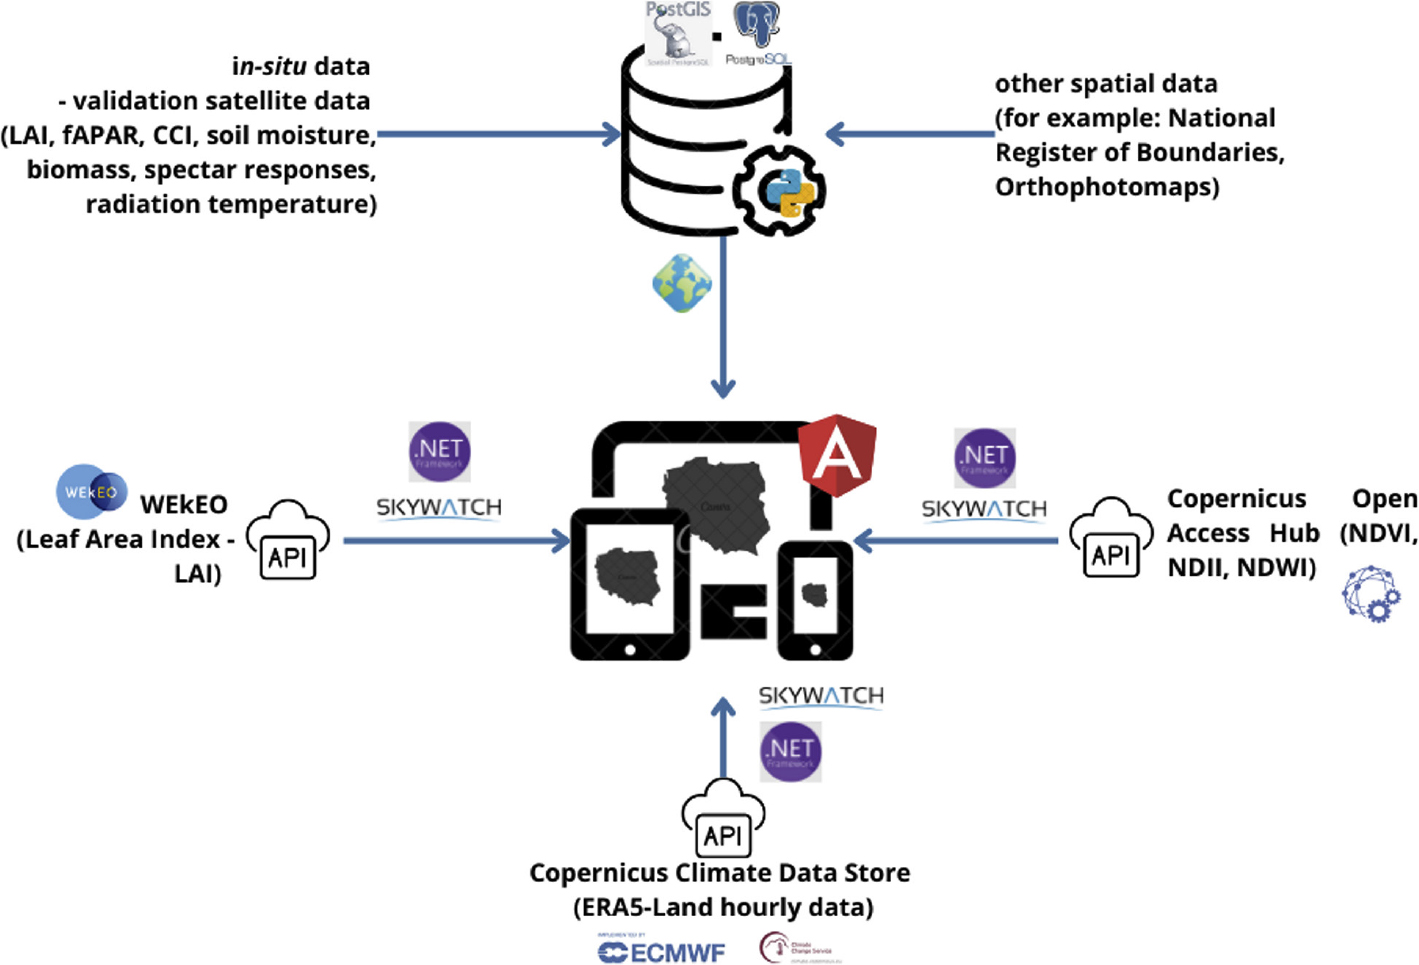
Fig. 4.
Diagram of proceedings in the development of the GRASSAT application.
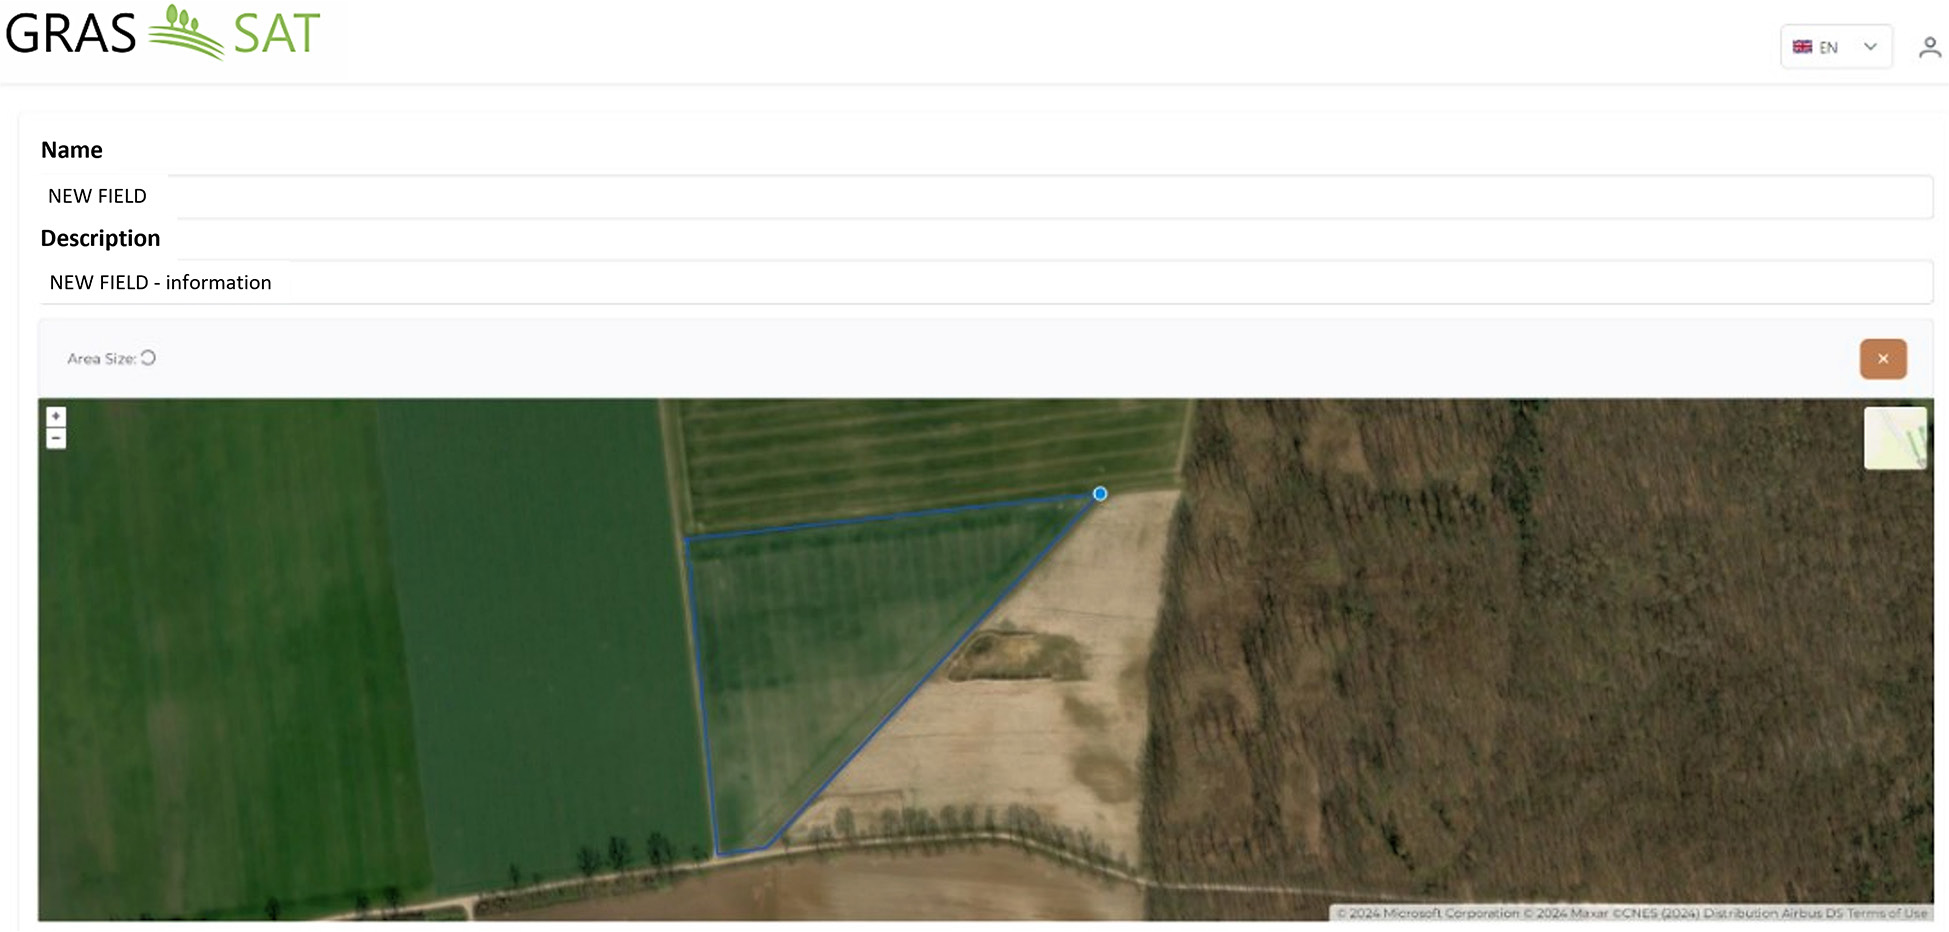
Fig. 5.
An example view of a grassland plot in the GRASSAT application.
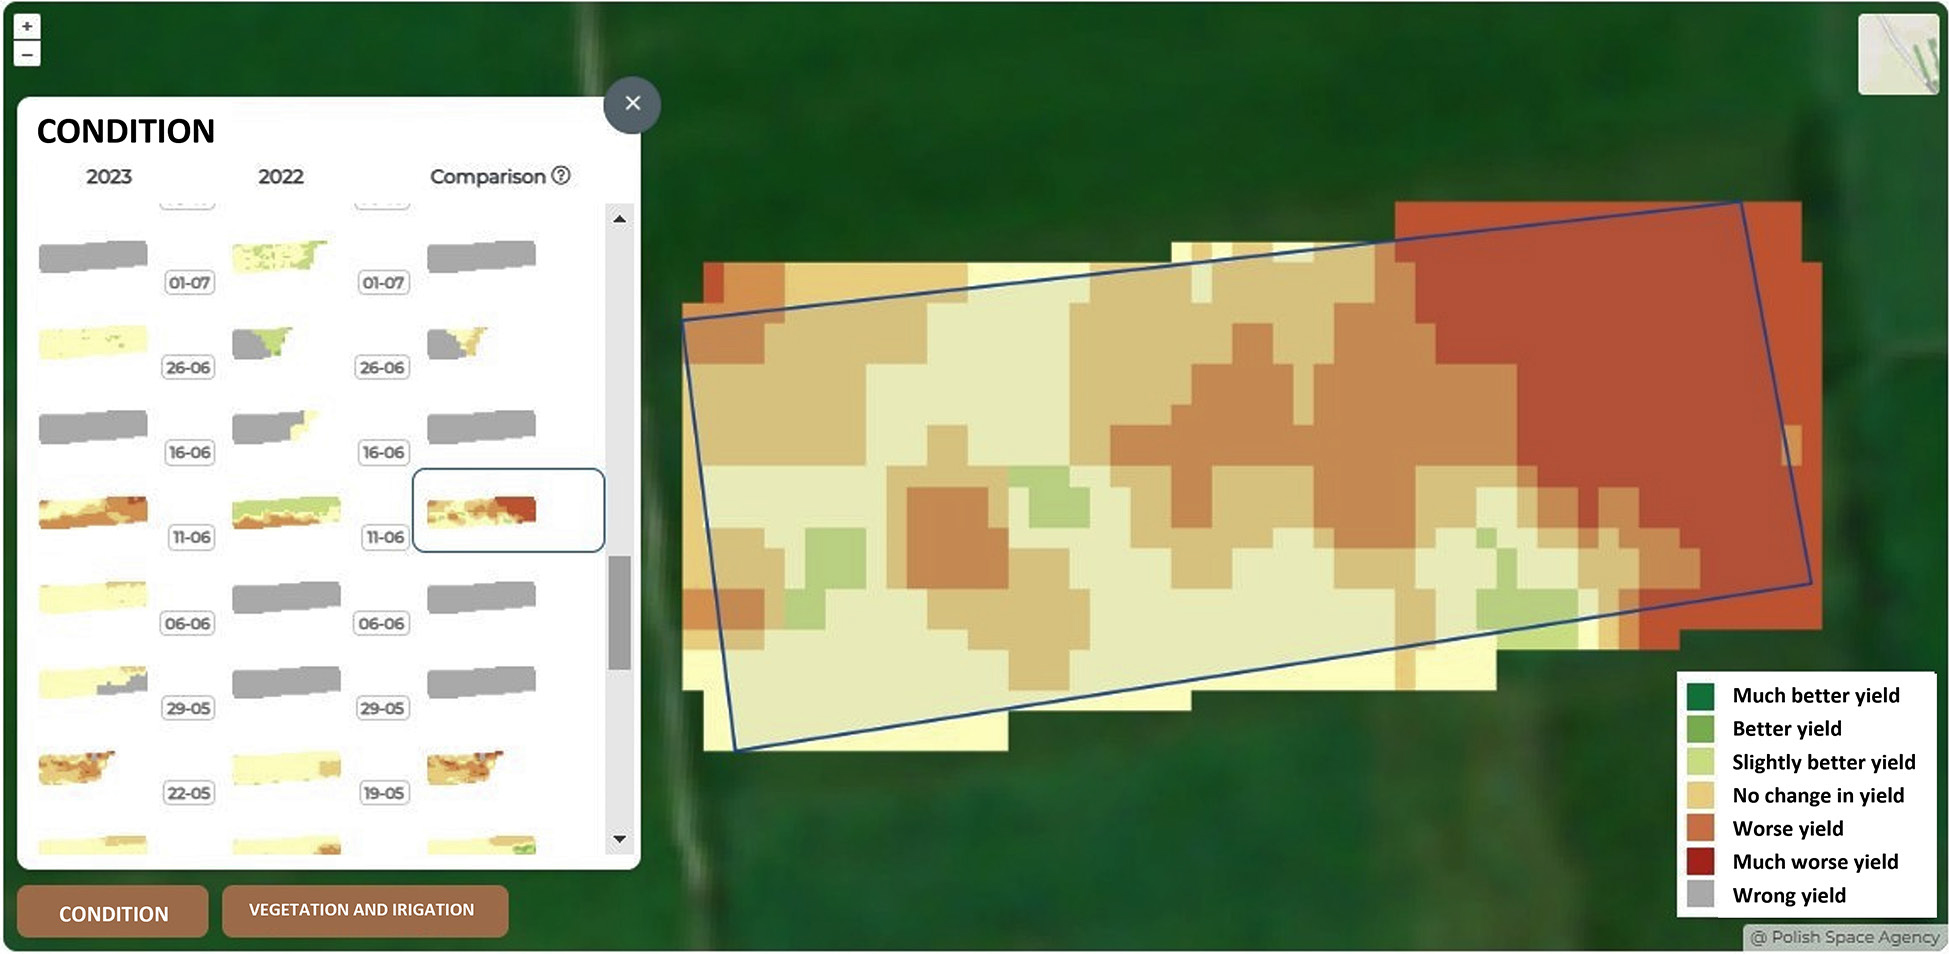
Fig. 6.
An example view of a field with vegetation condition information in the GRASSAT application. Possibility to compare the condition of grassland plots for the current and previous year.
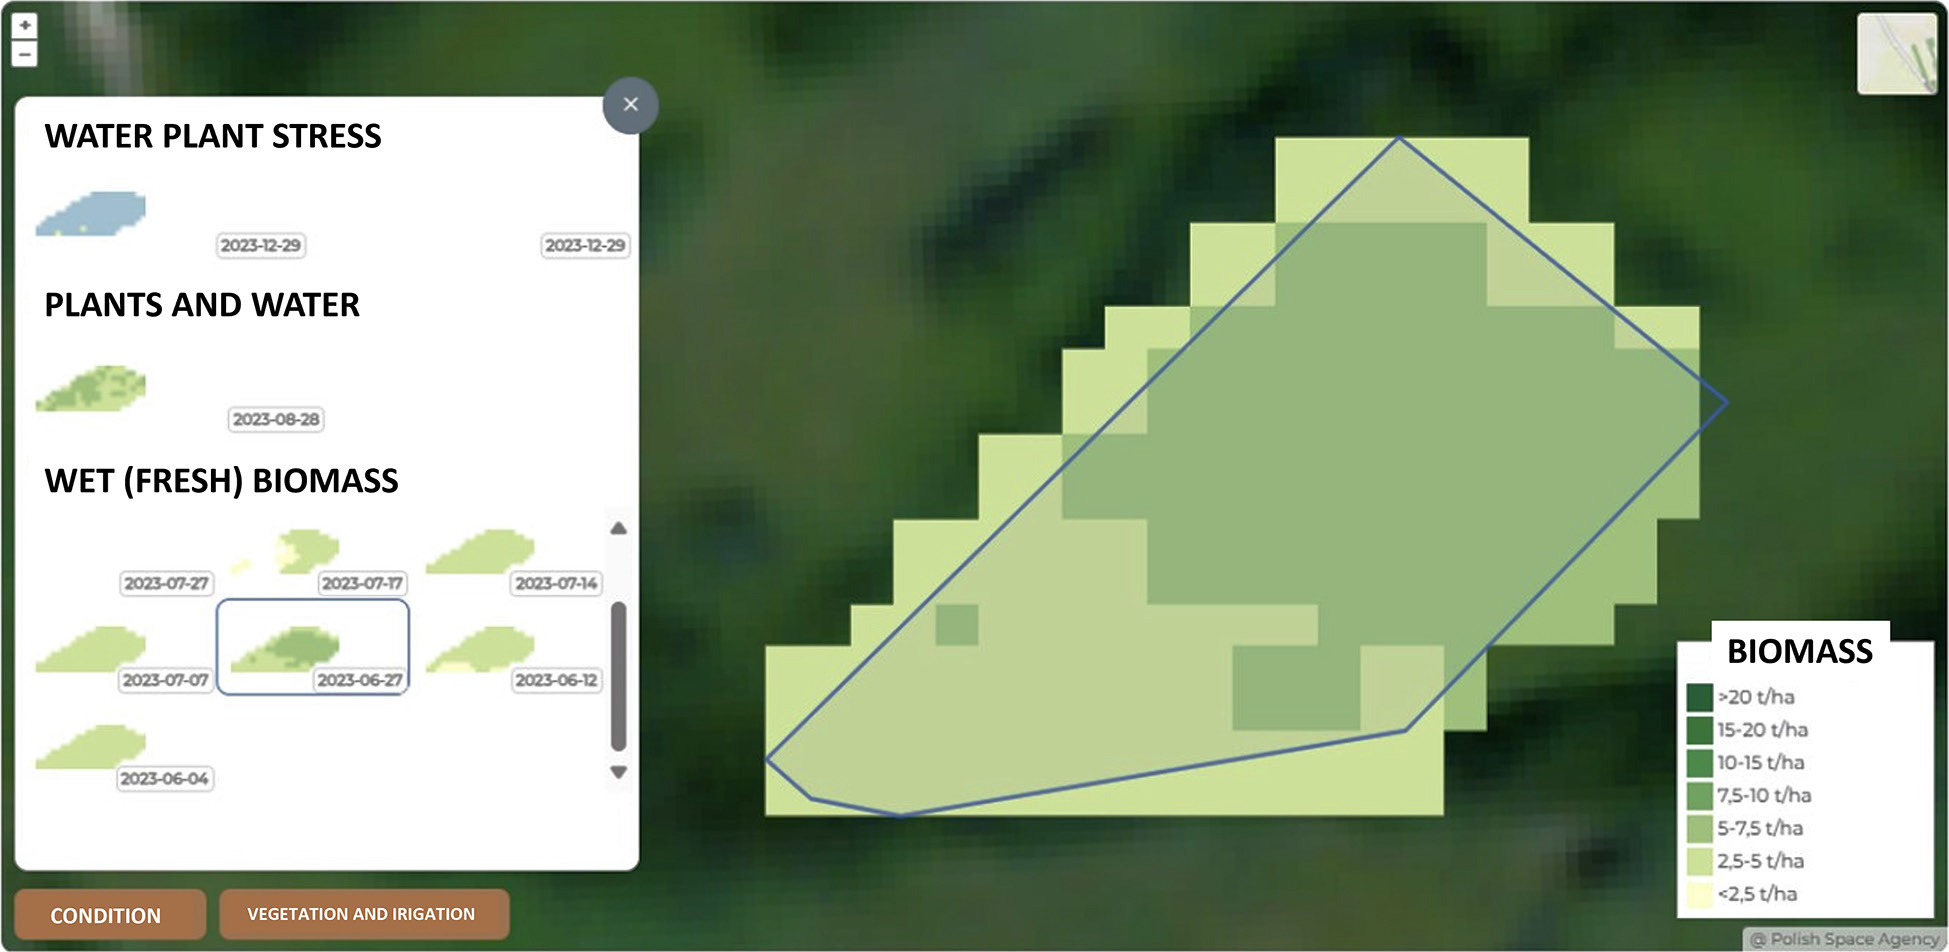
Fig. 7.
The weight of the predicted fresh biomass production on the grassland plots on the GRASSAT application.
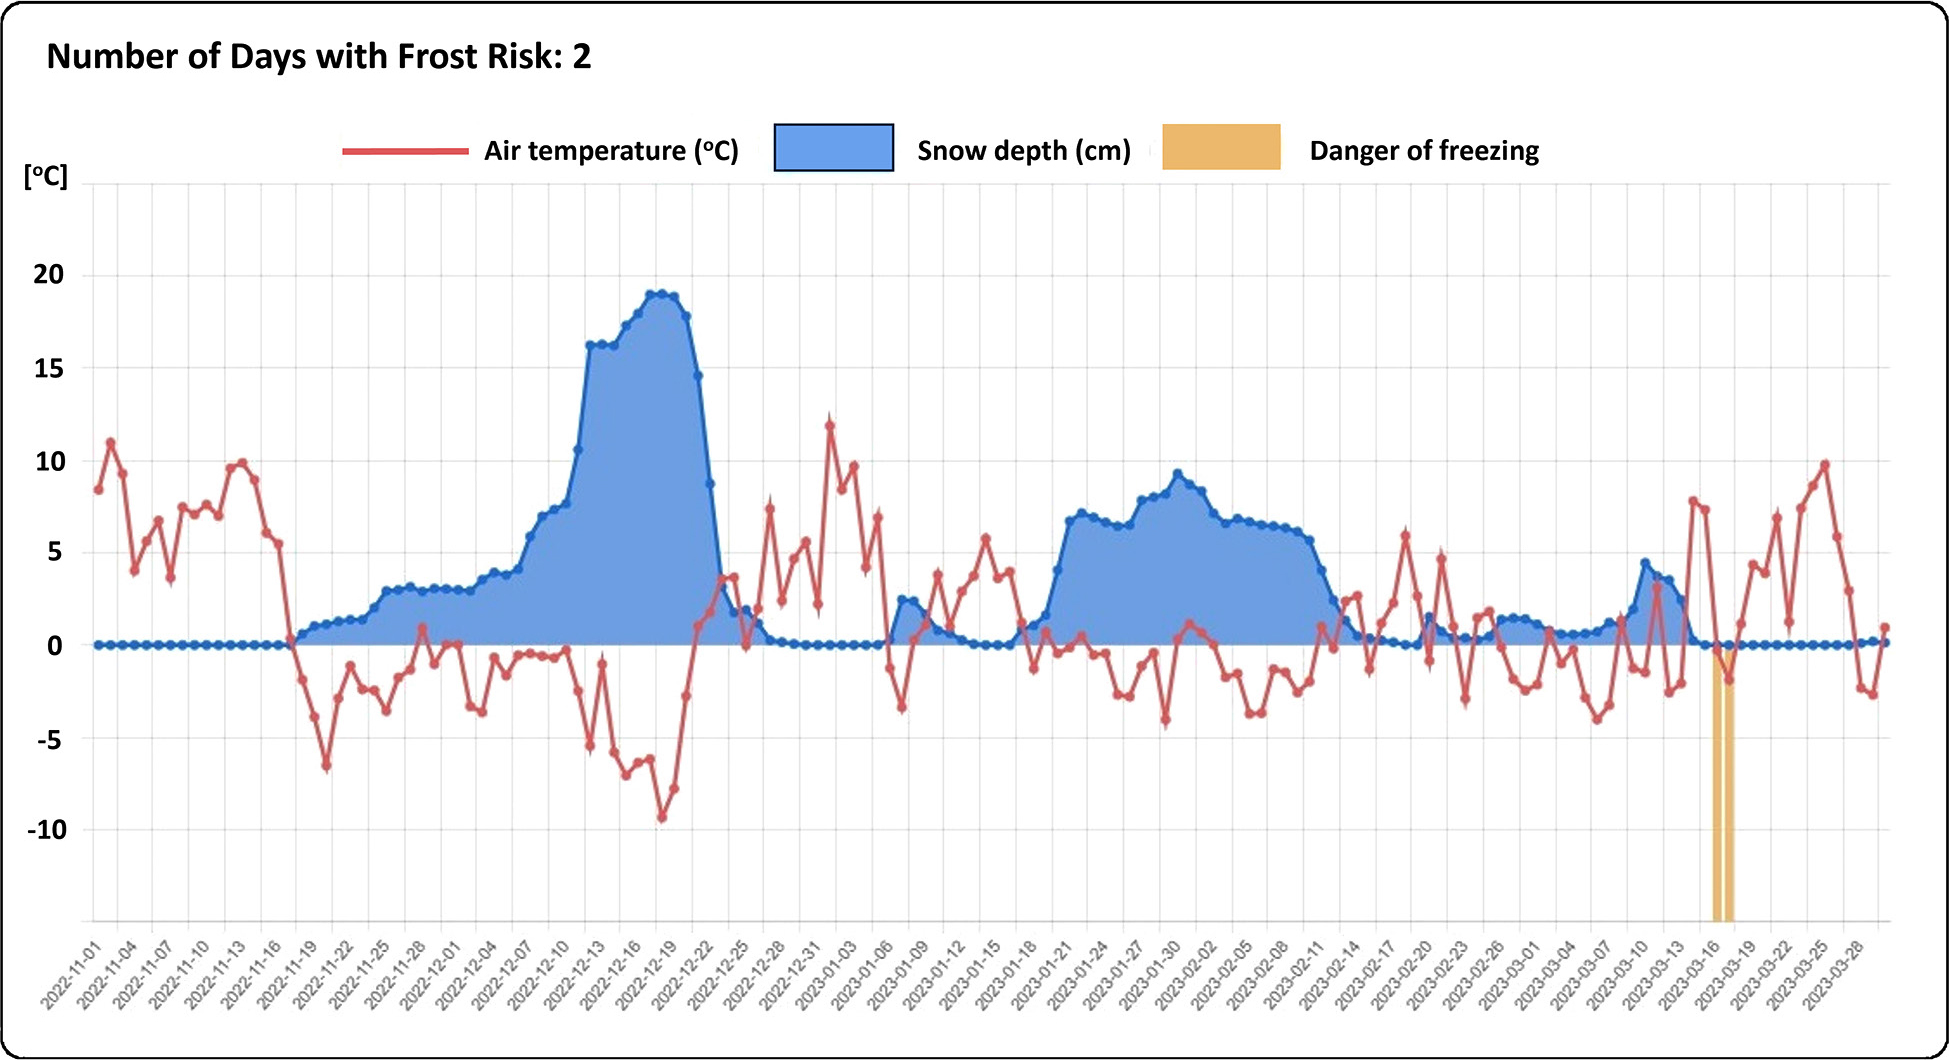
Fig. 8.
Diagram showing the dangers of freezing in the grassland plot available in application.