
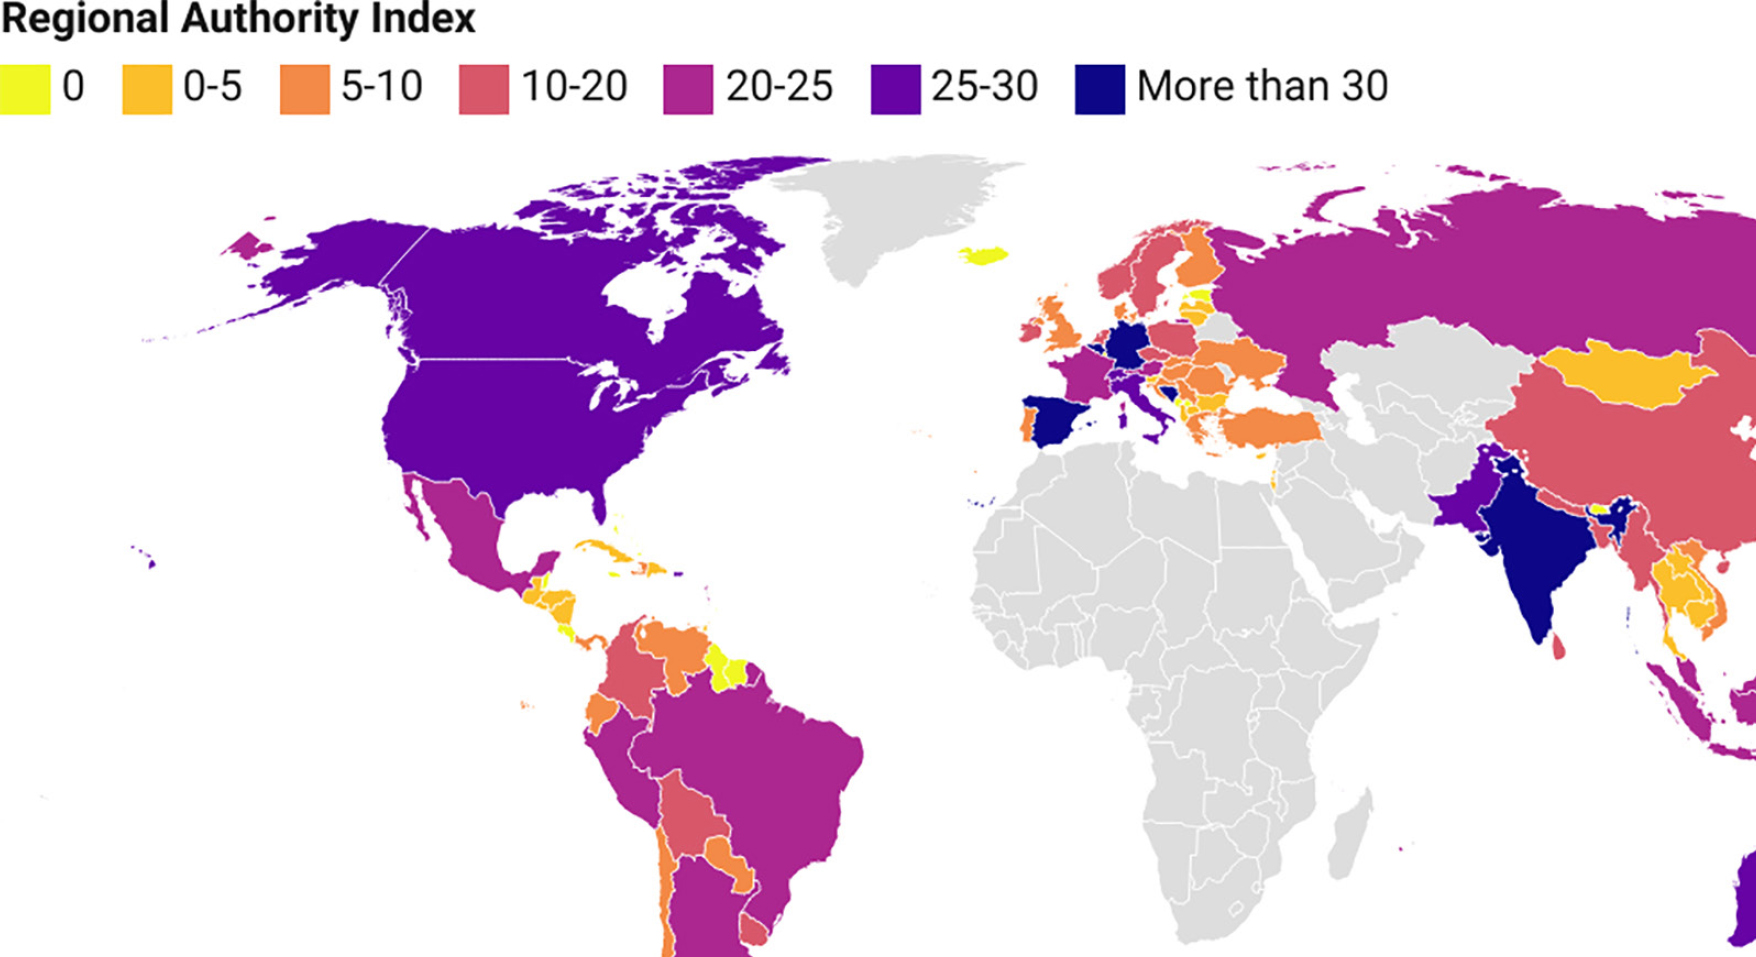
Fig. 1.
The degree of decentralisation, measured by the Regional Authority Index in 2018, elaborated with data from Shair-Rosenfield et al. (2021) & Hooghe et al. (2016), created with Datawrapper.
Table 1.
Mean and median population, GDP and GDP per capita in high and low decentralised countries elaborated with RAI and World Bank data.
| Mean decentralisation | Median decentralisation | |||
|---|---|---|---|---|
| Low RAI 0–5 | High RAI >25 | Low RAI 0–5 | High RAI >25 | |
| Population | 936,621 | 32,100,000 | 390,353 | 25,000,000 |
| GDP (million USD)* | 7317.6 | 1,529,600 | 4856 | 1,400,000 |
| GDP per capita (USD)* | 12,340.72 | 40,207.92 | 5330.77 | 46,491.23 |
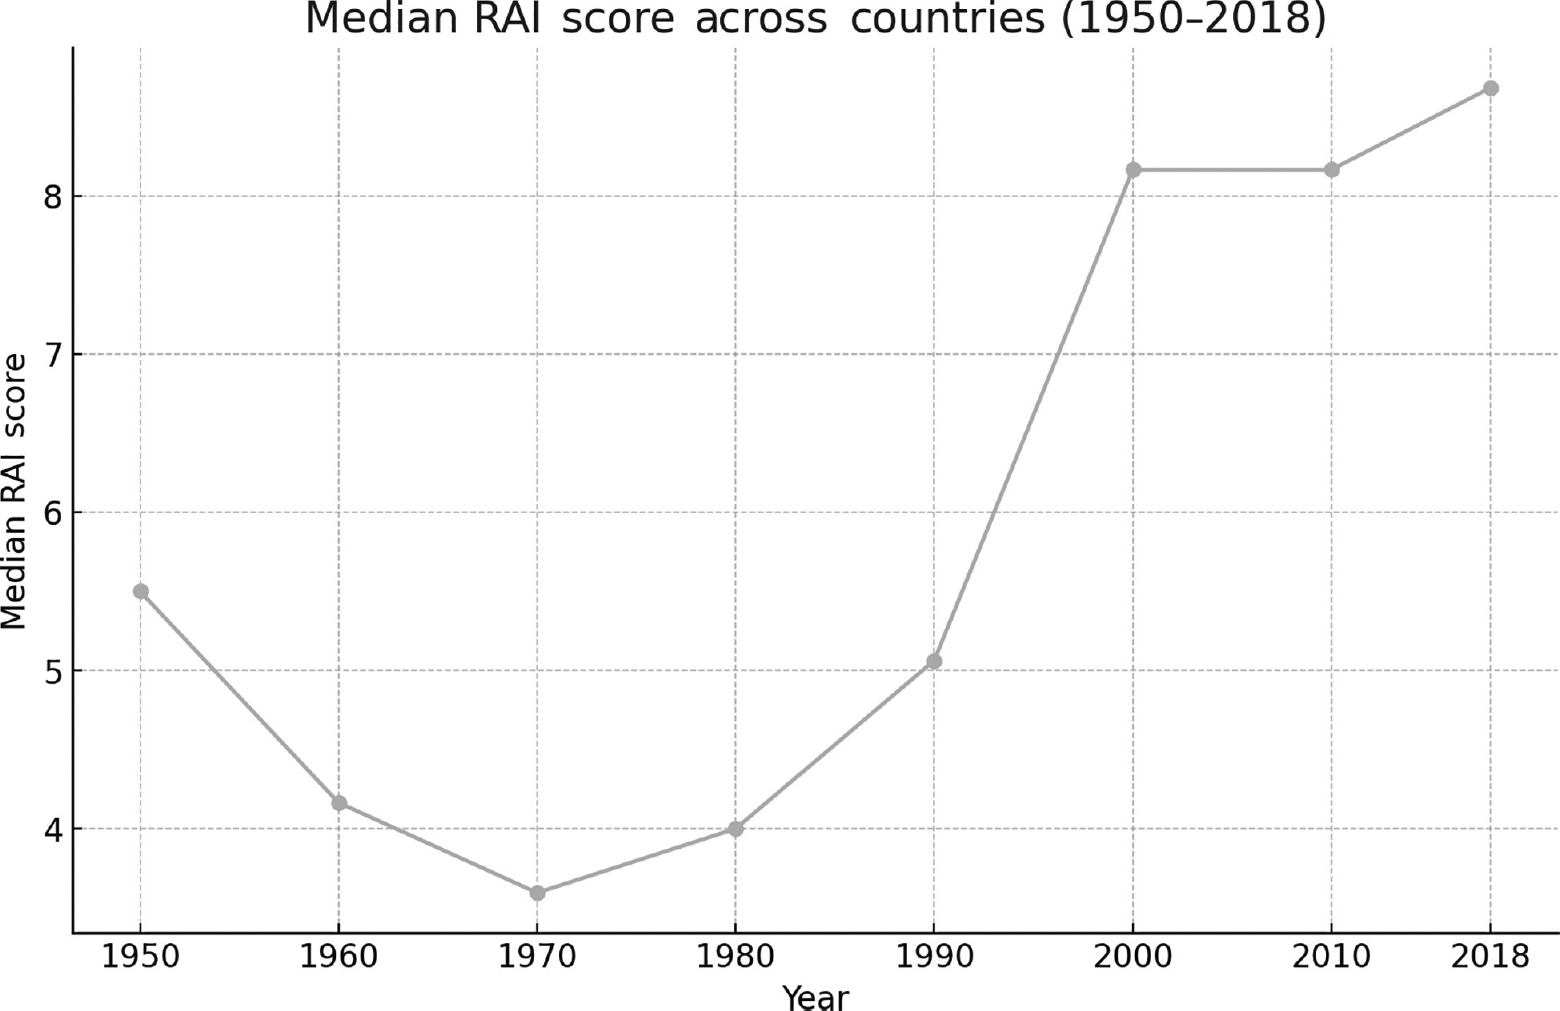
Fig. 2.
Evolution of the median level of decentralisation in the sample countries between 1950 and 2018, elaborated with data from Shair-Rosenfield et al. (2021) and Hooghe et al. (2016).
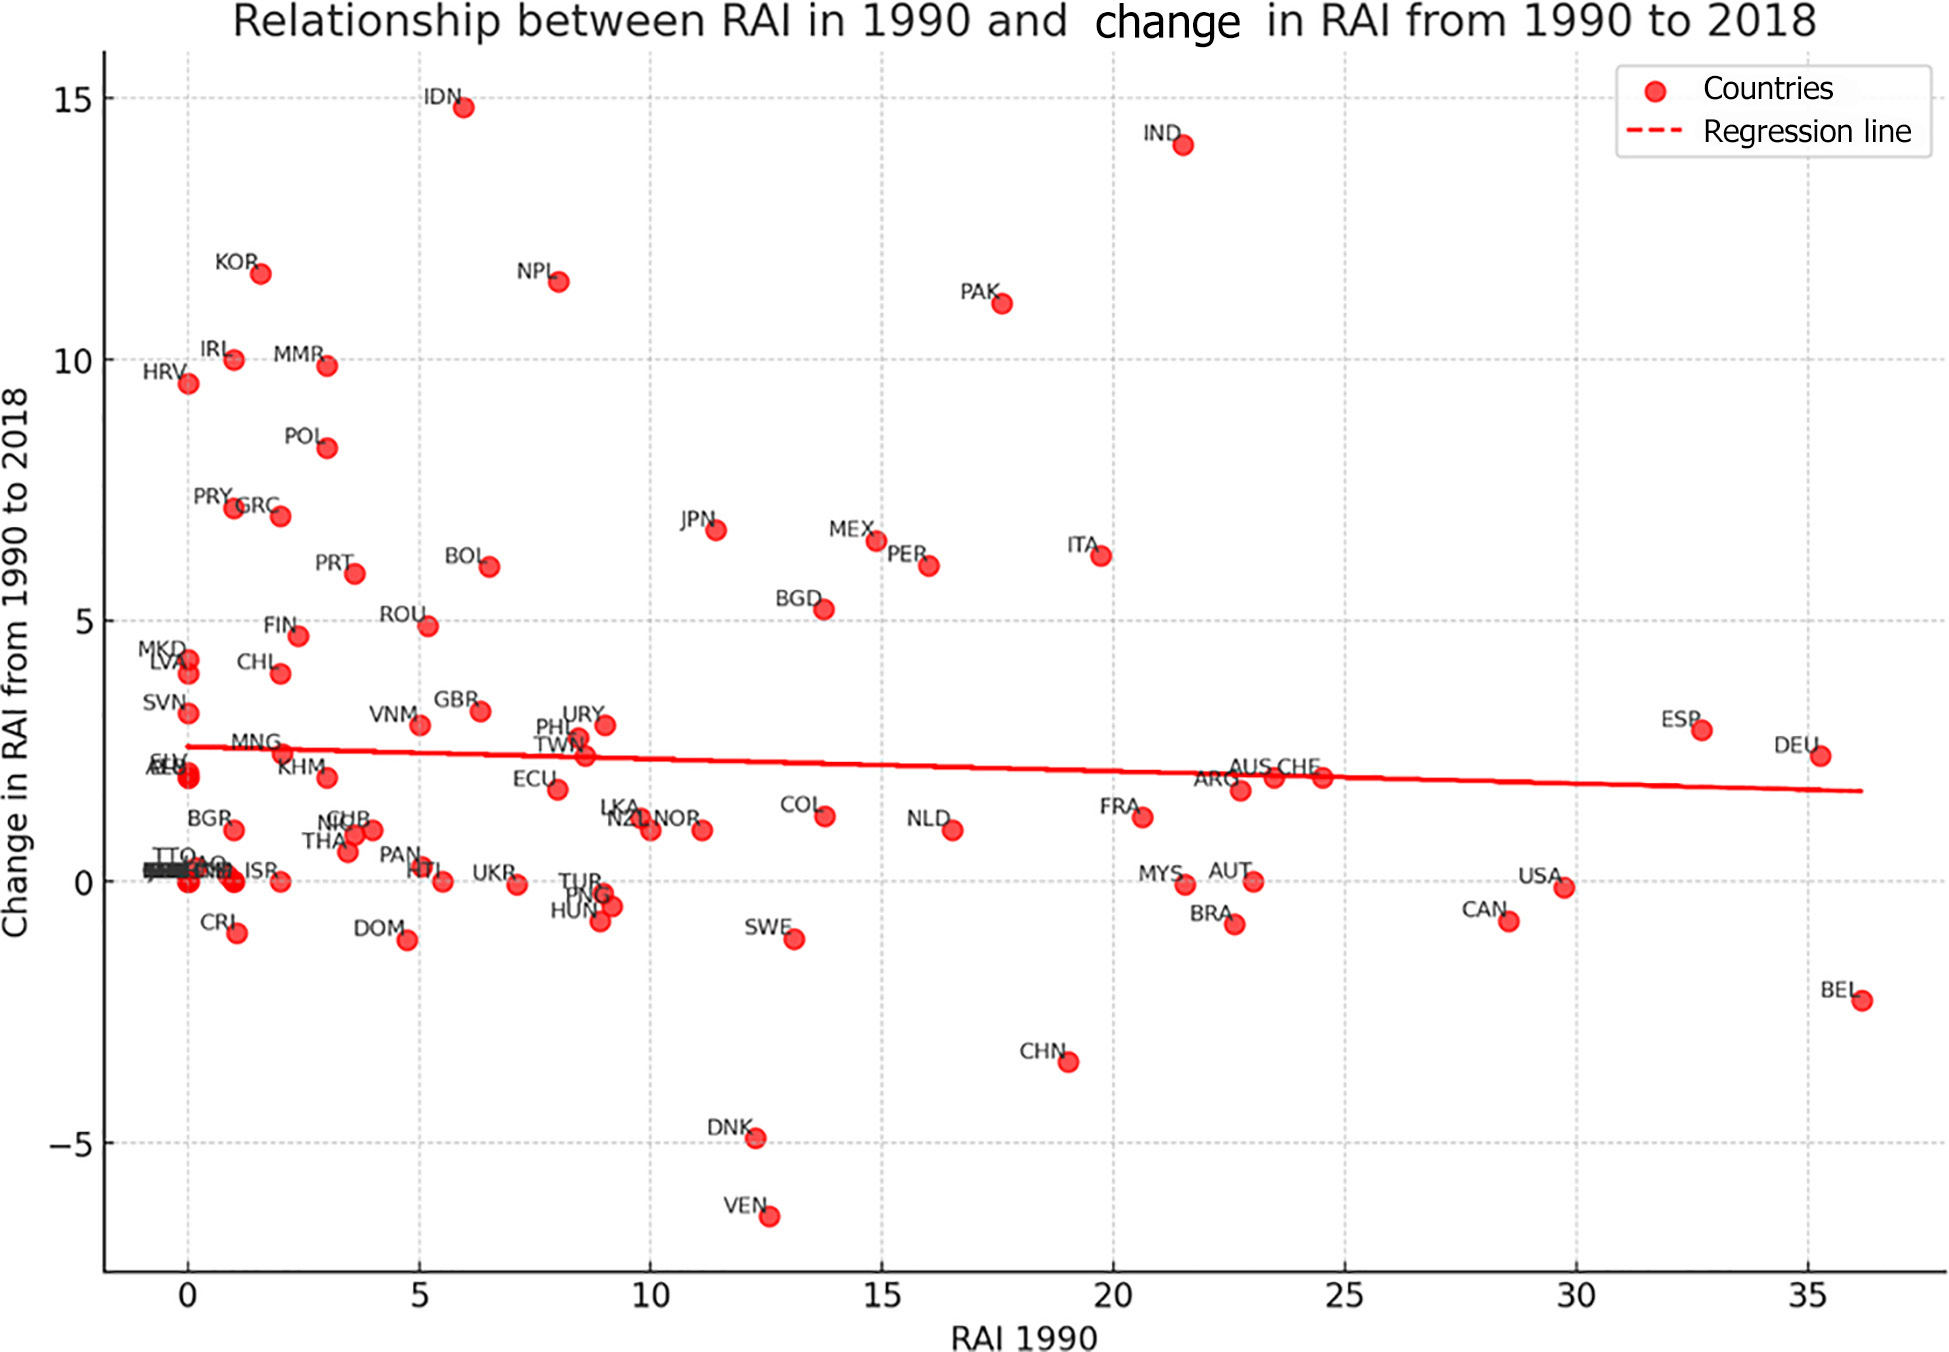
Fig. 3.
Changes in decentralisation relative to a country’s starting point on the decentralisation scale (1990–2018).