
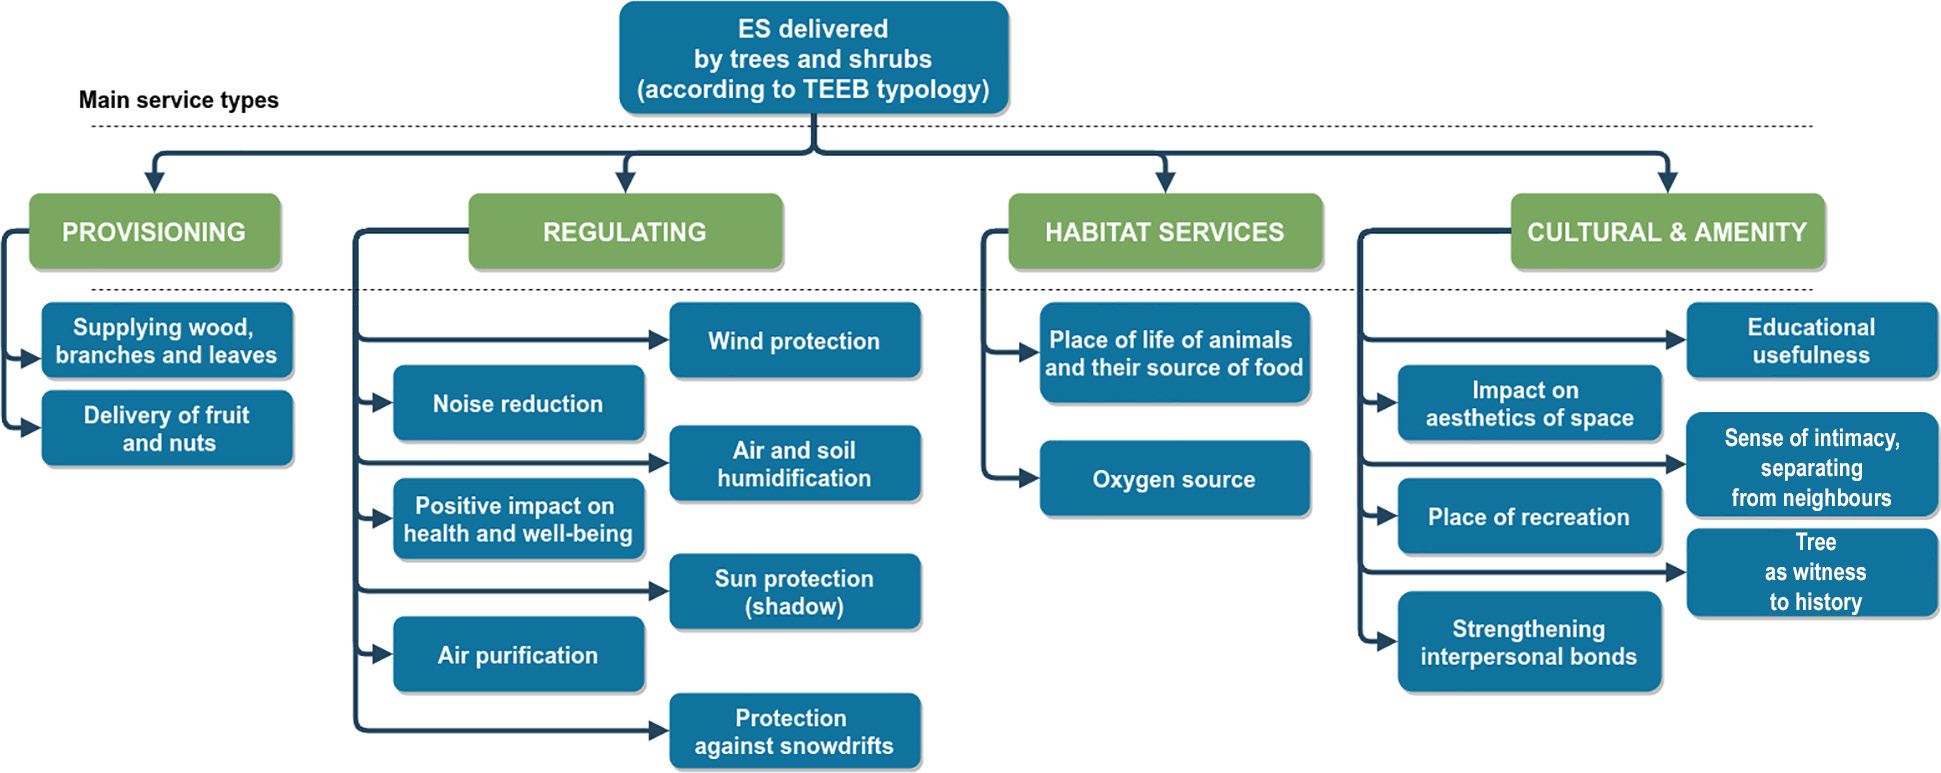
Fig. 1.
The list of the ecosystem services (ES) provided by trees investigated in the research. Source: own study.
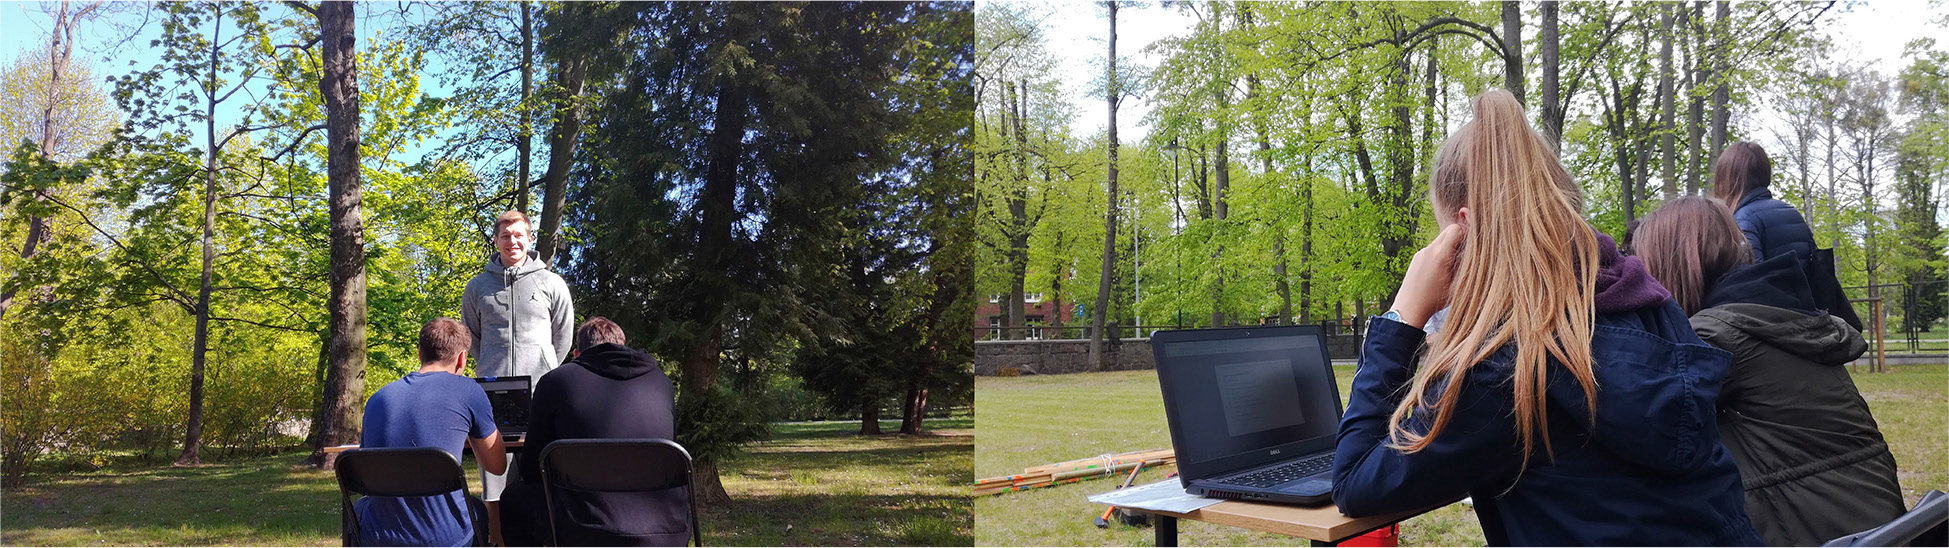
Photo 1.
Source: taken by the authors.
Table 1.
The number of questionnaires given by location.
| Outdoors | Indoors | Total | |||||
|---|---|---|---|---|---|---|---|
| Total outdoors | Male | Female | Total indoors | Male | Female | ||
| Gdańsk | 21 | 9 | 12 | 55 | 24 | 31 | 76 |
| Poznań | 20 | 7 | 13 | 22 | 6 | 16 | 42 |
| Total | 41 | 16 | 25 | 77 | 30 | 47 | 118 |
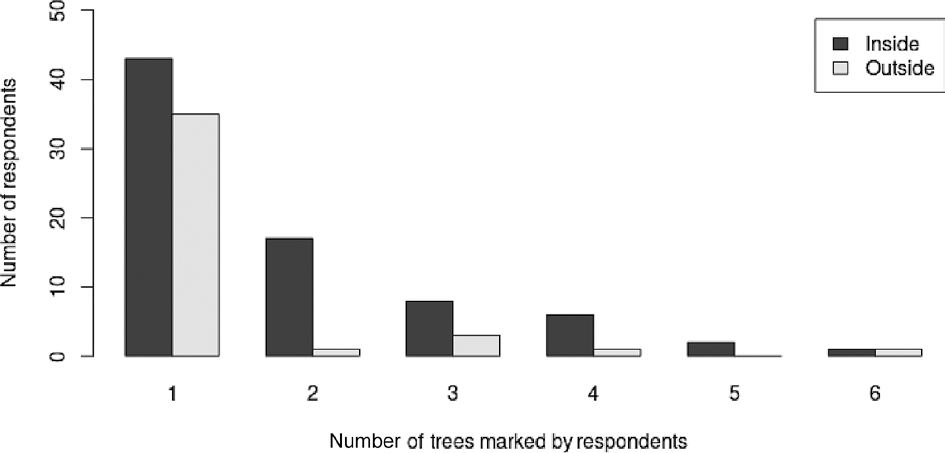
Fig. 2.
The number of trees identified by the respondents answering the questionnaire indoors or outdoors.
Source: own study.
Table 2.
The difference between the number of ecosystem services (ES) indicated indoors (IN) and outdoors (OUT) and the general number of ES in Gdańsk (Gda) and Poznań (Poz), expressed as a percentage of each ES imitated in a given group (IN/OUT/Gda/Poz).
| Ecosystem services | All trees | First tree | Difference between cities | |||||||||
|---|---|---|---|---|---|---|---|---|---|---|---|---|
| IN [%] | OUT [%] | Chi2 | P | IN [%] | OUT [%] | Chi2 | P | Gda [%] | Poz [%] | Chi2 | P | |
| Oxygen source | 11 | 11 | 0.010 | 0.920 | 12 | 12 | 0.598 | 0.439 | 10 | 11 | 0.789 | 0.374 |
| Wind protection | 6 | 6 | 0.162 | 0.687 | 6 | 6 | 0.507 | 0.476 | 5 | 8 | 3.165 | 0.075 |
| Delivery of fruit and nuts | 3 | 3 | 0.101 | 0.751 | 3 | 3 | 0.293 | 0.588 | 3 | 3 | 0.067 | 0.796 |
| Tree as witness to history | 2 | 2 | 0.100 | 0.752 | 2 | 2 | 0.839 | 0.360 | 3 | 2 | 0.159 | 0.690 |
| Supplying wood, branches and leaves | 1 | 2 | 0.089 | 0.765 | 1 | 2 | 0.614 | 0.433 | 2 | 1 | 0.479 | 0.489 |
| Noise reduction | 6 | 6 | 0.016 | 0.899 | 5 | 6 | 0.798 | 0.372 | 5 | 7 | 1.302 | 0.254 |
| Impact on aesthetics of space | 11 | 9 | 3.194 | 0.079 | 13 | 10 | 1.013 | 0.314 | 11 | 9 | 2.739 | 0.098 |
| Educational usefulness | 2 | 3 | 1.591 | 0.207 | 1 | 3 | 3.514 | 0.061 | 2 | 3 | 0.419 | 0.517 |
| Sense of intimacy, separating from neighbours | 5 | 3 | 1.790 | 0.181 | 4 | 4 | 0.031 | 0.861 | 5 | 3 | 1.070 | 0.301 |
| Positive impact on health and well-being | 9 | 9 | 0.010 | 0.920 | 9 | 9 | 0.318 | 0.572 | 9 | 9 | 0.061 | 0.805 |
| Habitat and food source for animals | 7 | 7 | 0.026 | 0.872 | 6 | 7 | 0.684 | 0.408 | 7 | 7 | 0.003 | 0.958 |
| Regulating air humidity and soil moisture | 5 | 5 | 0.256 | 0.613 | 5 | 5 | 0.147 | 0.701 | 5 | 5 | 0.027 | 0.869 |
| Strengthening interpersonal bonds | 4 | 3 | 0.849 | 0.357 | 4 | 3 | 0.000 | 0.997 | 4 | 3 | 0.361 | 0.548 |
| Air purification | 9 | 10 | 0.265 | 0.607 | 10 | 10 | 0.648 | 0.421 | 9 | 10 | 0.436 | 0.509 |
| Protection against snowdrifts | 2 | 1 | 0.987 | 0.320 | 2 | 1 | 0.773 | 0.379 | 2 | 2 | 0.038 | 0.845 |
| Place of recreation | 9 | 9 | 0.016 | 0.899 | 8 | 8 | 0.754 | 0.385 | 9 | 9 | 0.001 | 0.973 |
| Sun protection (shade) | 8 | 10 | 0.276 | 0.599 | 8 | 10 | 1.579 | 0.108 | 8 | 10 | 1.149 | 0.284 |
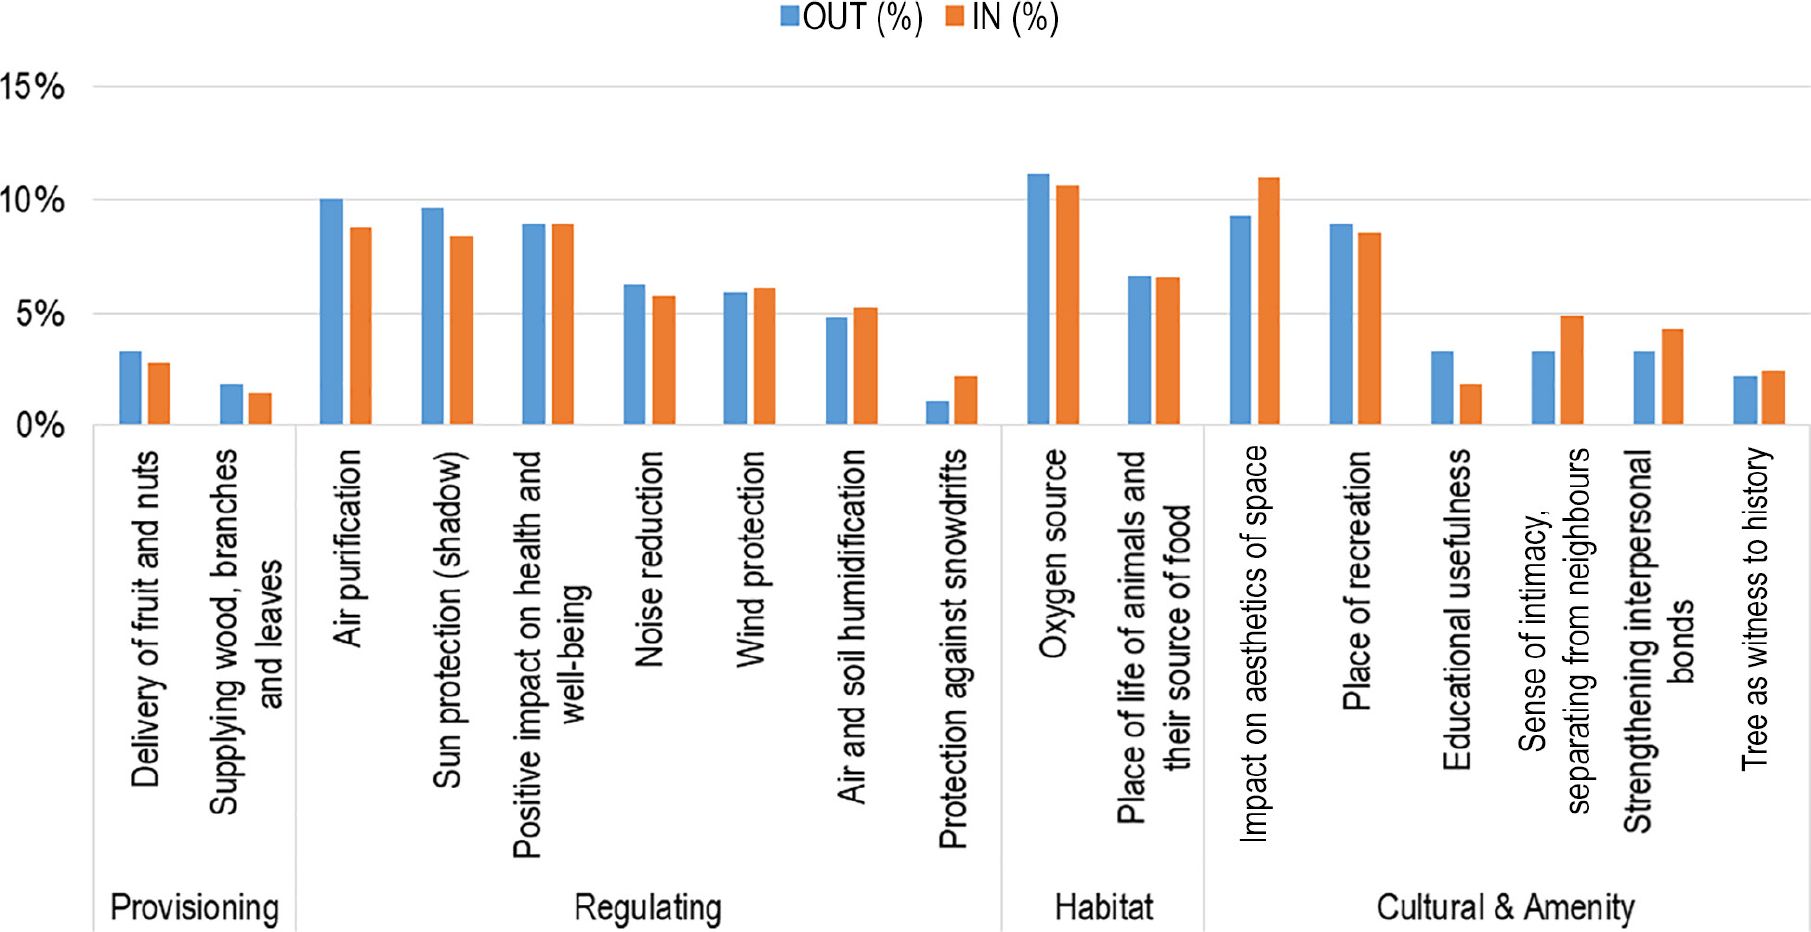
Fig. 3.
The number of ES indications for IN and OUT locations, for all trees indicated. Source: own study.
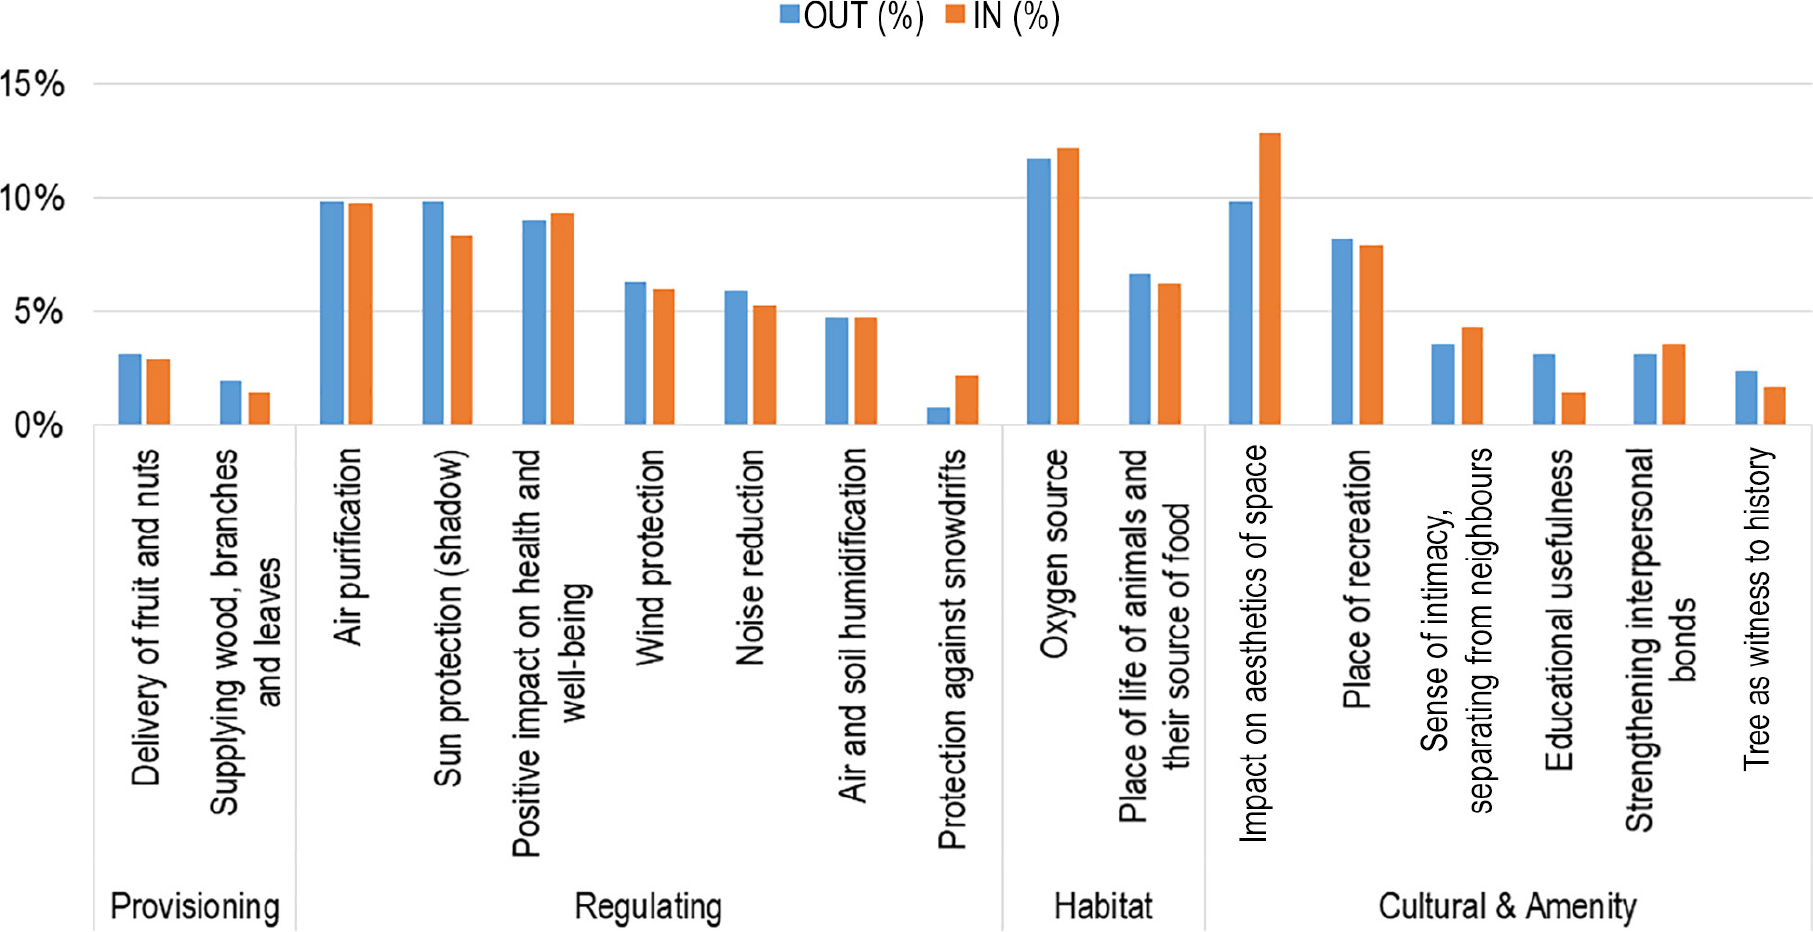
Fig. 4.
The number of ES indications for IN and OUT locations, for the first tree indicated. Source: own study.