
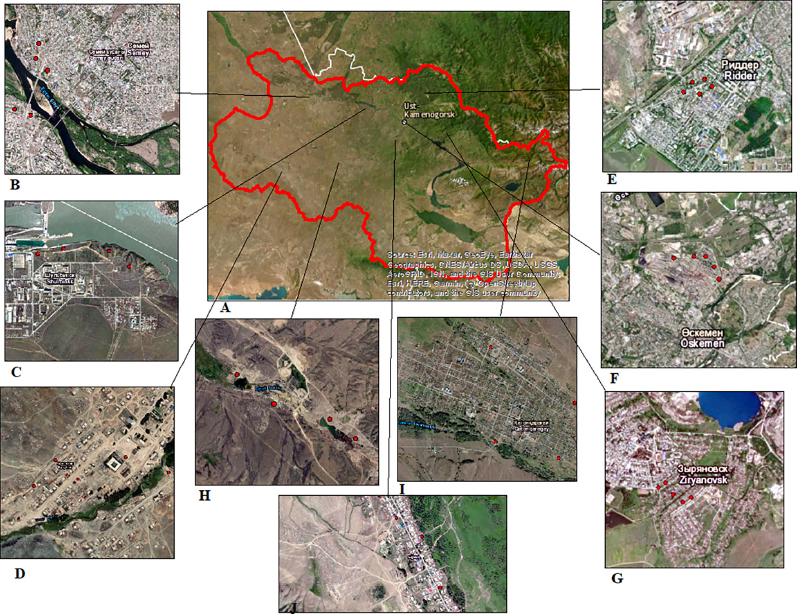
Fig. 1.
Soil sampling points map. A – Map of Yertis River basin within Eastern Kazakhstan, B – Ust-Kamenogorsk, C – Ridder, D – Altay (Zyryanovsk).
Table 1.
Spectral indices.
| No | Name of indexes | Index formulas |
|---|---|---|
| 1 | Clay minerals | Claymineralsratio = SWIR_1/SWIR_2 |
| 2 | Iron oxides | IronOxideRatio = Red/Blue |
| 3 | Carbonates | Carbonateratio = TIRS_1/TIRS_2 |
Table 2.
Statistical parameters of the content of elements in the soils of the basin.
| Parameters | X±Sx | lim | σ | CV, % | n |
|---|---|---|---|---|---|
| Cu | 12.809±3.155 | 0.14–48.3 | 14.104 | 110.1 | 15 |
| Zn | 15.98±3.747 | 0.31–65.6 | 16.748 | 104.8 | 15 |
| Pb | 22.036±4.395 | 0.16–98.9 | 19.648 | 89.2 | 15 |
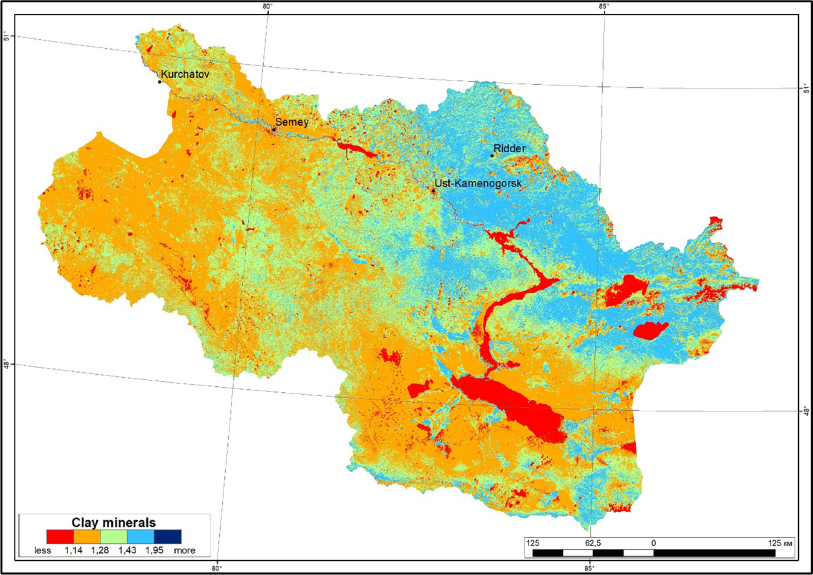
Fig. 2.
Distribution of clay minerals in the territory of the Yertis River basin within Eastern Kazakhstan.
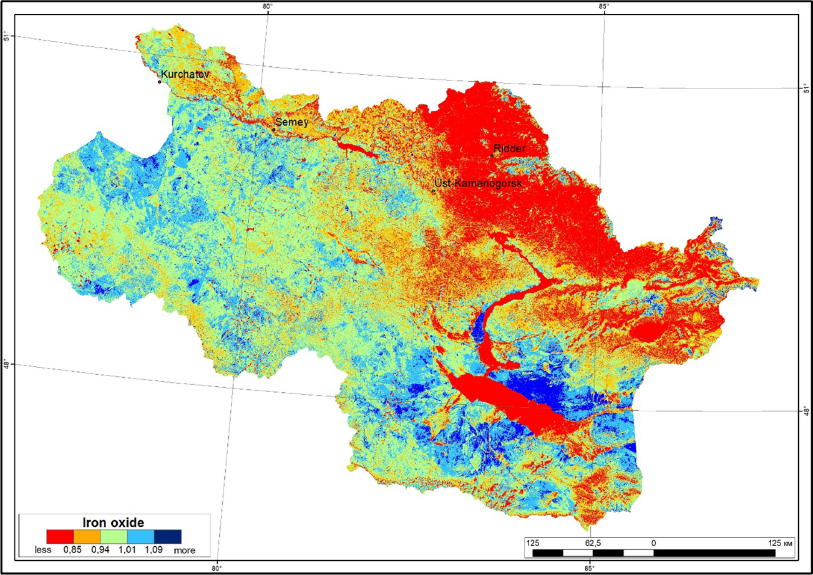
Fig. 3.
Distribution of iron oxides on the territory of the Yertis River basin within Eastern Kazakhstan.
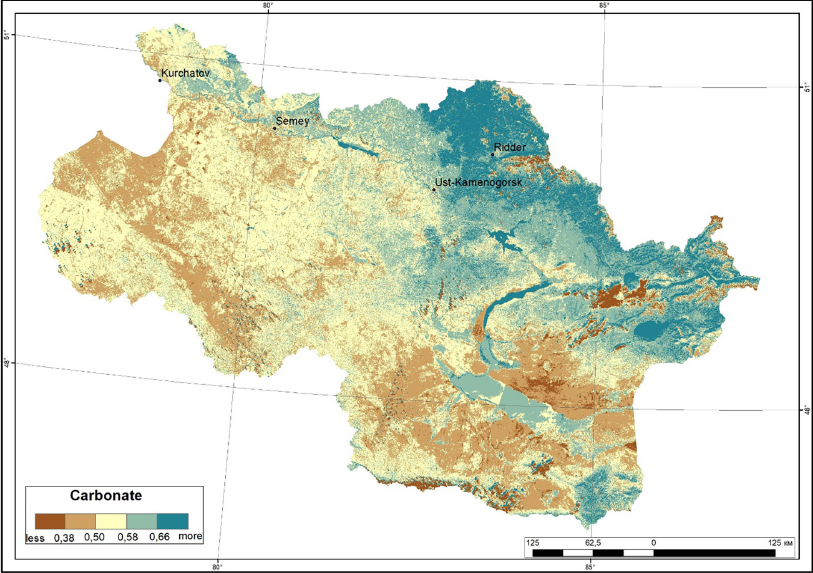
Fig. 4.
Distribution of carbonates on the territory of the Yertis River basin within Eastern Kazakhstan