
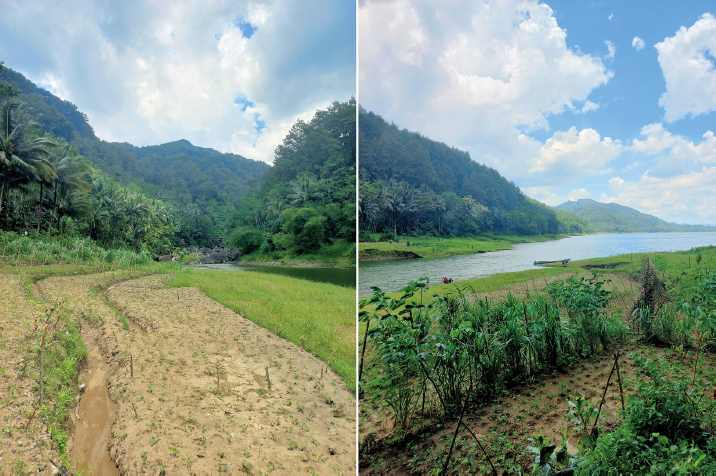
Fig. 1.
Agricultural activities around the inlet of the Sempor Reservoir.
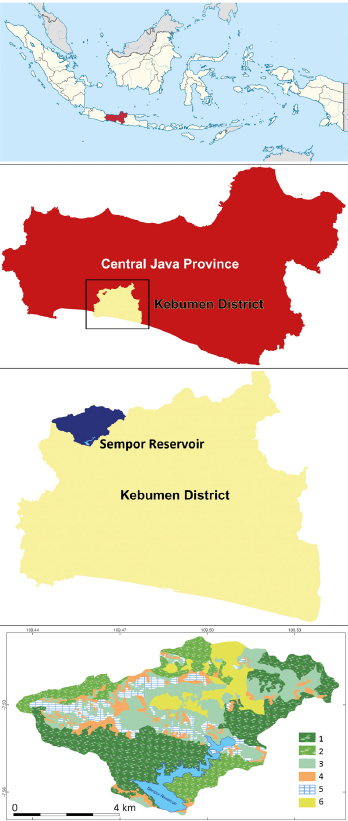
Fig. 2.
Study area. Legend for land cover: 1 – conservation forest, 2 – plantation forest, 3 – mixed cropland, 4 – settlement, 5 – paddy rice, 6 – dryland farming.
Table 1.
List of data used in this study.
| Data | Data source |
|---|---|
| Depth of reservoir (2023) | Field survey |
| Sediment’s specific gravity (2023) | Field survey |
| Digital elevation model | Indonesia Geospatial Information Agency |
| Land-use data (2020) | Indonesia Geospatial Information Agency |
| Rainfall data at Sempor, Sampang, Somagede and Kedungwringin Stations (2009–2020) | Water Resources Management Center for Progo-Bogowonto-Luk Ulo; Main Station of Serayu-Opak River Basin |
Table 2.
Parameters for sedimentation rate formulation.
| Parameter | Equation |
|---|---|
| Trap efficiency TE [%] | |
| Sediment yield G [t·a-1] | G = SDR × Ea |
Table 3.
Rainfall erosivity (R) in the Sempor Reservoir Catchment Area based on rainfall weighting.
| Rain station | Rainfall erosivity [R] | Area [km2] | R × Area |
|---|---|---|---|
| Kedungwringin | 2,467.21 | 16.18 | 39,915.92 |
| Sampang | 2,437.48 | 18.27 | 44,527.47 |
| Sempor | 2,176.53 | 3.85 | 8,390.13 |
| Somagede | 2,828.84 | 2.33 | 6,601.82 |
| Total | 40.63 | 99,435.35 | |
| Rainfall erosivity (R) of the reservoir catchment area [MJ mm ha−1 h−1 a−1] | 2,447.04 | ||
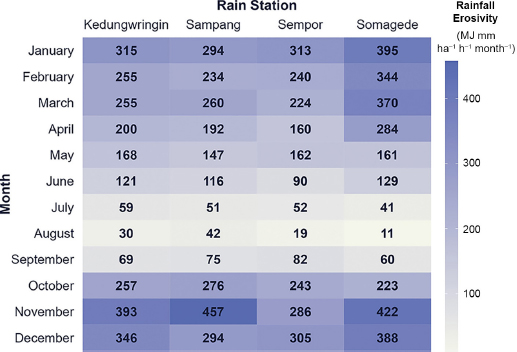
Fig. 3.
Monthly rainfall erosivity of the Sempor Reservoir Catchment Area.
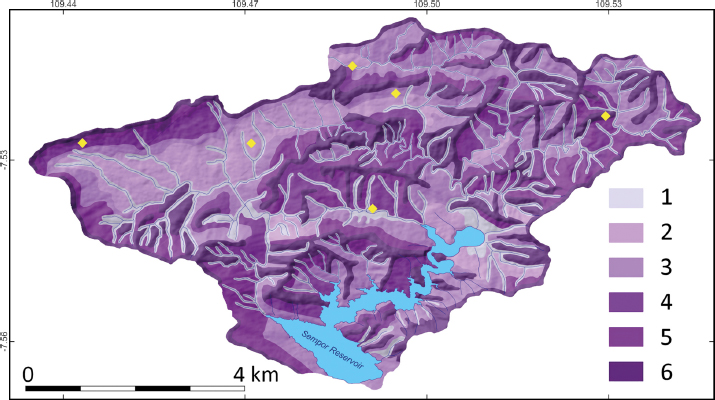
Fig. 4.
Landform map and soil sampling points in the Sempor Reservoir Catchment Area. Explanation: yellow squares marked soil samples, landforms: 1 – river valley, 2 – colluvial plain, 3 – lower slope, 4 – middle slope, 5 – upper slope, 6 – hillcrest. Data source: field survey and laboratory analysis by Fitryady (2008) and Rachma (2019).
Table 4.
Soil erodibility (K) in the Sempor Reservoir Catchment Area.
| Landform | Texture [%] | M | a | b | c | K | ||
|---|---|---|---|---|---|---|---|---|
| Sand | Silt | Clay | ||||||
| River valley | 31 | 37 | 32 | 4,624 | 4.31 | 3 | 4 | 0.39 |
| Colluvial plain | 27 | 64 | 7 | 8,463 | 3.12 | 2 | 4 | 0.76 |
| Lower slope | 25 | 36 | 39 | 3,691 | 4.05 | 3 | 1 | 0.23 |
| Middle slope | 20 | 72 | 8 | 8,464 | 2.62 | 2 | 5 | 0.83 |
| Upper slope | 44 | 31 | 25 | 5,625 | 3.86 | 2 | 2 | 0.38 |
| Hillcrest | 10 | 20 | 70 | 873 | 4.50 | 3 | 4 | 0.12 |
Table 5.
LS classification in the Sempor Reservoir Catchment Area.
| Slope [%] | Slope classification | Length and steepness LS | Area [ha] | Percentage [%] |
|---|---|---|---|---|
| 5–15 | II | 1.20 | 307.59 | 7.57 |
| 15–35 | III | 4.25 | 1,178.64 | 29.01 |
| 35–50 | IV | 9.50 | 1,501.23 | 36.94 |
| >50 | V | 12.00 | 1,076.03 | 26.48 |
| Total | 4,063.50 | 100.00 |
Table 6.
CP in the Sempor Reservoir Catchment Area.
| Land use | C | Conservation management | P | Crop management and soil conservation CP | Area [ha] | Percentage [%] |
|---|---|---|---|---|---|---|
| Conservation forest | 0.001 | No conservation | 1.00 | 0.001 | 1,373.11 | 33.8 |
| Plantation forest | 0.2 | No conservation | 1.00 | 0.2 | 627.66 | 15.4 |
| Mixed cropland | 0.1 | No conservation | 1.00 | 0.1 | 957.50 | 23.6 |
| Settlement | 1 | No conservation | 1.00 | 1 | 378.06 | 9.3 |
| Paddy field | 0.01 | Traditional terraces | 0.40 | 0.004 | 291.32 | 7.2 |
| No conservation | 1.00 | 0.01 | 37.92 | 0.9 | ||
| Dryland farming | 0.7 | Contour farming (9–20%) | 0.75 | 0.525 | 130.47 | 3.2 |
| Contour farming (>20%) | 0.90 | 0.63 | 267.46 | 6.6 | ||
| Total | 4063.50 | 100.0 | ||||
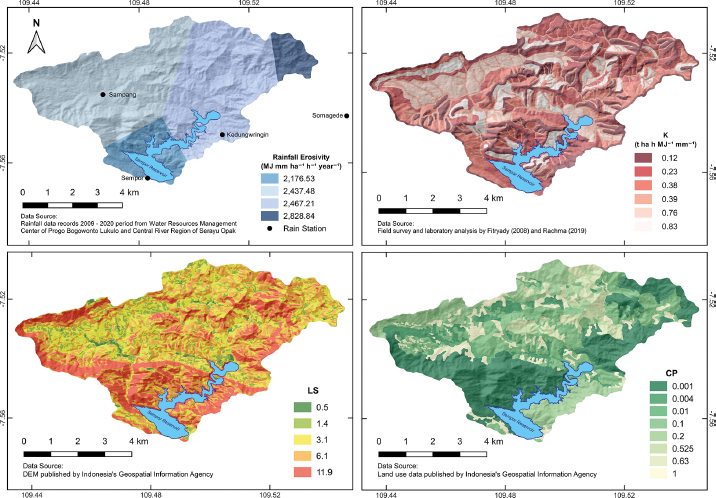
Fig. 5.
Parameters used in estimating erosion potential with the USLE model.
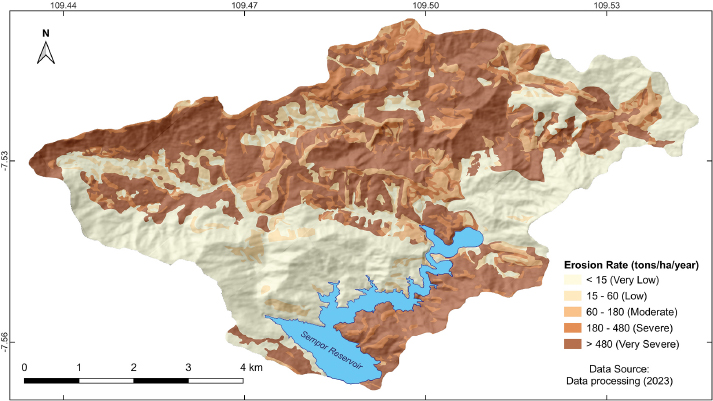
Fig. 6.
Annual erosion rate distribution in the Sempor Reservoir Catchment Area using the USLE model.
Table 7.
Distribution of erosion susceptibility in the Sempor Reservoir catchment.
| Susceptibility level | Erosion rate [t · ha-1 · a-1] | Area [km2] | Percentage [%] |
|---|---|---|---|
| Very low | <15 | 16.098 | 39.62 |
| Low | 15–60 | 3.820 | 9.40 |
| Moderate | 60–180 | 5.002 | 12.31 |
| Severe | 180–480 | 6.157 | 15.15 |
| Very severe | >480 | 9.559 | 23.52 |
| Total | 40.635 | 100.00 |
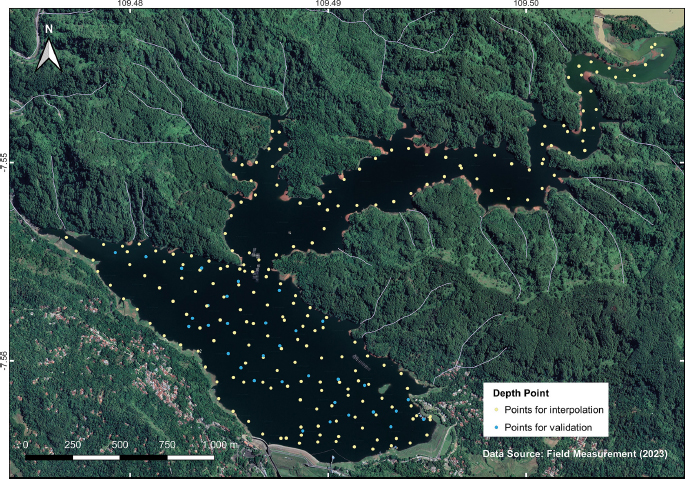
Fig. 7.
Echo sounding measurement points to record the depth of the Sempor Reservoir.
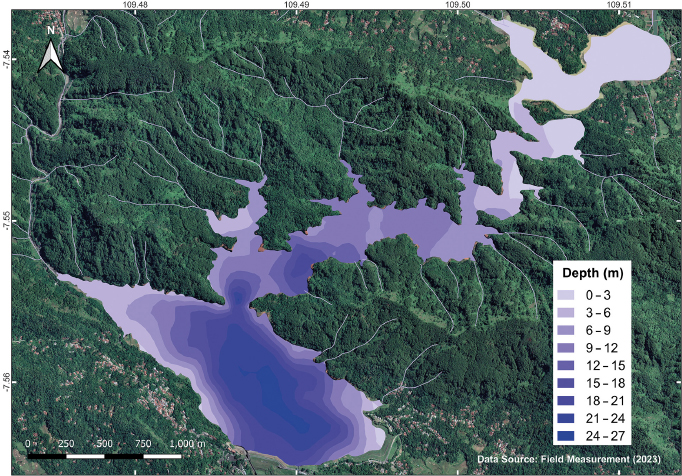
Fig. 8.
Depth contour of the Sempor Reservoir interpolated using empirical Bayesian kriging.
Table 8.
Monthly discharge of the Sempor Reservoir.
| Month | Monthly discharge [mln m3 · month-1] | |||||
|---|---|---|---|---|---|---|
| 2017 | 2018 | 2019 | 2020 | 2021 | Average | |
| January | 16.550 | 14.309 | 17.586 | 13.622 | 17.695 | 15.952 |
| February | 11.238 | 15.589 | 9.324 | 12.242 | 15.549 | 12.788 |
| March | 4.765 | 14.807 | 10.392 | 20.843 | 9.117 | 11.985 |
| April | 11.047 | 8.404 | 2.685 | 6.525 | 7.566 | 7.245 |
| May | 1.168 | 0.716 | 1.713 | 8.857 | 9.502 | 4.391 |
| June | 0.884 | 2.237 | 0.094 | 2.039 | 3.228 | 1.696 |
| July | 0.009 | 0.922 | 0.033 | 0.386 | 5.191 | 1.308 |
| August | 0.292 | 0.010 | 0.596 | 0.581 | 0.317 | 0.359 |
| September | 2.000 | 0.009 | – | 0.973 | 1.482 | 1.116 |
| October | 4.415 | 0.003 | 0.033 | 24.668 | 4.568 | 6.737 |
| November | 10.140 | 11.840 | 1.071 | 26.127 | 10.569 | 11.949 |
| December | 13.430 | 0.229 | 3.768 | 18.865 | 15.547 | 10.368 |
| Annually discharge [mln m3·a-1) | 85.897 | |||||
Table 9.
Trap efficiency (TE) of the Sempor Reservoir.
| Reservoir capacity [m3] | Annually discharge [mln m3 · a-1] | TE [%] |
|---|---|---|
| 23,090,500.45 | 85.897 | 90.09 |