
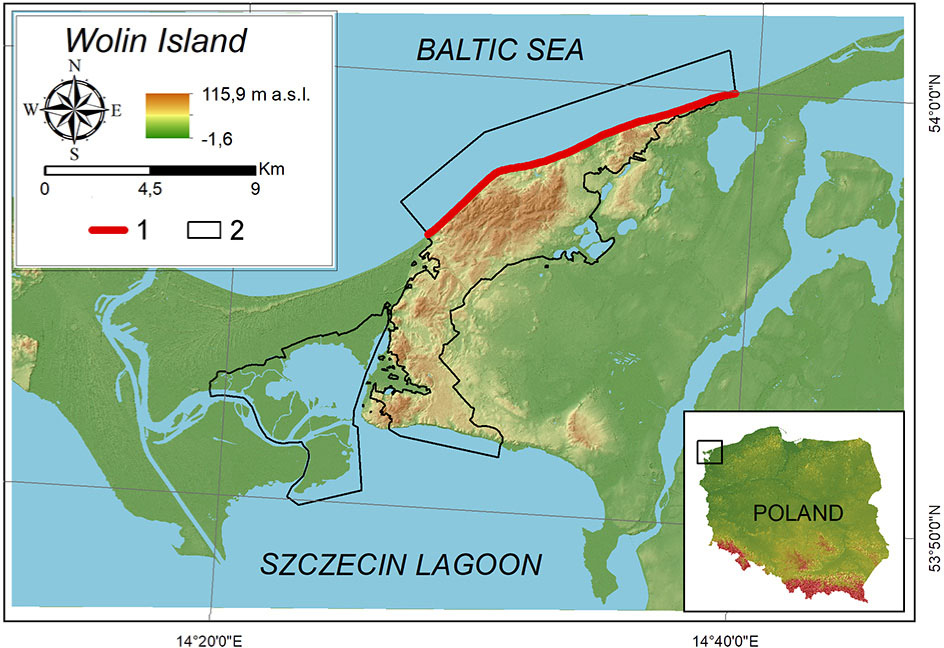
Fig. 1
Edge zone of Pomeranian Bay in the Wolin National Park – location of the research area; based on ISOKproject (2011).
1 – edge zone of the Pomeranian Bay, 2 – Wolin National Park.
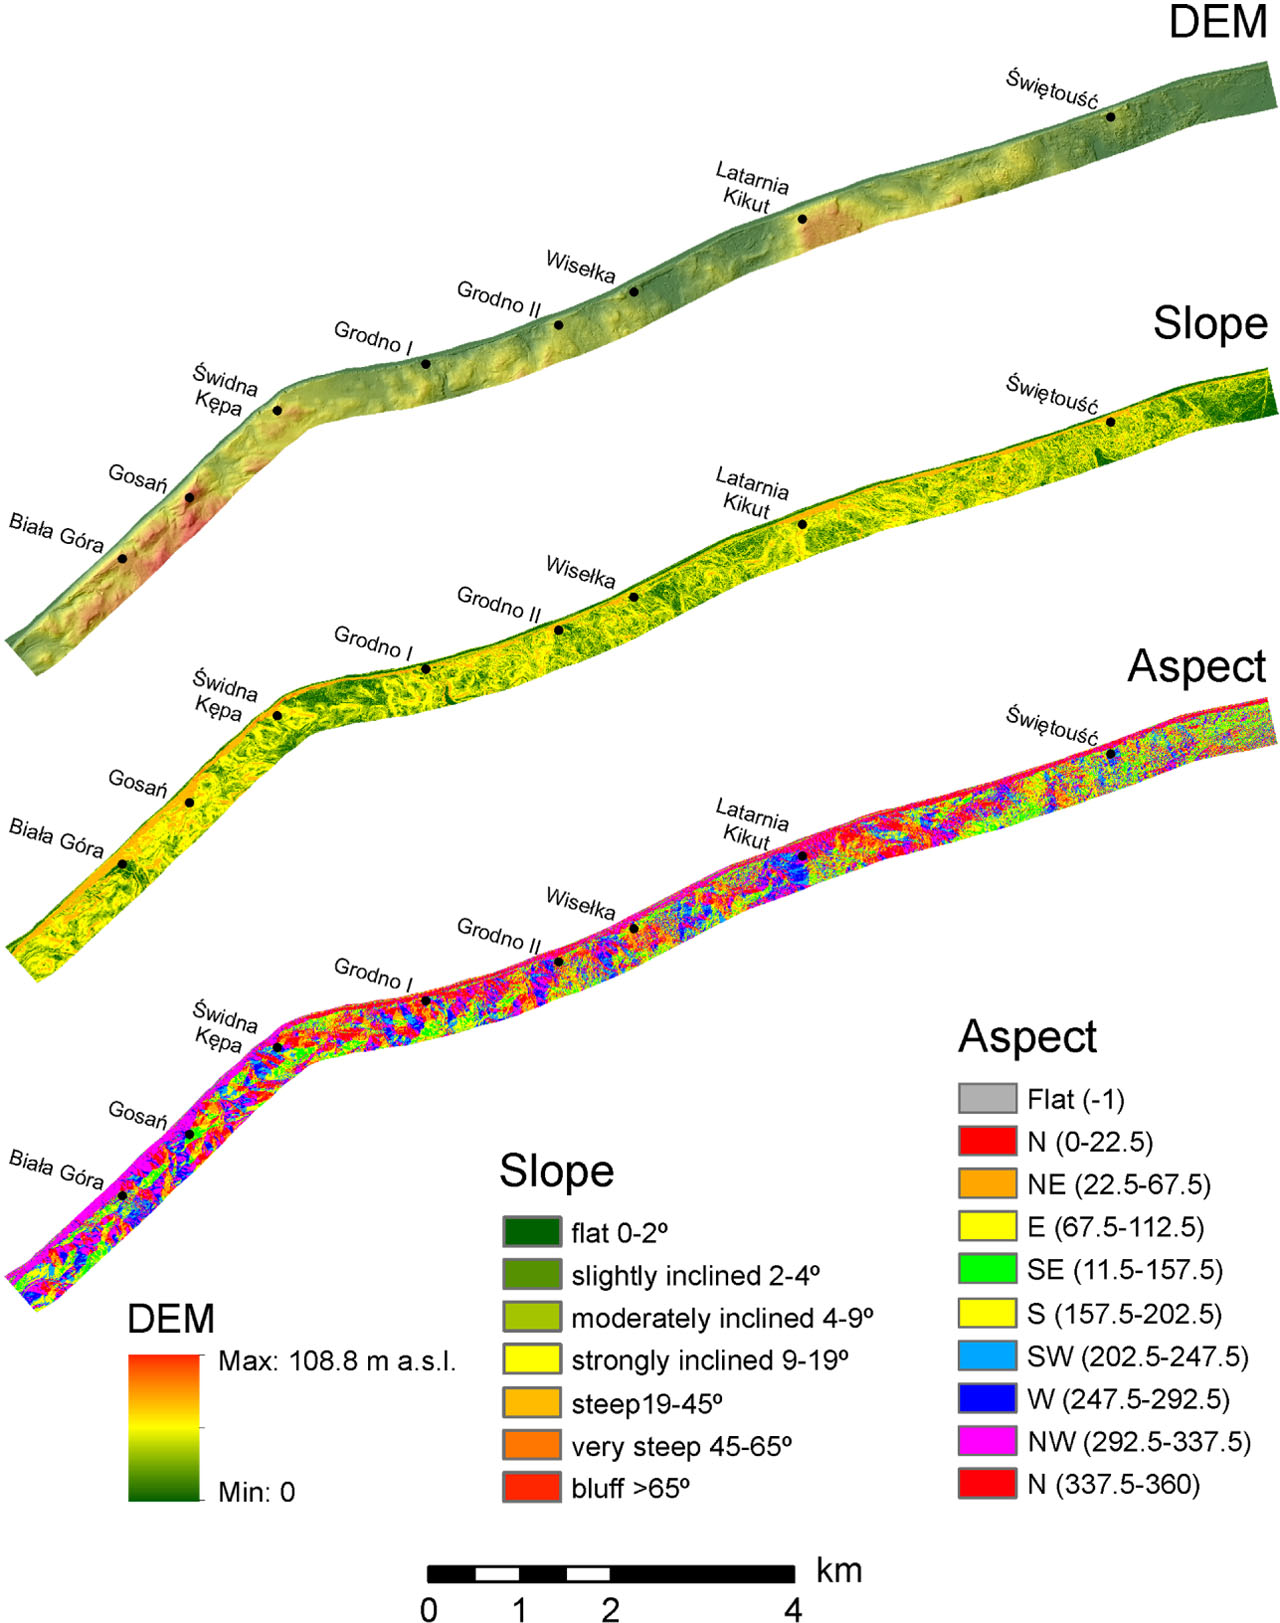
Fig. 2
Morphometric parameters of the Pomeranian Bay edge zone: terrain slopes and aspect based on digital elevation model (DEM) from ISOK project (2011).
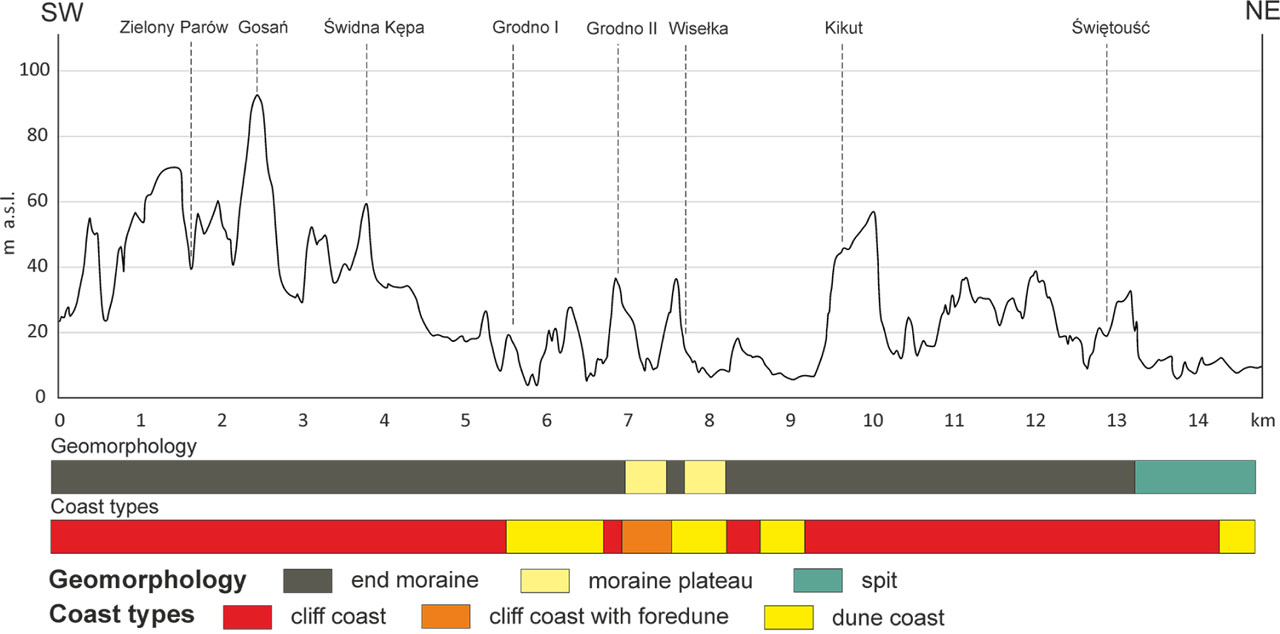
Fig. 3
Morphological profile of the Pomeranian Bay edge zone in the area of the Wolin National Park based on ISOK project (2011).
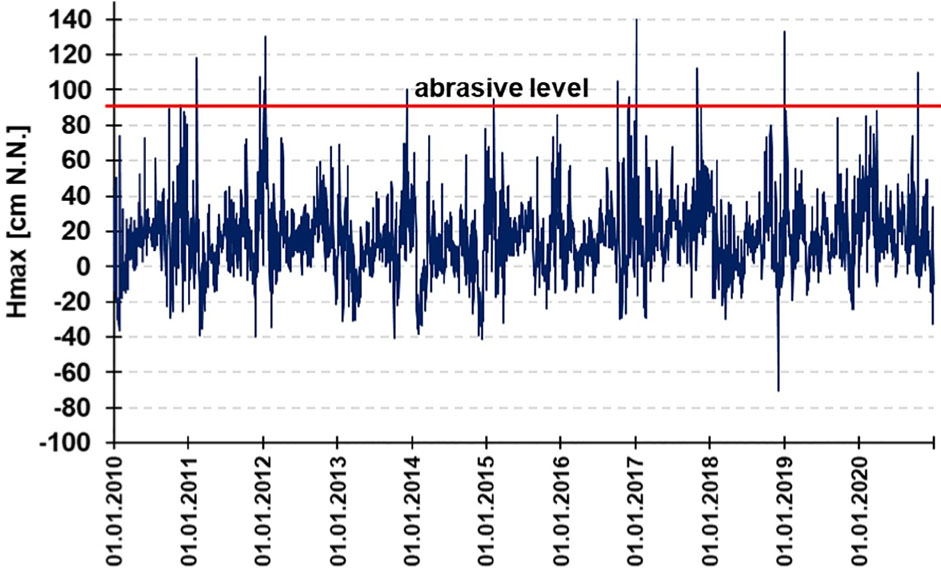
Fig. 4
Time distribution of abrasive level (maximum sea level Hmax>90 cm above N.N. – Normal Null sea level) generating the initiation of mass movements on the cliff coast of the Pomeranian Bay of the Wolin National Park; based on raw data of the Institute of Meteorology and Water Management in Warsaw.
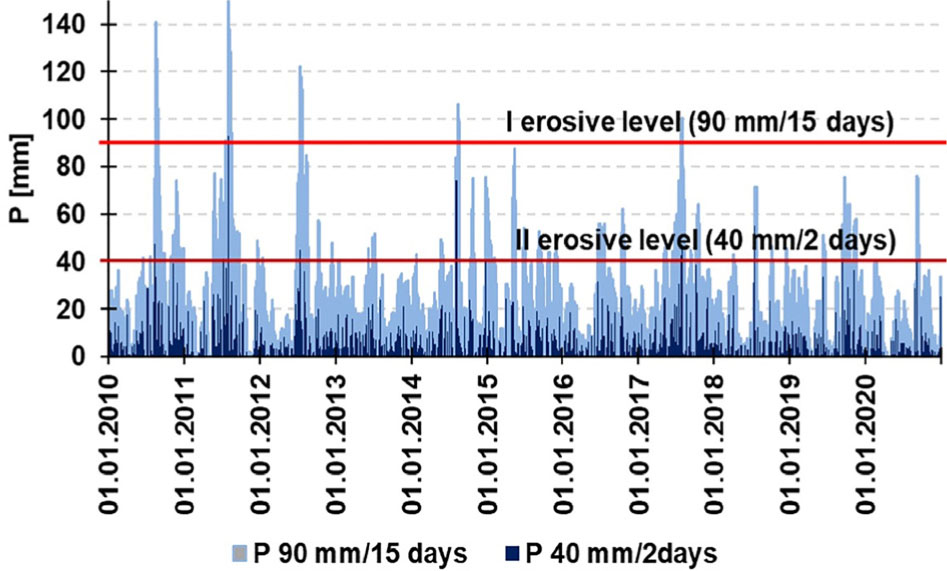
Fig. 5
Time distribution of threshold values of daily precipitation sums (P≥90 mm in 15 days and at this time P ≥40 mm in 2 days) generating the initiation of mass movements in the edge zone of the Pomeranian Bay of the Wolin National Park; based on the data from the meteorological station in Biała Góra.
Table 1
Annual average retreat of the cliff top and hydrometeorological erosive events' frequency in the 2010–2020 period on the Wolin National Park cliff coast.
| Parameter/year | 2010 | 2011 | 2012 | 2013 | 2014 | 2015 | 2016 | 2017 | 2018 | 2019 | 2020 | 2010–2020 |
|---|---|---|---|---|---|---|---|---|---|---|---|---|
| Average rate of the top cliff (m · a−1) on a 1.36 km cliff coast tested area | 0.25 | 0.10 | 0.25 | 0.12 | 0.09 | 0.24 | 0.10 | 0.07 | 0.06 | 0.14 | 0.14 | 0.14 |
| Events of abrasive sea level (days) | 0 | 3 | 5 | 0 | 2 | 1 | 0 | 4 | 3 | 1 | 1 | 20 |
| Events of erosive precipitation (days) | 0 | 3 | 2 | 0 | 0 | 0 | 0 | 2 | 0 | 0 | 0 | 7 |
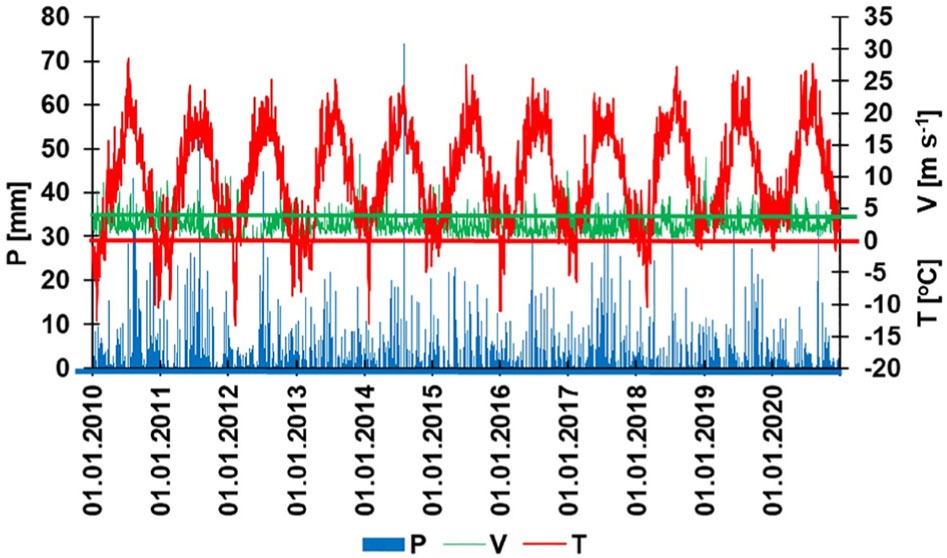
Fig. 6
Time distribution of threshold values of aeolian processes in the edge zone of the Pomeranian Bay of the Wolin National Park, (P represents daily sums of precipitation, with a threshold value of 0 mm in 2 days; V average daily wind speed, threshold value ≥4.4 m · s−1; and T average daily air temperature, threshold value >0°C); based on the data from the meteorological station in Biała Góra.

Fig. 7
Seasonality of the occurrence of geomorphological processes' events in the edge zone of the Pomeranian Bay of the Wolin National Park in 2010–2020; based on the average data from the meteorological station in Biała Góra and mareographic station in Świnoujście.
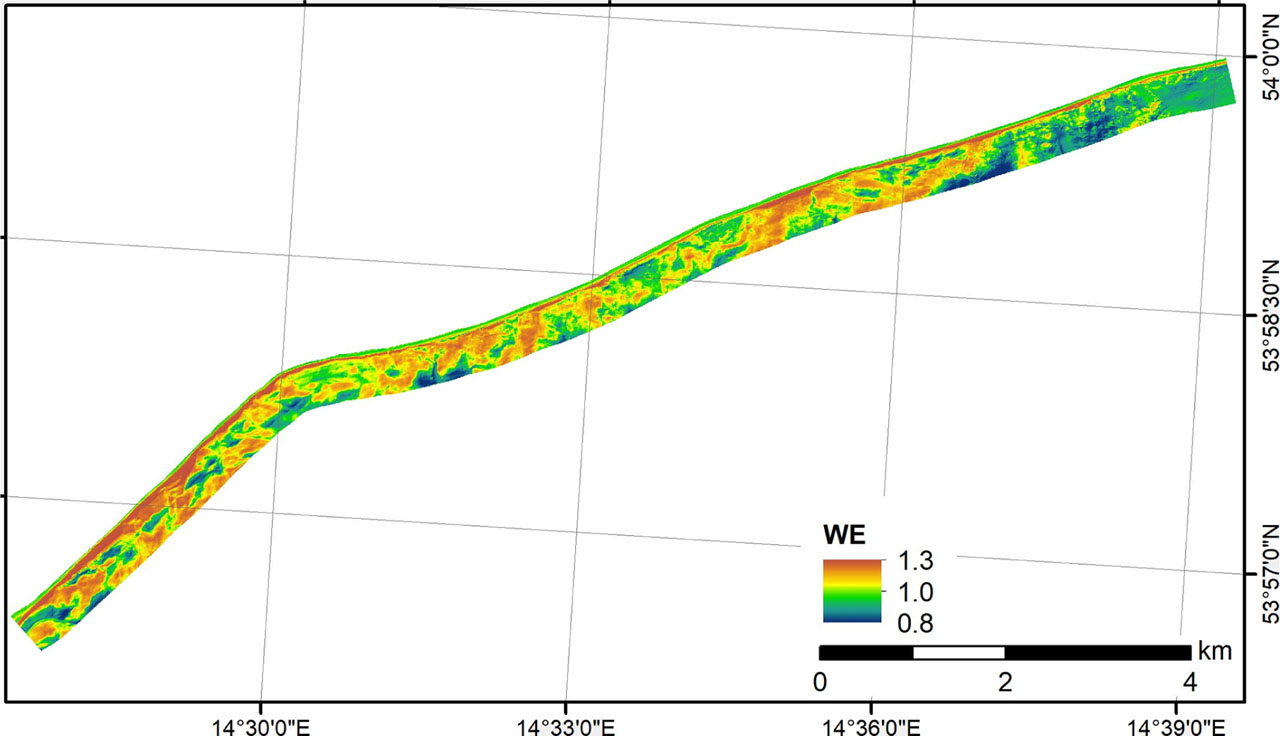
Fig. 8
Activity zones of wind efficiency index: WE >1 and restrictions WE <1 aeolian processes in the edge zone of the Pomeranian Bay of the Wolin National Park based on ISOK project (2011).
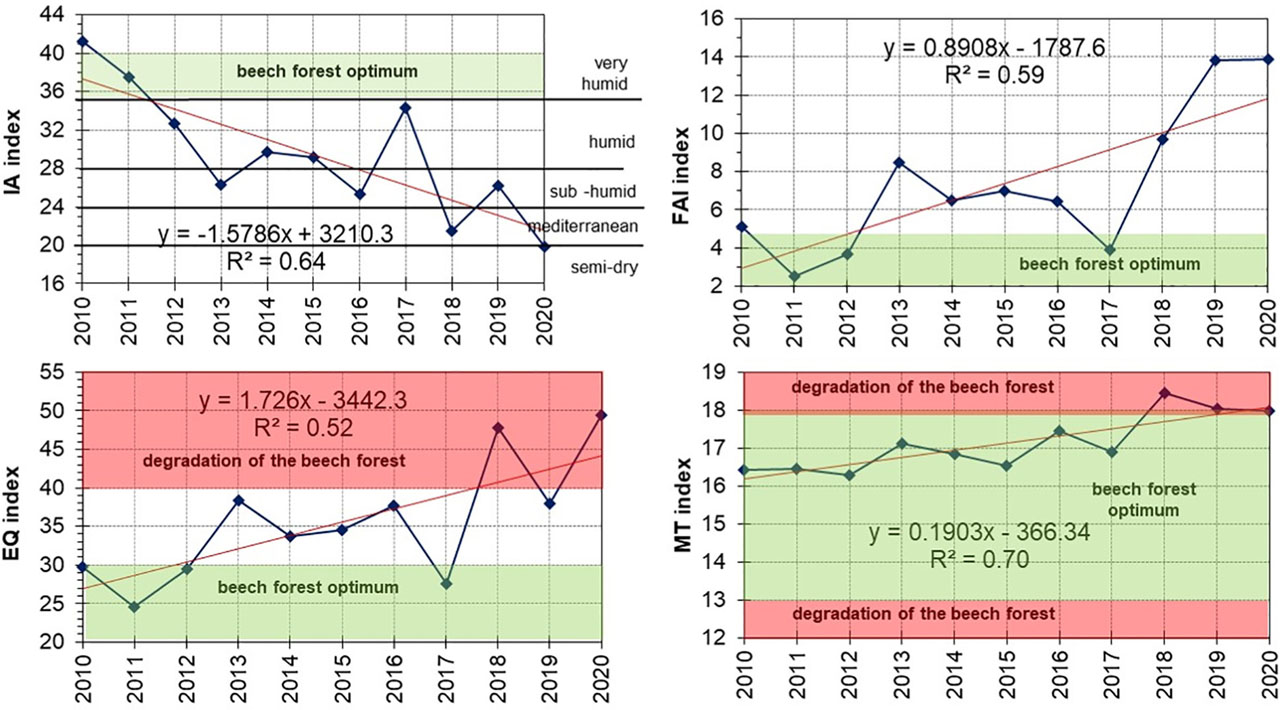
Fig. 9
Time variability of phytoclimatic indices in the edge zone of the Pomeranian Bay of the Wolin National Park based on the data from the meteorological station in Biała Góra.
AI – aridity index, EQ – Ellenberg quotient, FAI – Forestry Aridity Index, MT – Mayr tetratherm.
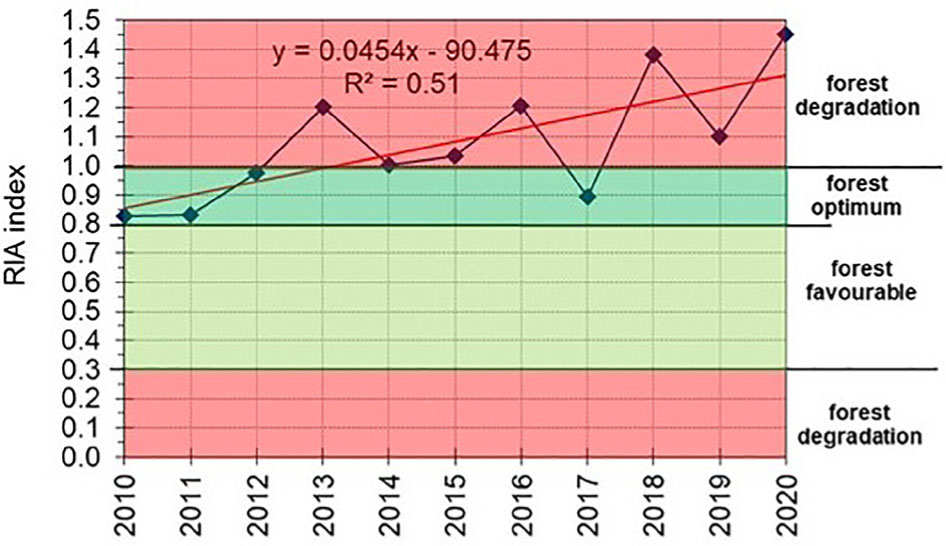
Fig. 10
Time variability of the RIA radiation dryness index based on the data from the meteorological station in Biała Góra.
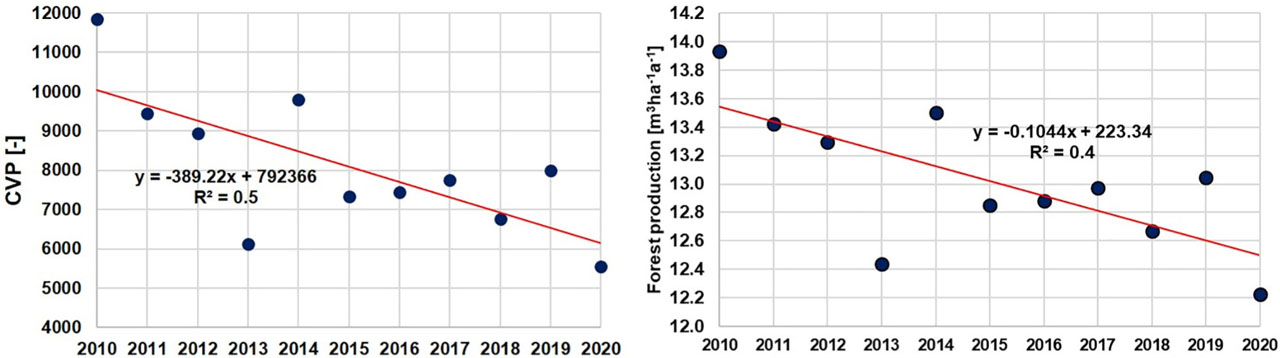
Fig. 11
Variability of the climate vegetation productivity CVP index and potential forest productivity in the edge zone of the Pomeranian Bay of the Wolin National Park based on the data from the meteorological station in Biała Góra.
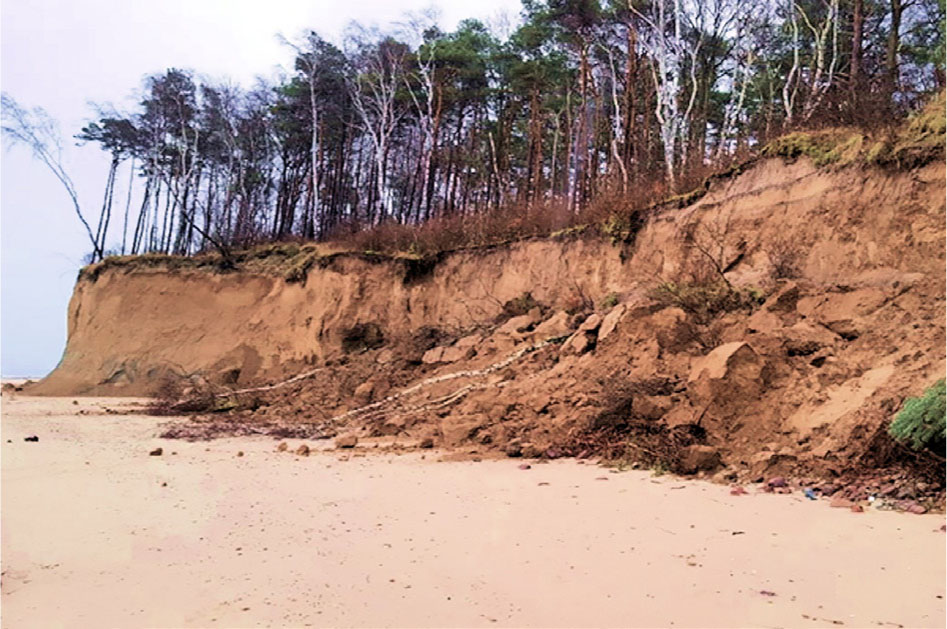
Fig. 12
Degradation of the Betulo-Quercetum loniceretosum xylostei as a result of extreme storm surge in Świętouść (photo by M. Winowski, January 2017).
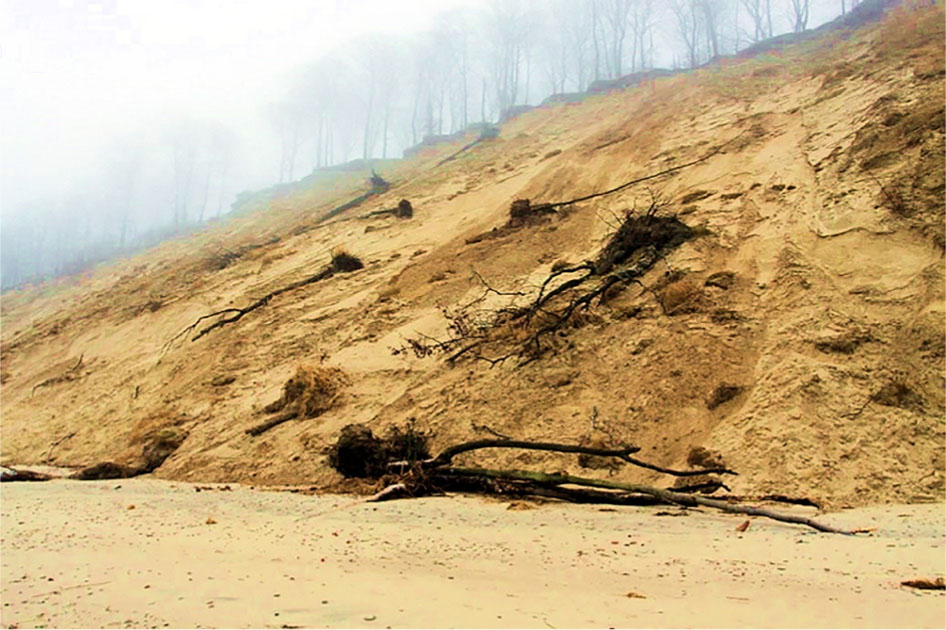
Fig. 13
The effect of turbulence erosion in Cephalanthero rubrae-Fagetum association on the cliff top between Gosań-Świdna Kępa (photo by J. Tylkowski, February 2012).
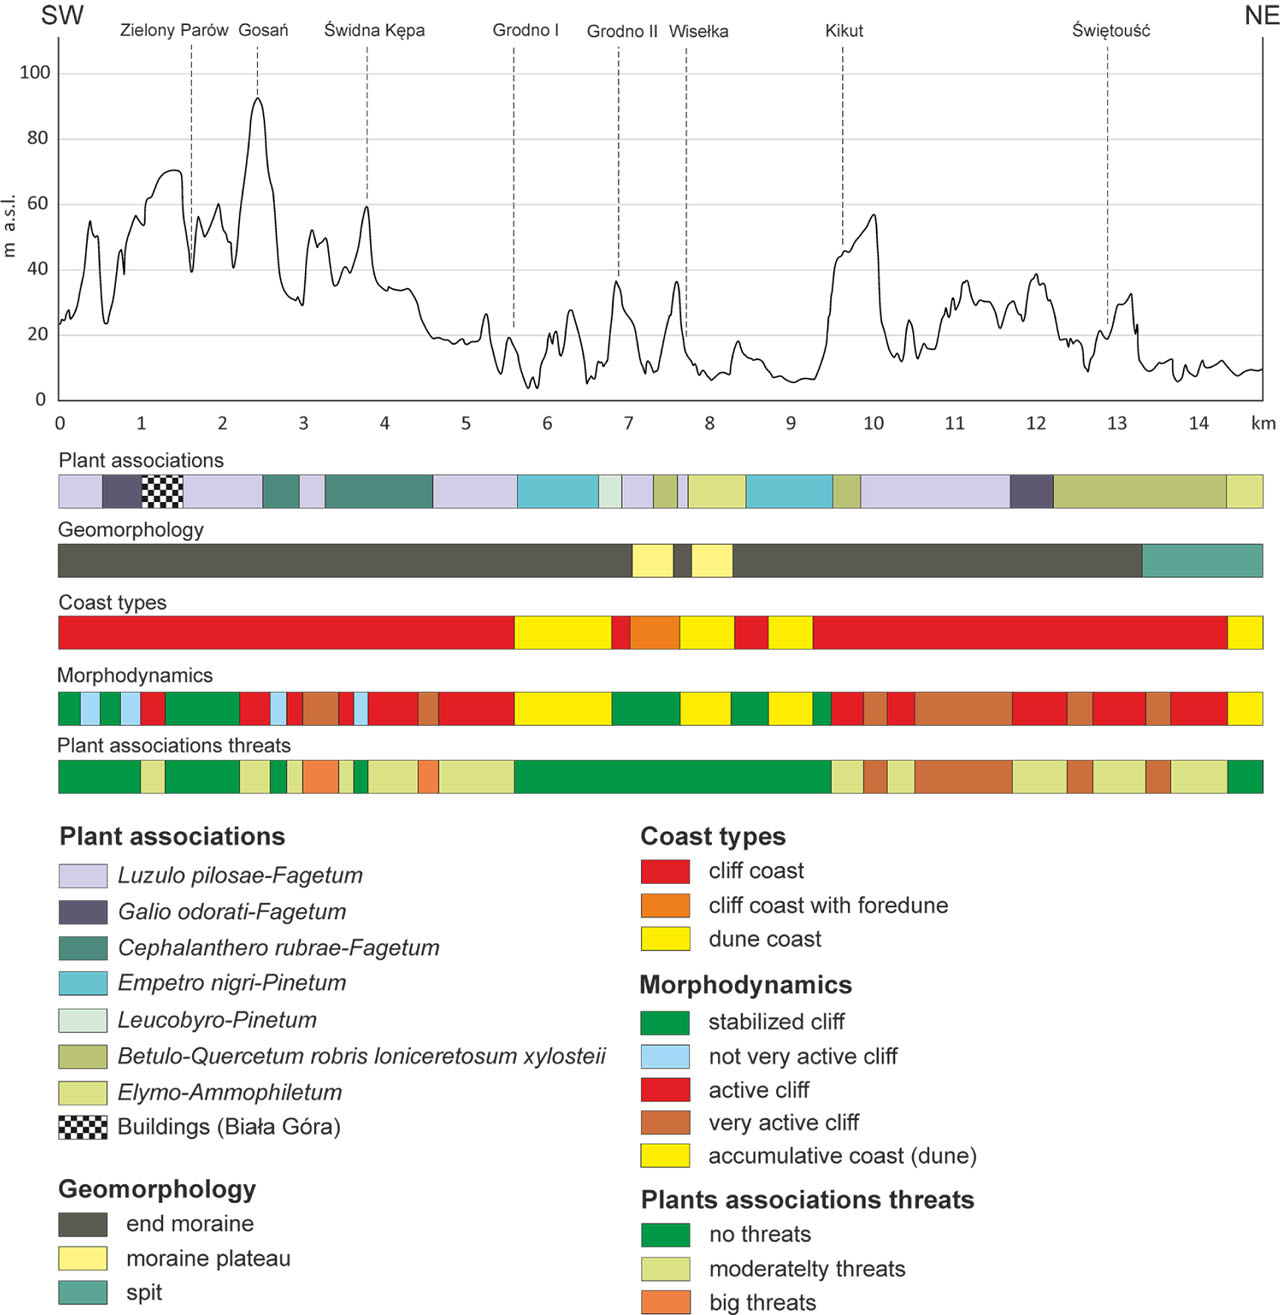
Fig. 14
Spatial valorisation of threat for forest communities in the edge zone of the Wolin National Park (coast of the Pomeranian Bay).