
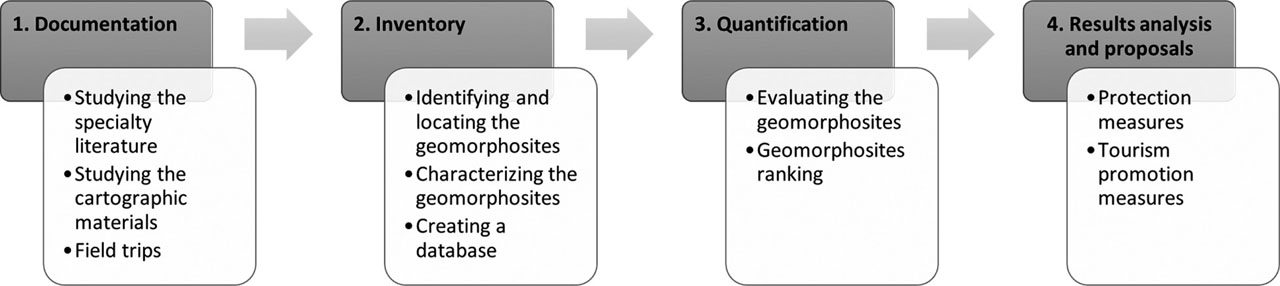
Fig. 1
The different stages of studying geomorphosites (Tufănoiu et al. 2020).
Table 1
The criteria proposed for the evaluation of the geomorphosites (acc. to Comănescu et al. 2011, with modifications and additions by Tufănoiu et al. 2020).
| Scientific value | Economic value | Aesthetic value | Cultural value | Management and use value | |||||
|---|---|---|---|---|---|---|---|---|---|
| 25 points | 20 points | 20 points | 20 points | 15 points | |||||
| 1.5 | Rareness at national level | 4 | Infrastructure | 4 | Visibility | 4 | Symbolic value | 3 | Preservation degree |
| 1.5 | Rareness in relation to the area | 4 | Accessibility | 4 | Colour contrast | 4 | Cultural characteristics | 3 | Intensity of use |
| 3 | Degree of scientific knowledge on geomorphological issues | 4 | Number of types and forms of use (inclusively touristic) | 4 | Level difference | 2 | Iconographic/literary representations | 3 | Use of aesthetic, cultural and economic value |
| 3 | Palaeogeographic interest | 4 | Yearly number of visitors | 4 | Landscape framing | 4 | Religious characteristics | 2 | Vulnerability / natural risks |
| 3 | Integrity / intactness | 4 | Economic potential (incomes) | 4 | Space structuring | 4 | Historical characteristics | 2 | Relationship with planning policies |
| 3 | Use in educational purposes | 2 | Cultural manifestations | 2 | Equipment and support services | ||||
| 2 | Diversity | ||||||||
| 5 | Ecologic value | ||||||||
| 2 | Representativeness | ||||||||
| 1 | Other geological features | ||||||||
| Vs points | Ve points | Va points | Vc points | Vmu points | |||||
| Total points | |||||||||
| 0 | Minimum | Total value | 1 | Maximum | |||||
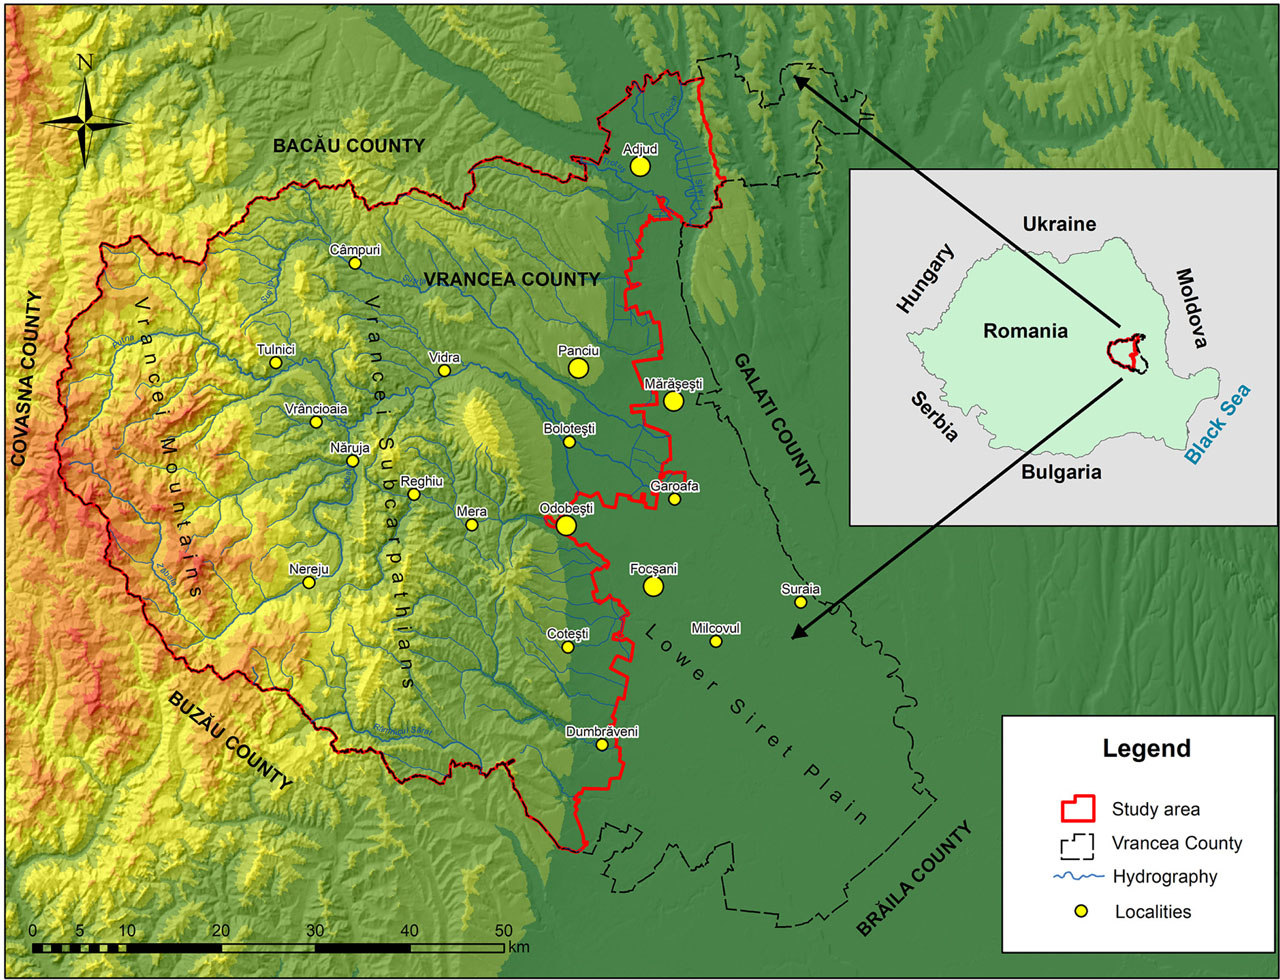
Fig. 2
The geographic location of the study area.
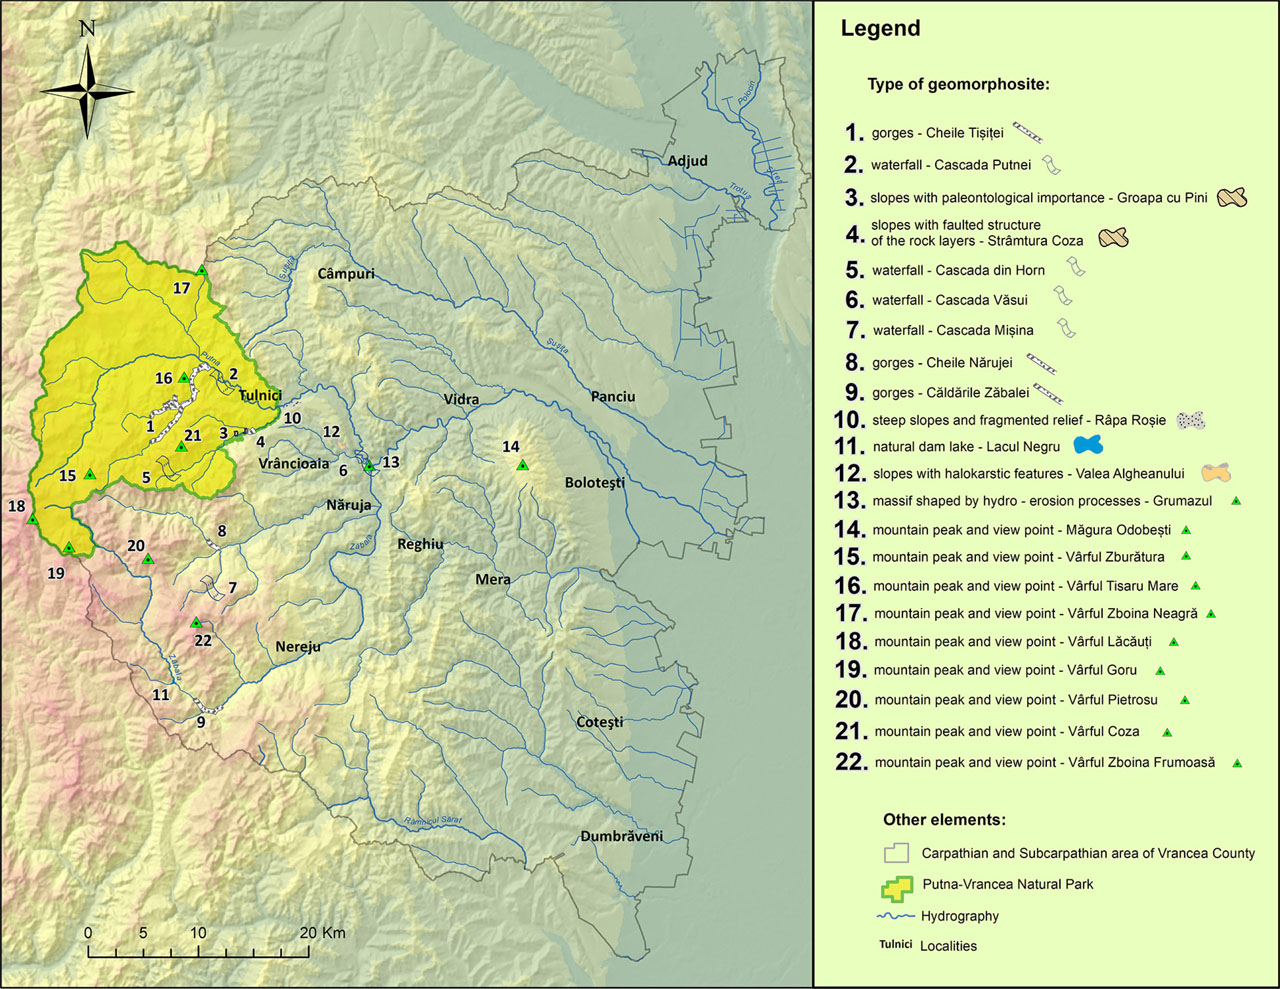
Fig. 3
The location of the analysed geomorphosites.
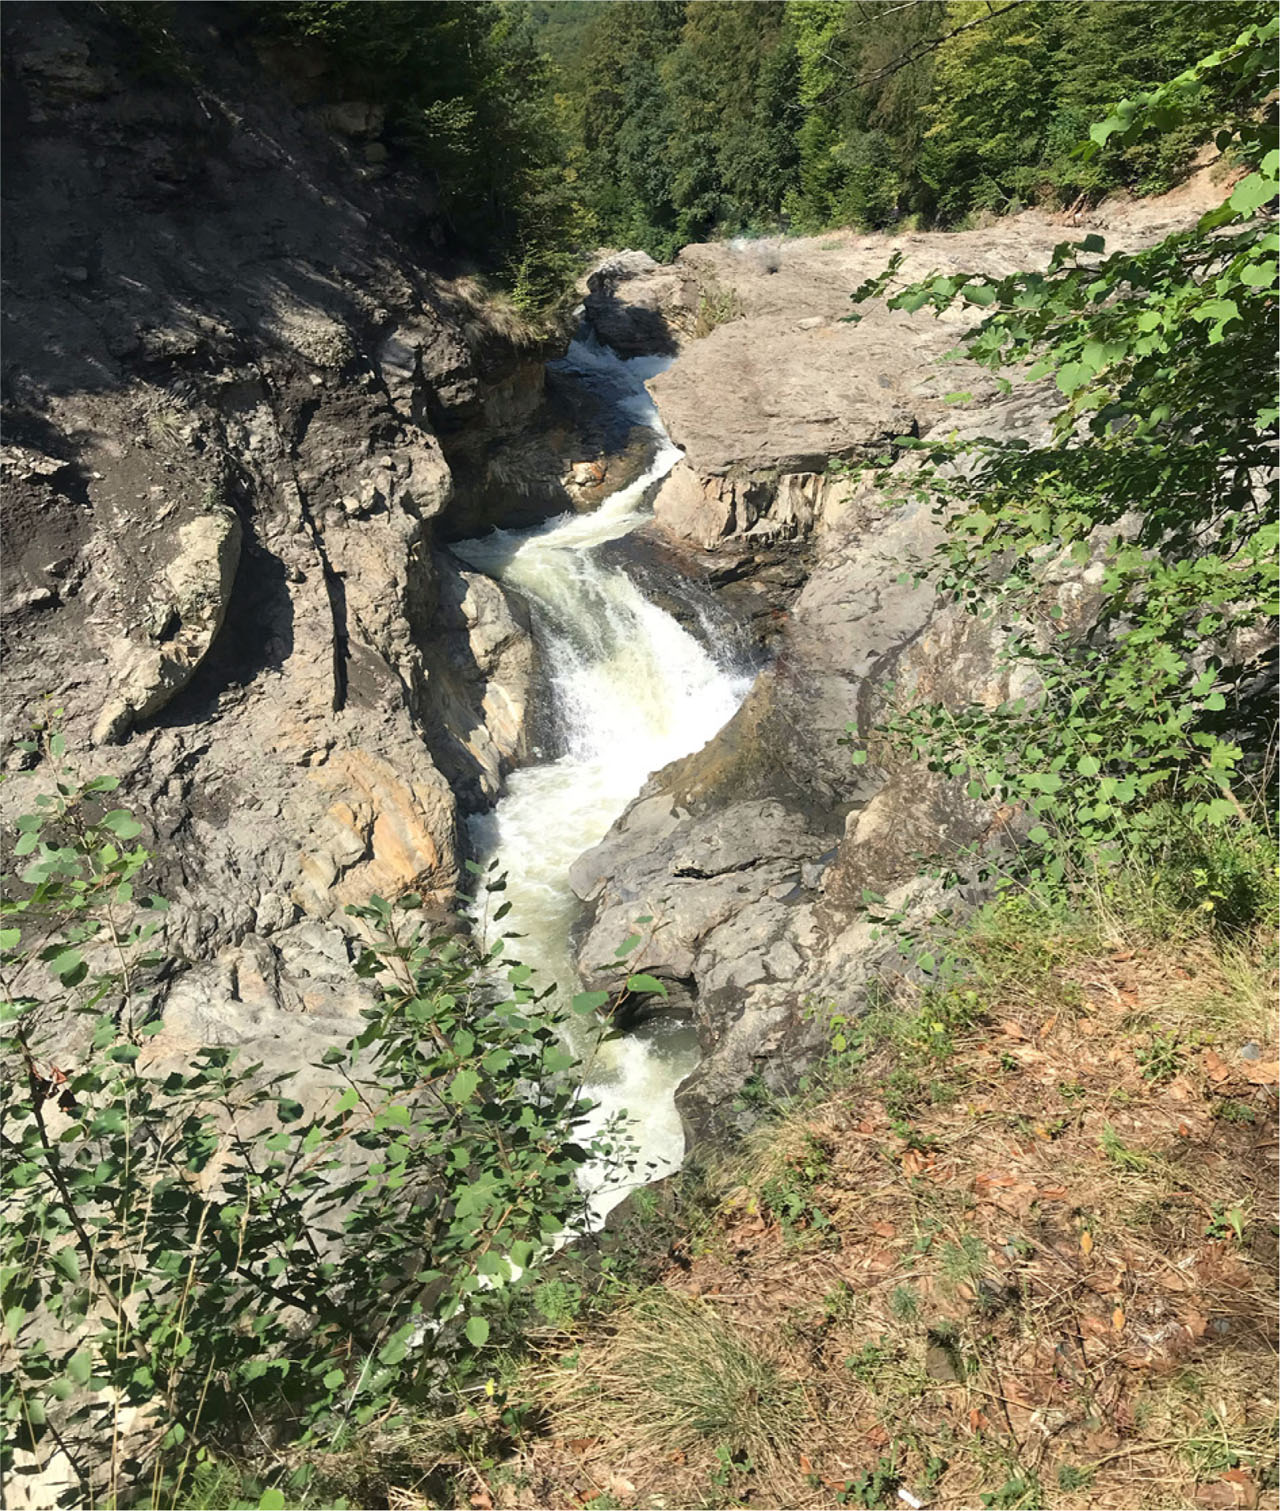
Fig. 4
Cascada Putnei.
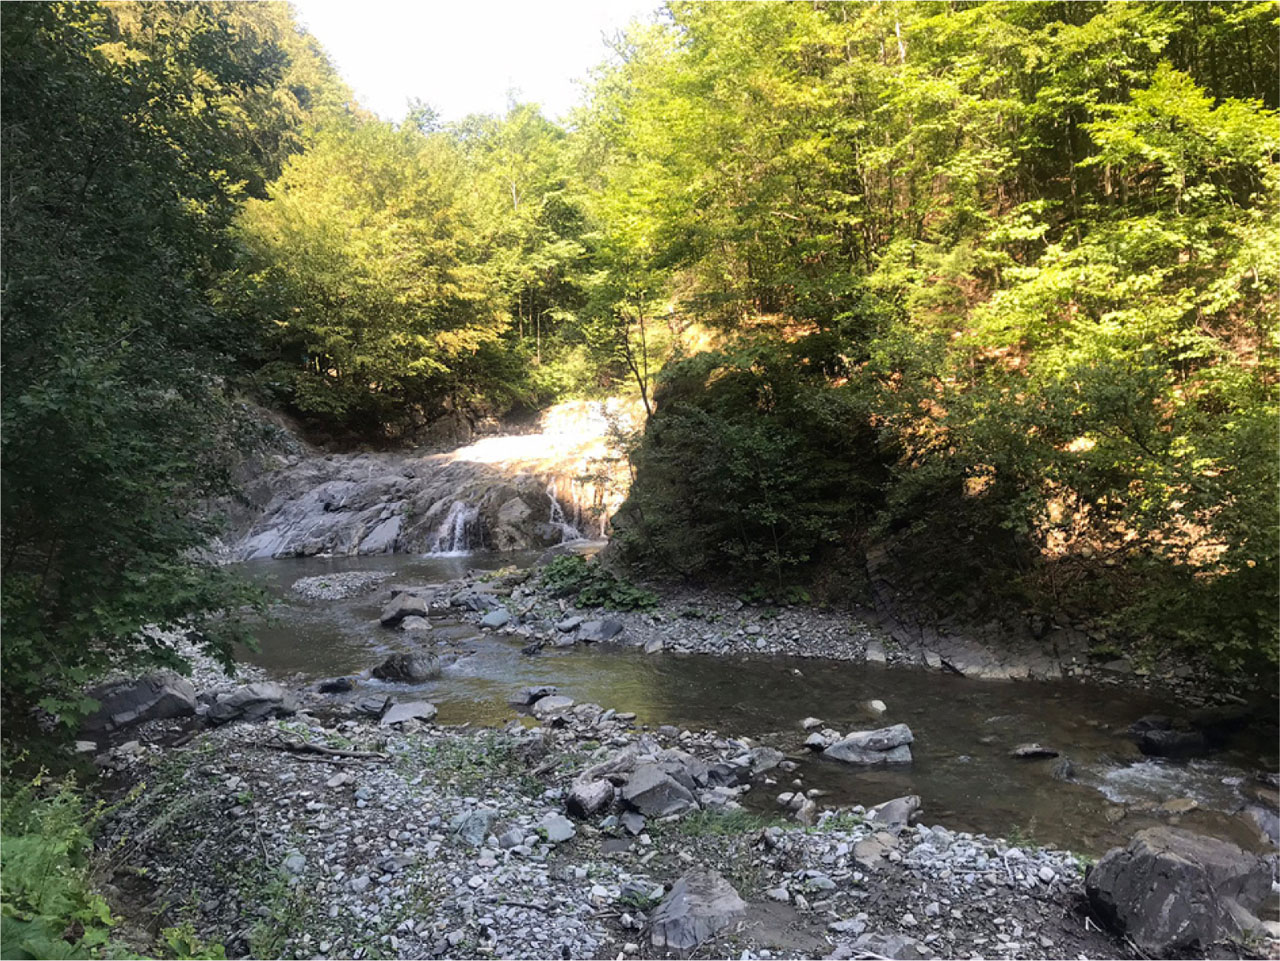
Fig. 5
Cheile Tișiței.
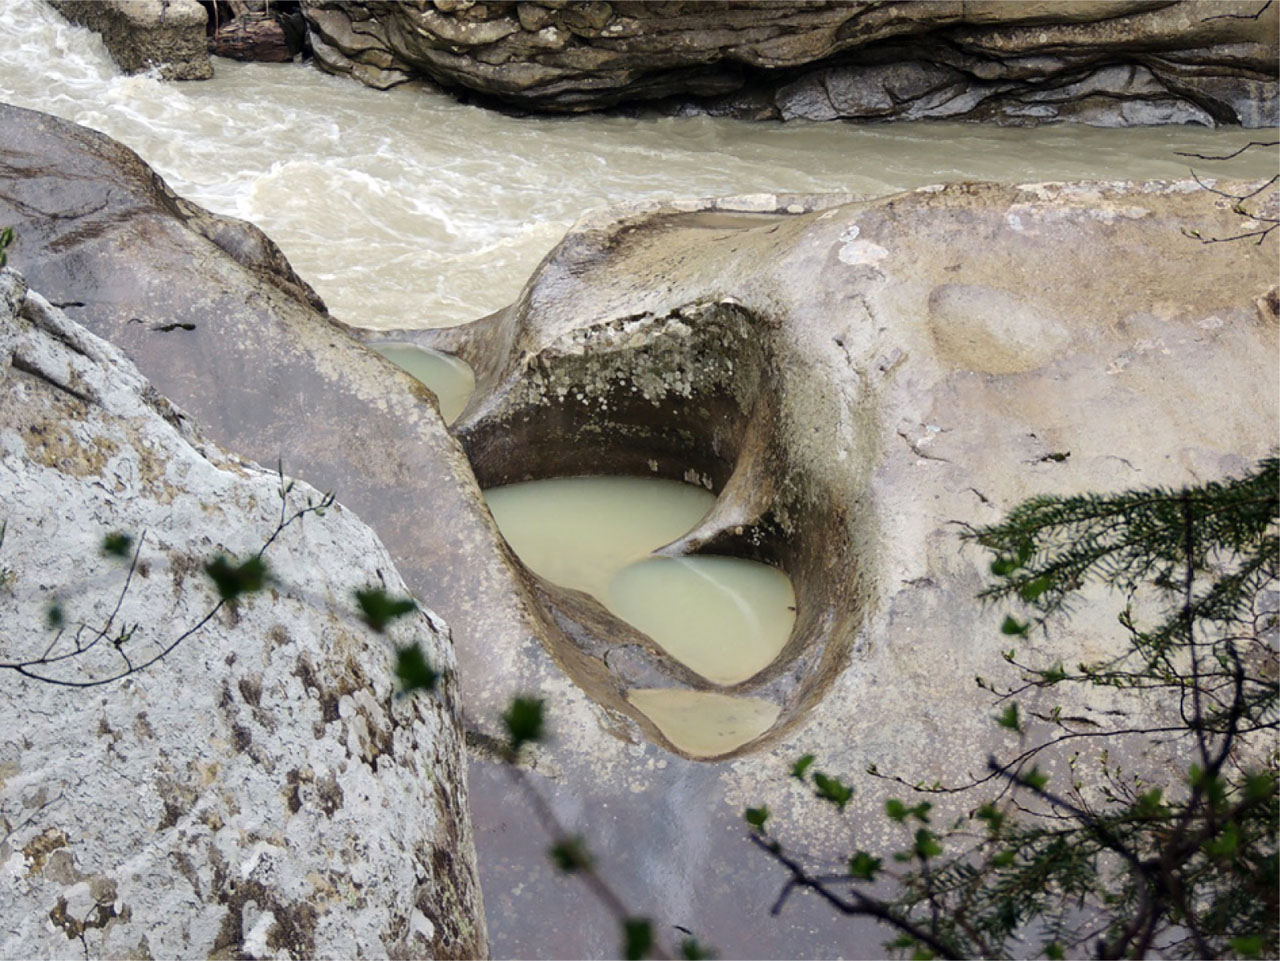
Fig. 6
Căldările Zăbalei.
Table 2
An example of the assessment (applied on the geomorphosite no. 2 Cascada Putnei).
| Scientific value | Economic value | Aesthetic value | Cultural value | Management and use value | |||||
|---|---|---|---|---|---|---|---|---|---|
| 25 points | 20 points | 20 points | 20 points | 15 points | |||||
| 1.5 | Rareness at national level | 3 | Infrastructure | 4 | Visibility | 3 | Symbolic value | 2.5 | Preservation degree |
| 1.5 | Rareness in relation to the area | 4 | Accessibility | 4 | Colour contrast | 4 | Cultural characteristics | 2.5 | Intensity of use |
| 3 | Degree of scientific knowledge on geomorphological issues | 2 | Number of types and forms of use (inclusively touristic) | 4 | Level difference | 0.5 | Icono graphic / literary representations | 2.5 | Use of aesthetic, cultural and economic value |
| 3 | Palaeogeographic interest | 3 | Yearly number of visitors | 2 | Landscape framing | 2 | Religious characteristics | 1 | Vulnera bility / natural risks |
| 2.5 | Integrity / intactness | 3 | Economic potential (incomes) | 2 | Space structuring | 2 | Historical characteristics | 1 | Relationship with planning policies |
| 3 | Use in educational purposes | 0.5 | Cultural manifestations | 1.5 | Equipment and support services | ||||
| 1.5 | Diversity | ||||||||
| 4 | Ecologic value | ||||||||
| 2 | Representativeness | ||||||||
| 1 | Other geological features | ||||||||
| 23 | 15 | 16 | 12 | 11 | |||||
| 77 points | |||||||||
| 0 | Minimum | 0.77 | 1 | Maximum | |||||
Table 3
The ranking of geomorphosites.
| No. | Name | Scientific value | Economic value | Aesthetic value | Cultural value | Management and use | Total points | Evaluation score | Rank |
|---|---|---|---|---|---|---|---|---|---|
| 1. | Cheile Tișiței | 23 | 11 | 17 | 11 | 10 | 72 | 0.72 | 2 |
| 2. | Cascada Putnei | 23 | 15 | 16 | 12 | 11 | 77 | 0.77 | 1 |
| 3. | Groapa cu Pini | 21 | 6 | 15 | 13 | 7 | 62 | 0.62 | 7 |
| 4. | Strâmtura Coza | 19 | 6 | 15 | 11 | 7 | 58 | 0.58 | 10 |
| 5. | Cascada din Horn | 12 | 4 | 16 | 12 | 6 | 50 | 0.50 | 14 |
| 6. | Cascada Văsui | 10 | 5 | 11 | 11 | 4 | 41 | 0.41 | 18 |
| 7. | Cascada Mișina | 21 | 6 | 18 | 11 | 8 | 64 | 0.64 | 5 |
| 8. | Cheile Nărujei | 22 | 8 | 17 | 11 | 7 | 65 | 0.65 | 4 |
| 9. | Căldările Zăbalei | 23 | 7 | 16 | 11 | 8 | 65 | 0.65 | 4 |
| 10. | Râpa Roșie | 21 | 10 | 14 | 11 | 7 | 63 | 0.63 | 6 |
| 11. | Lacul Negru | 20 | 7 | 15 | 11 | 6 | 59 | 0.59 | 9 |
| 12. | Valea Algheanului | 18 | 9 | 11 | 12 | 6 | 56 | 0.56 | 12 |
| 13. | Grumaz | 8 | 5 | 15 | 13 | 5 | 46 | 0.46 | 16 |
| 14. | Măgura Odobești | 16 | 9 | 17 | 15 | 10 | 67 | 0.67 | 3 |
| 15. | Vârful Zburătura | 12 | 3 | 19 | 8 | 7 | 49 | 0.49 | 15 |
| 16. | Vârful Tisaru Mare | 12 | 6 | 20 | 8 | 9 | 55 | 0.55 | 13 |
| 17. | Vârful Zboina Neagră | 14 | 7 | 20 | 9 | 11 | 61 | 0.61 | 8 |
| 18. | Vârful Lăcăuți | 12 | 6 | 19 | 9 | 10 | 56 | 0.56 | 12 |
| 19. | Vârful Goru | 16 | 3 | 20 | 10 | 8 | 57 | 0.57 | 11 |
| 20. | Vârful Pietrosu | 8 | 3 | 18 | 6 | 6 | 41 | 0.41 | 18 |
| 21. | Vârful Coza | 9 | 4 | 18 | 8 | 6 | 45 | 0.45 | 17 |
| 22. | Vârful Zboina Frumoasă | 12 | 3 | 20 | 8 | 7 | 50 | 0.50 | 14 |
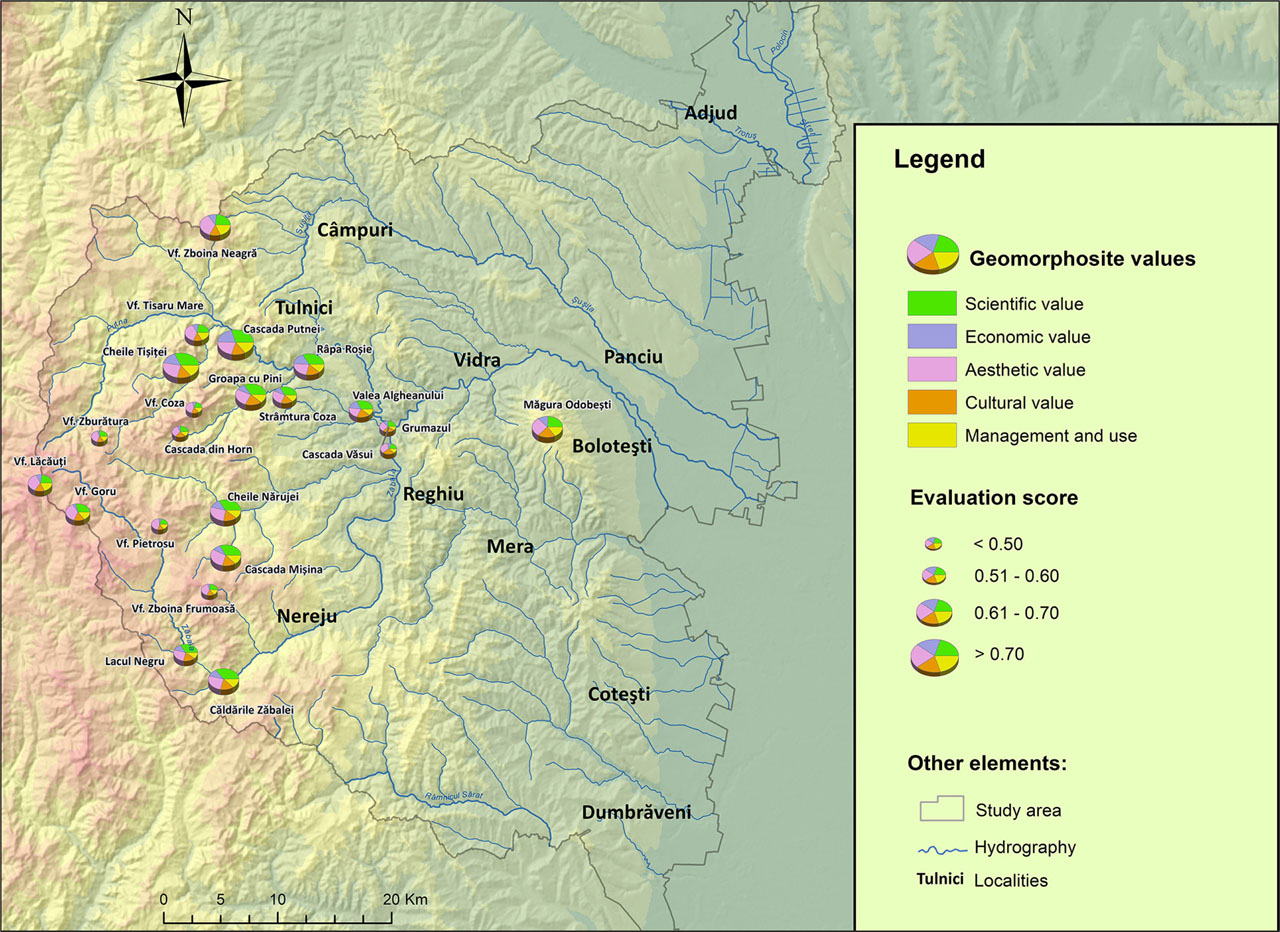
Fig. 7
The evaluation of the geomorphosites.
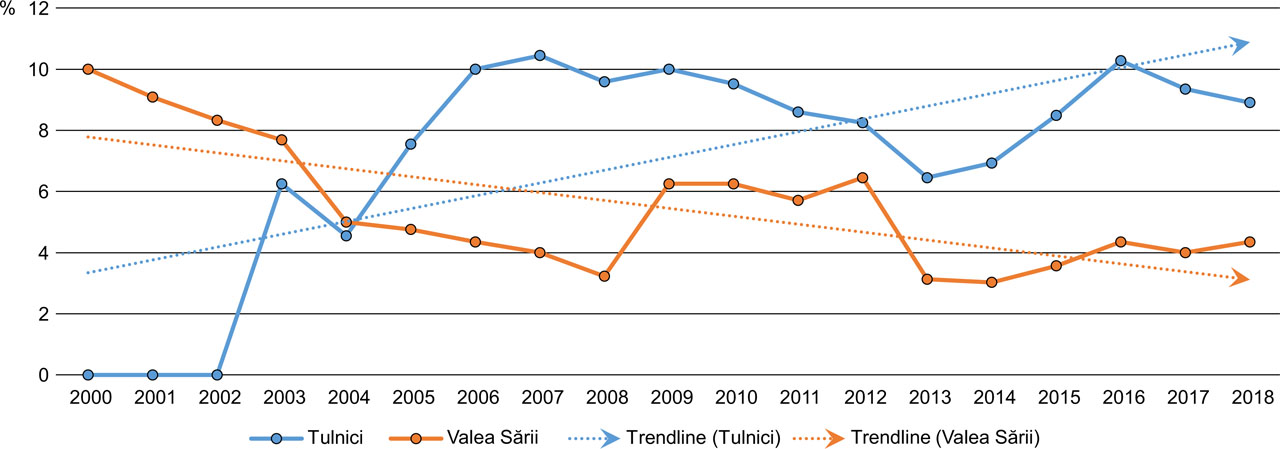
Fig. 8
Tourism companies share trend for Tulnici and Valea Sării, 2000–2018 (acc. to Research Centre for Integrated Analysis and Territorial Management, 2022).
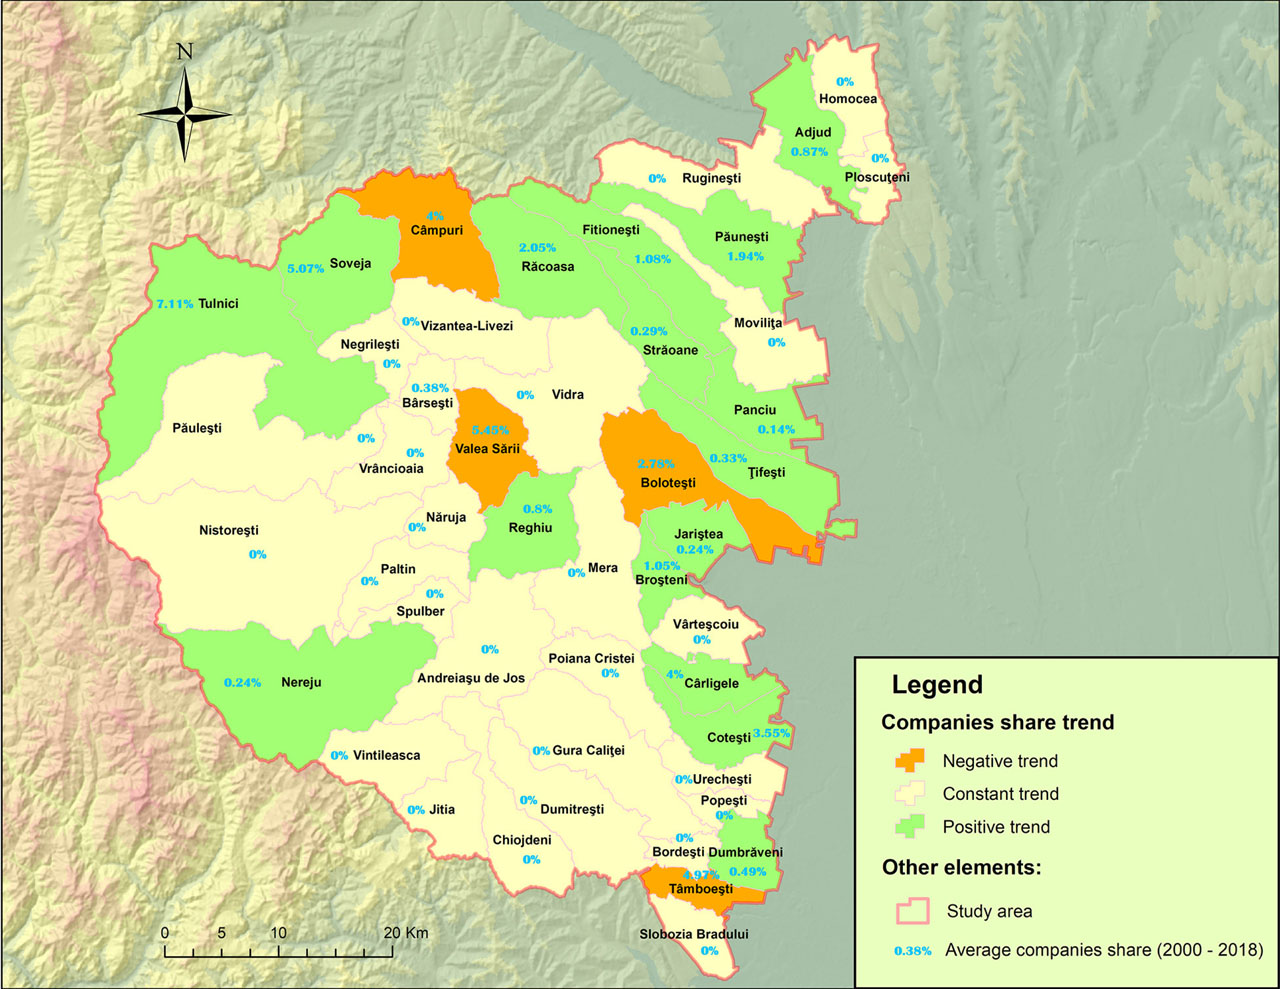
Fig. 9
Tourism companies share trend for each ATU, 2000–2018 (acc. to Research Centre for Integrated Analysis and Territorial Management, 2022).
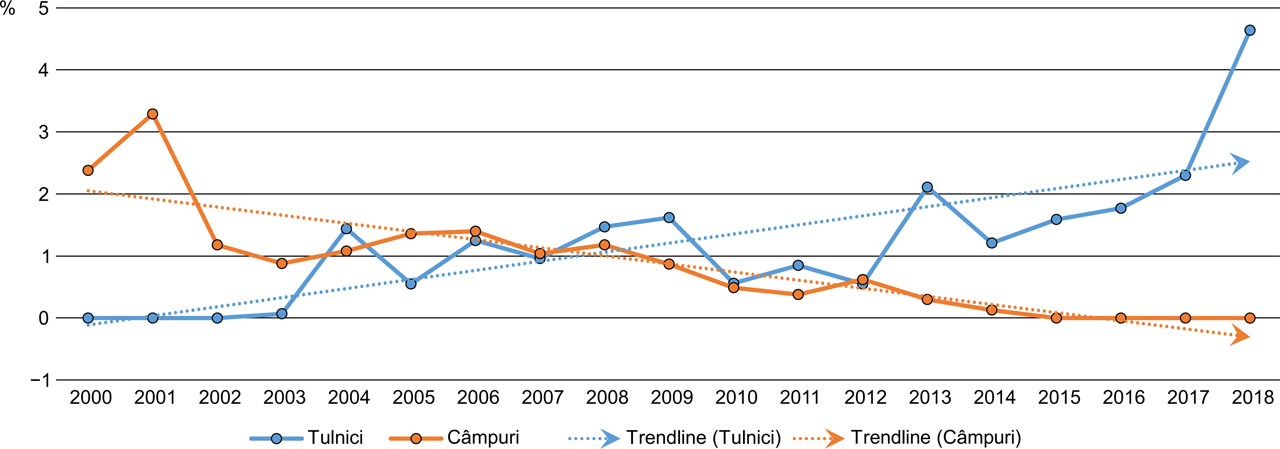
Fig. 10
Tourism turnover share trend for Tulnici and Câmpuri, 2000–2018 (acc. to Research Centre for Integrated Analysis and Territorial Management, 2022).
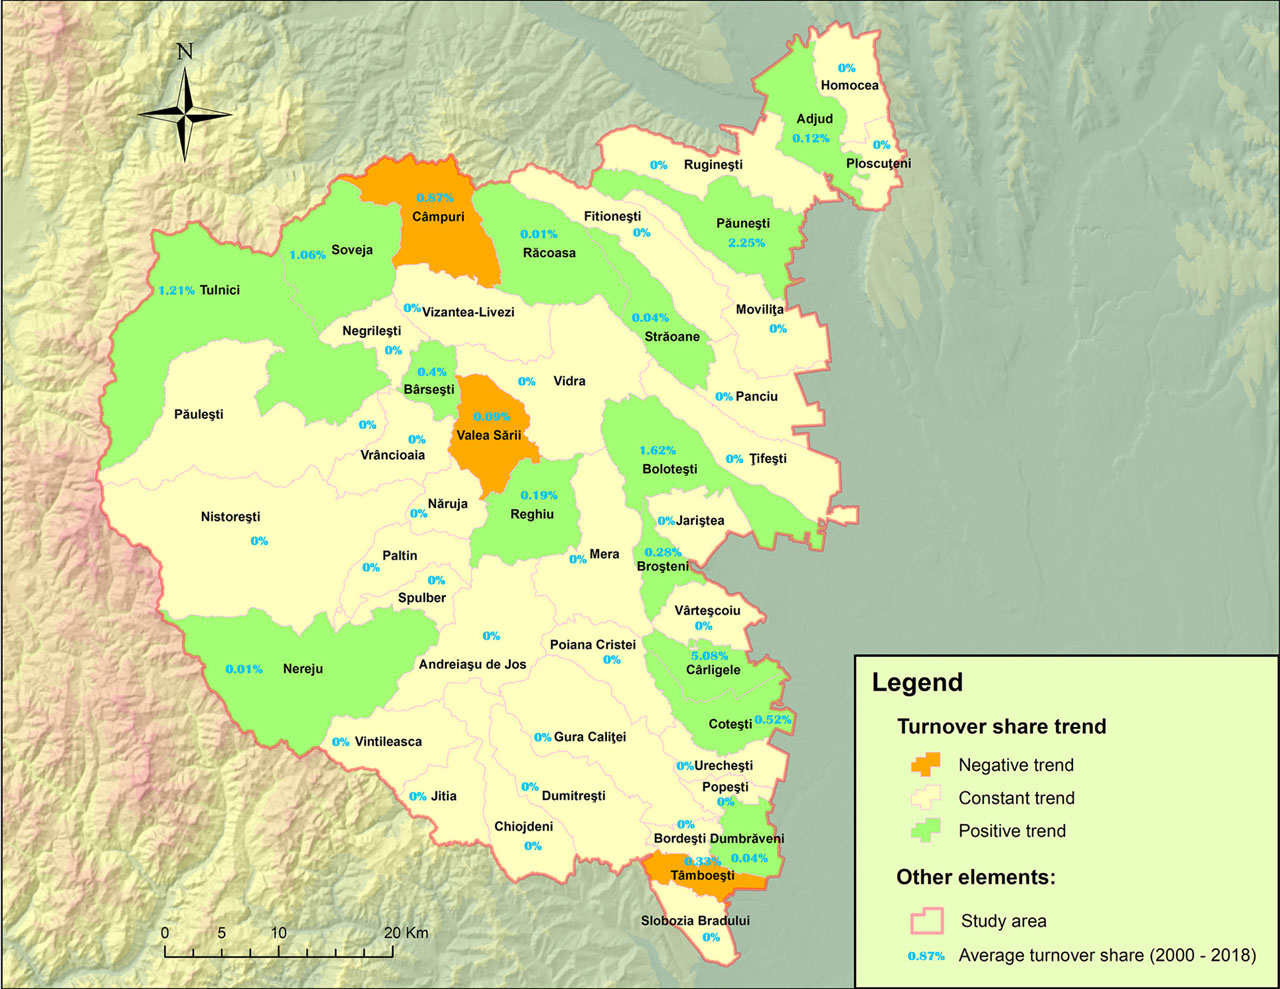
Fig. 11
Tourism turnover share trend for each ATU, 2000–2018 (acc. to Research Centre for Integrated Analysis and Territorial Management, 2022).
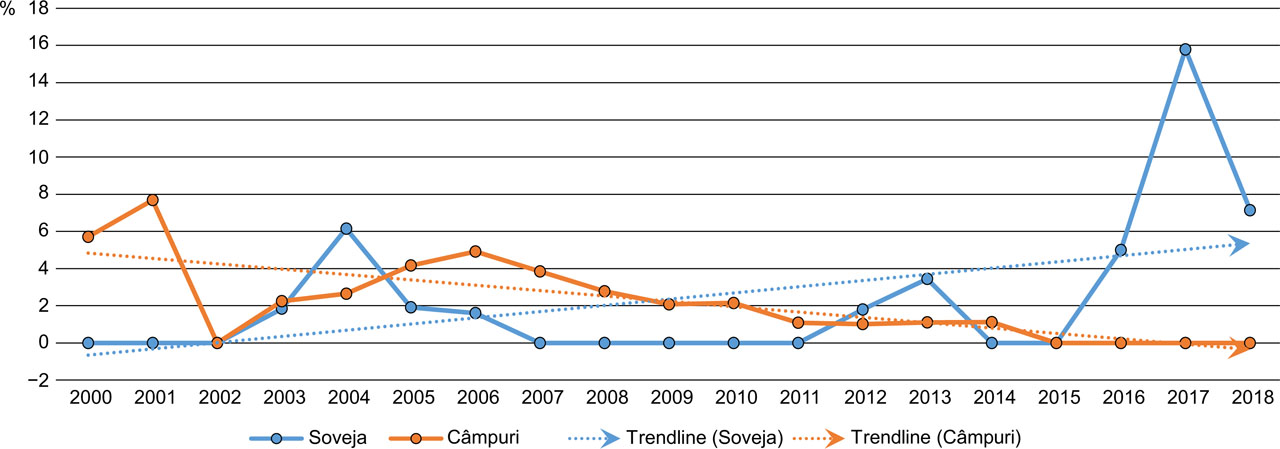
Fig. 12
Tourism employees share trend for Soveja and Câmpuri, 2000–2018 (acc. to Research Centre for Integrated Analysis and Territorial Management, 2022).
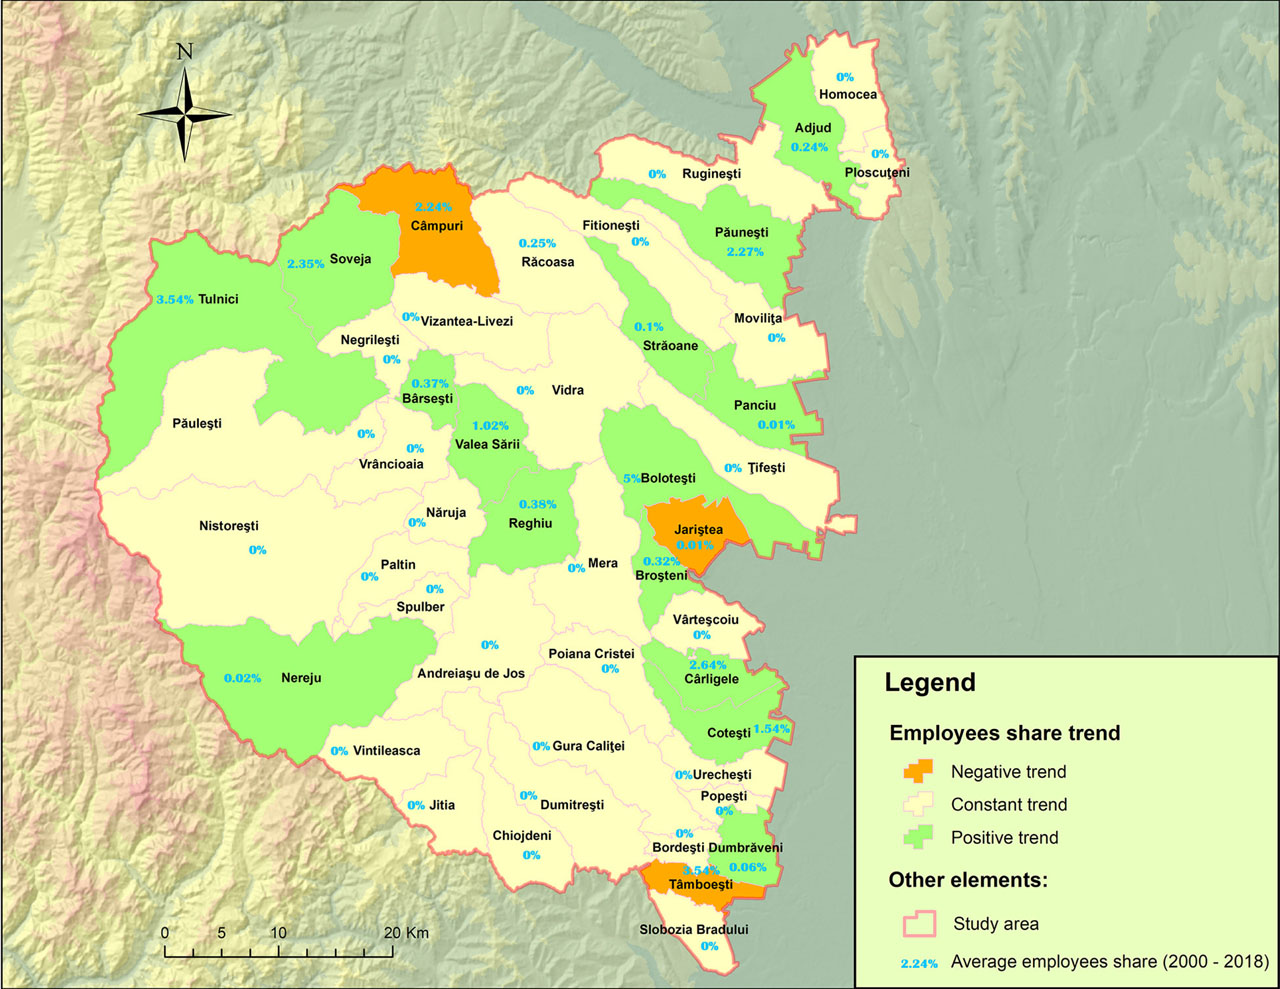
Fig. 13
Tourism employees share trend for each ATU, 2000–2018 (acc. to Research Centre for Integrated Analysis and Territorial Management, 2022).
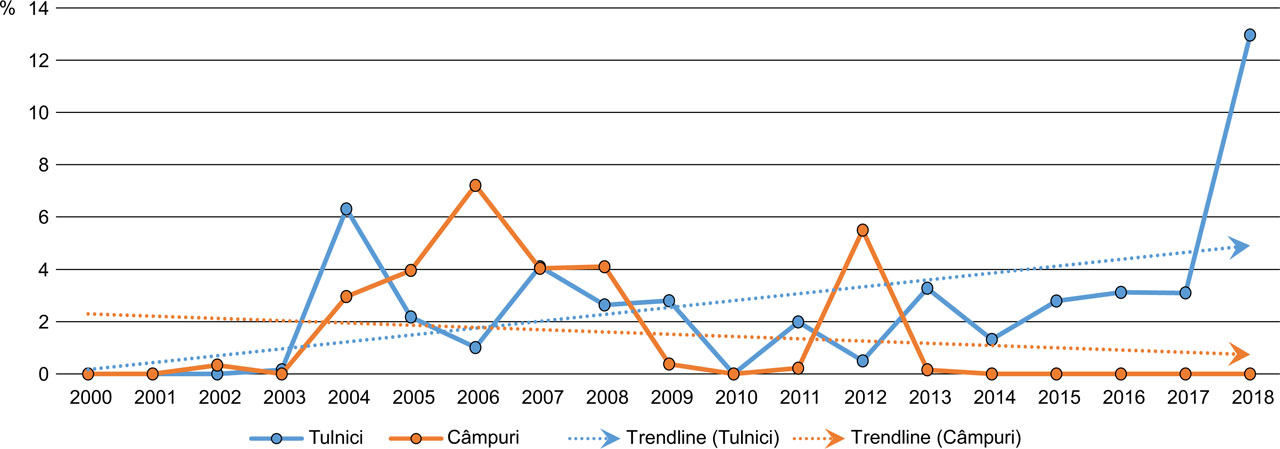
Fig. 14
Tourism profit share trend for Tulnici and Câmpuri, 2000–2018 (acc. to Research Centre for Integrated Analysis and Territorial Management, 2022).
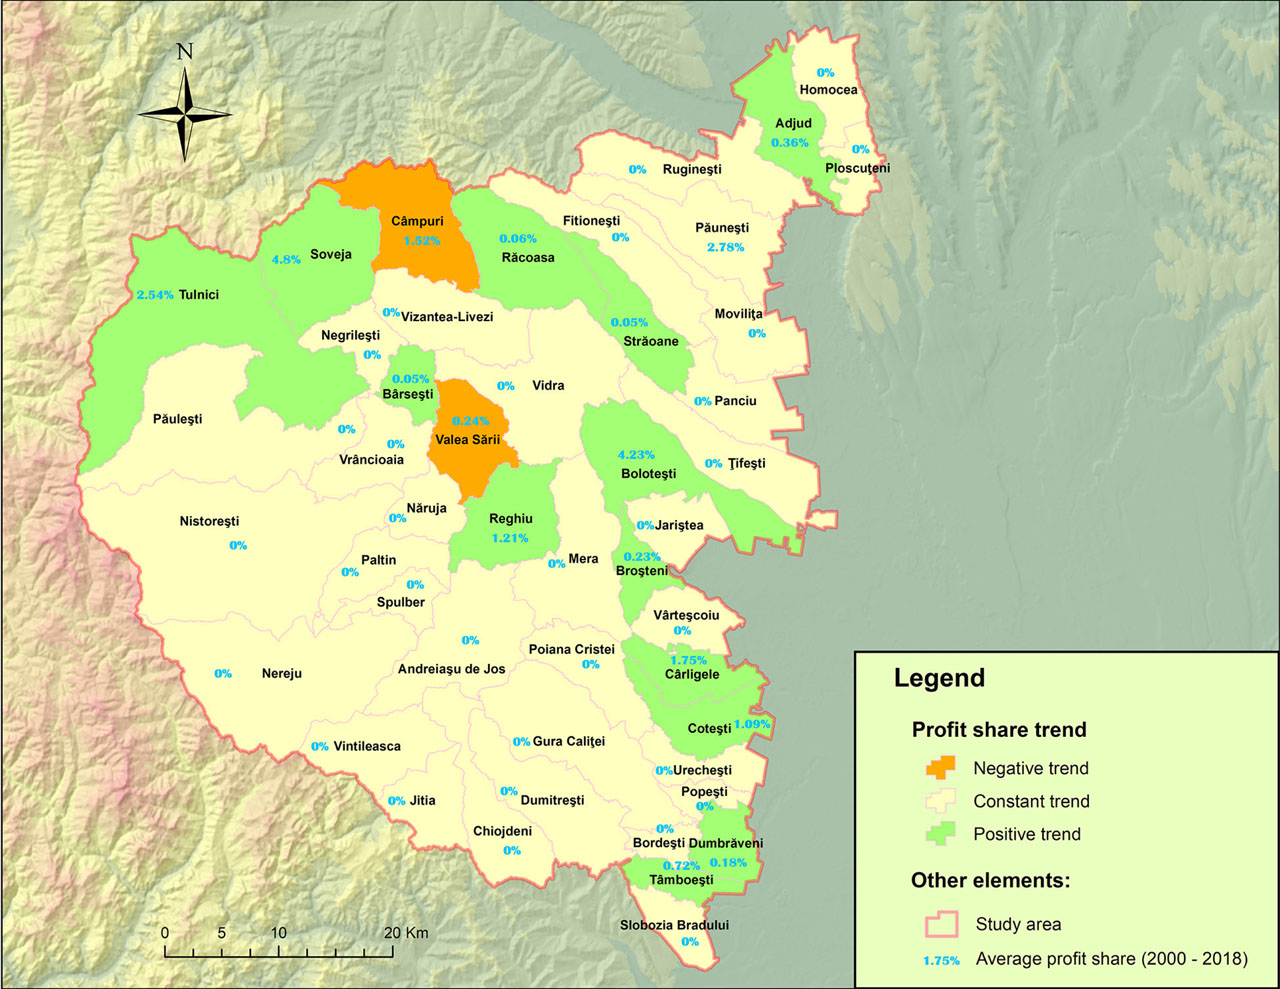
Fig. 15
Tourism profit share trend for each ATU, 2000–2018 (acc. to Research Centre for Integrated Analysis and Territorial Management, 2022).
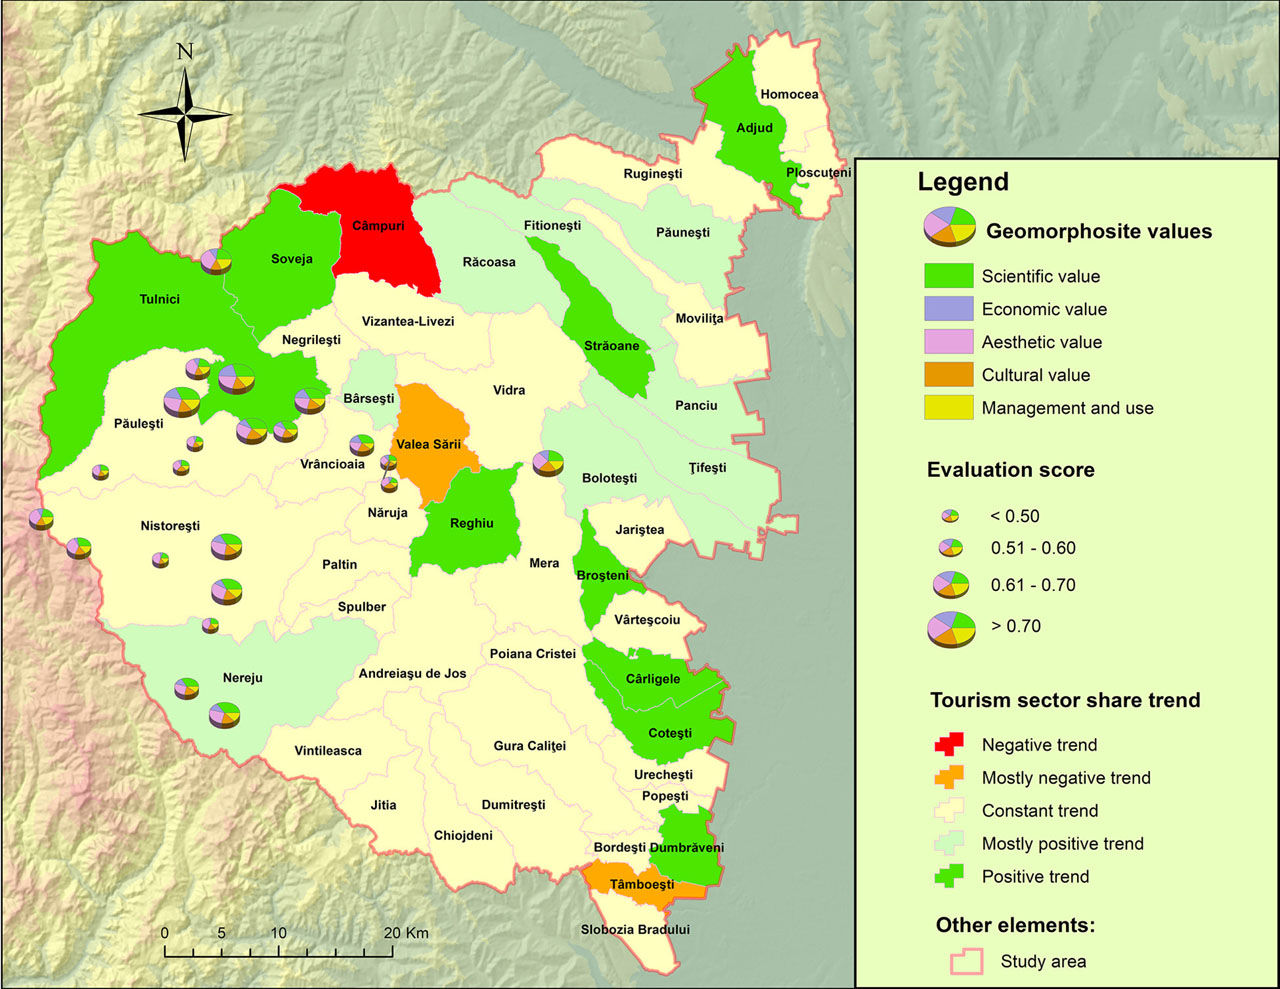
Fig. 16
The relationship between the geomorphosite assessment and tourism sector share trend for each ATU, 2000–2018 (acc. to Research Centre for Integrated Analysis and Territorial Management, 2022).