
Table 1
Changes in gross value added of industry and services sectors in the EU and Poland in 2019–2021 (by quarter).
| Time | European Union (27) | Poland | ||
|---|---|---|---|---|
| industry (including construction) | services | industry (including construction) | services | |
| gross value added in millions of euro (current prices) | ||||
| 2019–Q1 | 772,270.5 | 2,194,441.3 | 34,271.7 | 71,800.5 |
| 2019–Q2 | 788,488.4 | 2,280,772.5 | 34,057.1 | 75,894.9 |
| 2019–Q3 | 780,632.2 | 2,287,091.7 | 35,083.3 | 77,396.5 |
| 2019–Q4 | 832,498.0 | 2,374,657.6 | 45,908.7 | 82,401.0 |
| 2020–Q1 | 762,476.5 | 2,205,316.8 | 35,828.6 | 77,781.6 |
| 2020–Q2 | 669,964.2 | 2,042,733.9 | 30,199.7 | 70,766.1 |
| 2020–Q3 | 756,483.3 | 2,243,864.8 | 34,304.9 | 77,540.2 |
| 2020–Q4 | 836,724.7 | 2,312,133.1 | 45,639.6 | 78,563.7 |
| 2021–Q1 | 792,486.5 | 2,191,947.3 | 36,220.3 | 74,386.8 |
| 2021–Q2 | 822,455.7 | 2,307,921.9 | 38,113.2 | 77,917.1 |
| 2021–Q3 | 815,654.8 | 2,386,809.4 | 38,849.4 | 81,858.4 |
| 2021–Q4 | 895,755.2 | 2,487,530.2 | 54,175.7 | 84,199.4 |
| Index of dynamics | ||||
| Period 1: 2019–Q1 to 2020–Q2 (2019–Q1=100) | 186.8 | 193.1 | 188.1 | 198.6 |
| Period 1a: 2019–Q4 to 2020–Q2 (2019–Q4=100) | 180.5 | 186.0 | 165.8 | 185.9 |
| Period 2: 2020–Q2 to 2021–Q4 (2020–Q2=100) | 133.7 | 121.8 | 179.4 | 119.0 |
| All time: 2019–Q1 to 2021–Q4 (2019–Q1=100) | 116.0 | 113.4 | 158.1 | 117.3 |
[i] Source: own study based on Eurostat data.
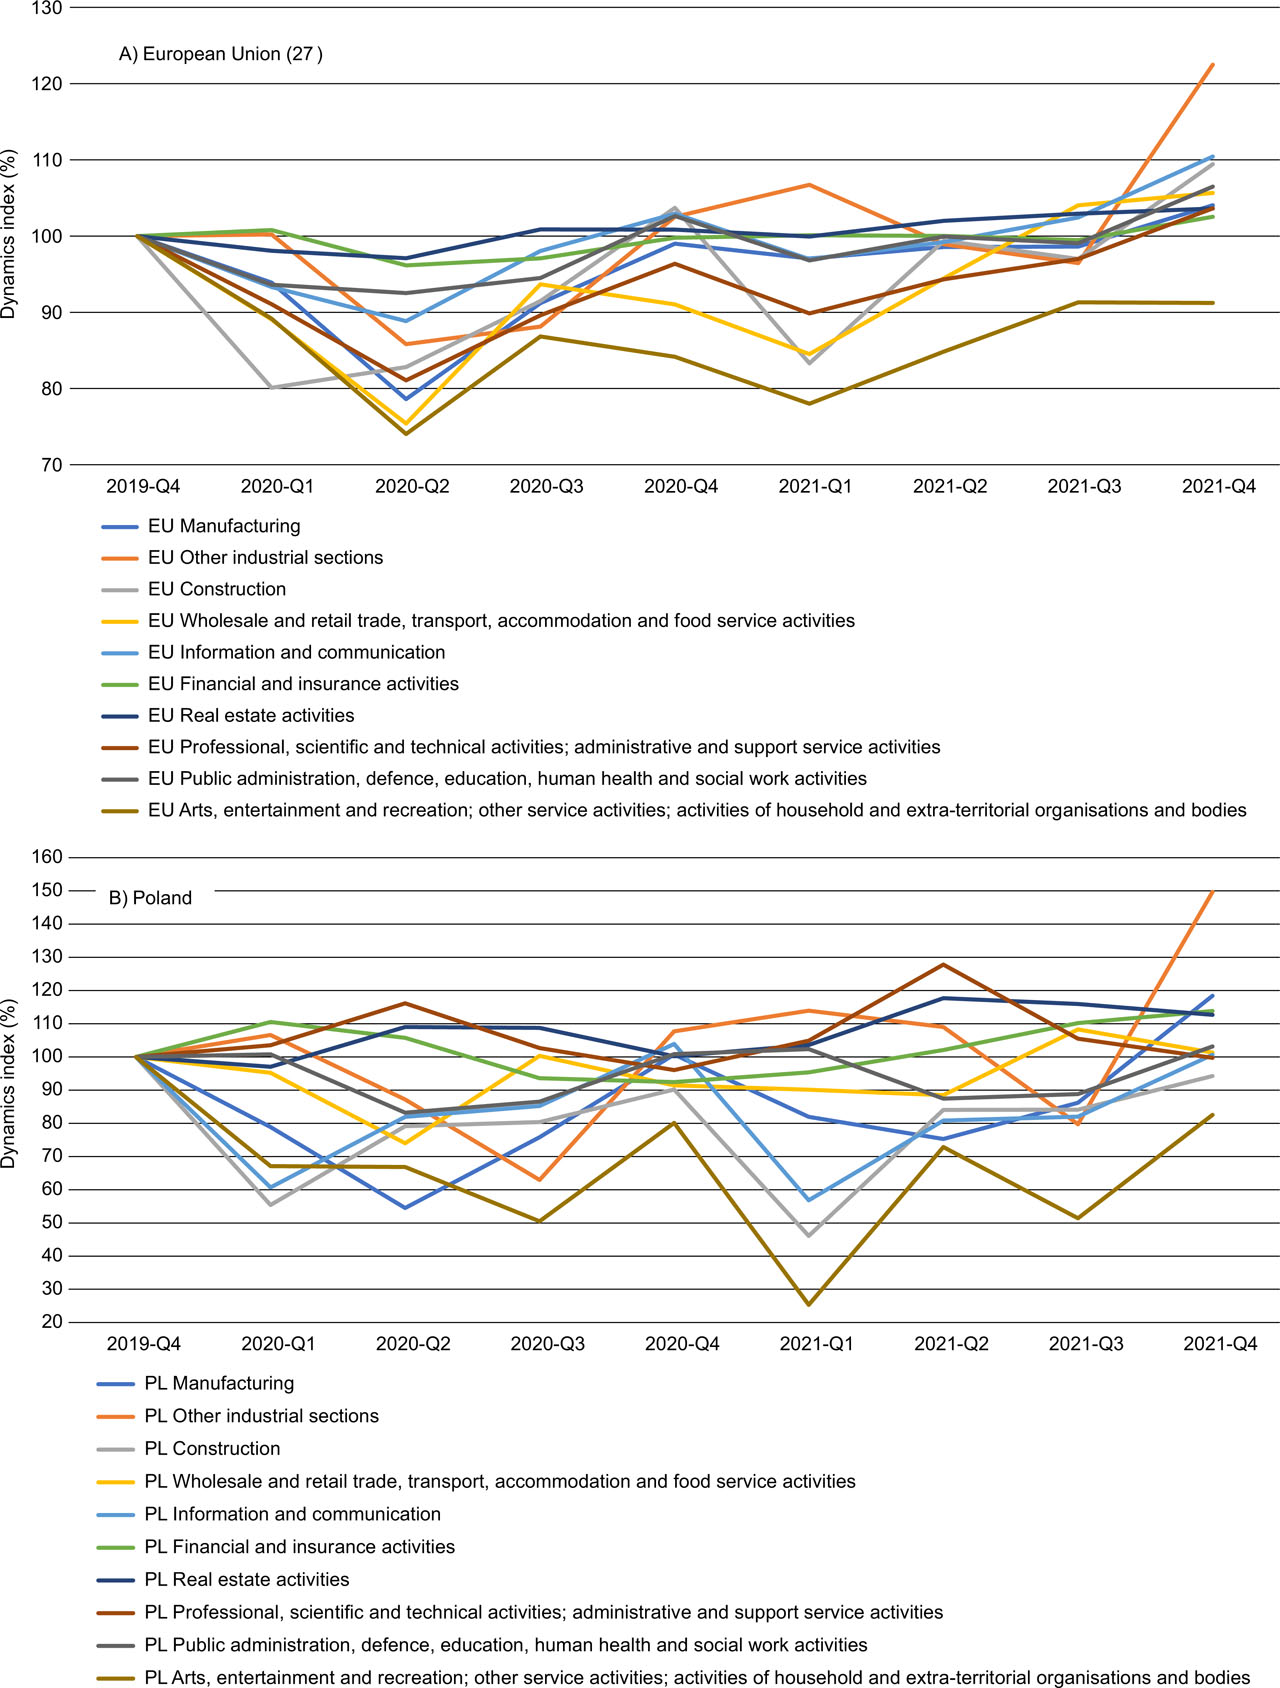
Fig. 1
Gross value added growth in industry and services in the groups of the NACE section in the EU and Poland (2019–Q4 = 100%).
Source: own study based on Eurostat data.
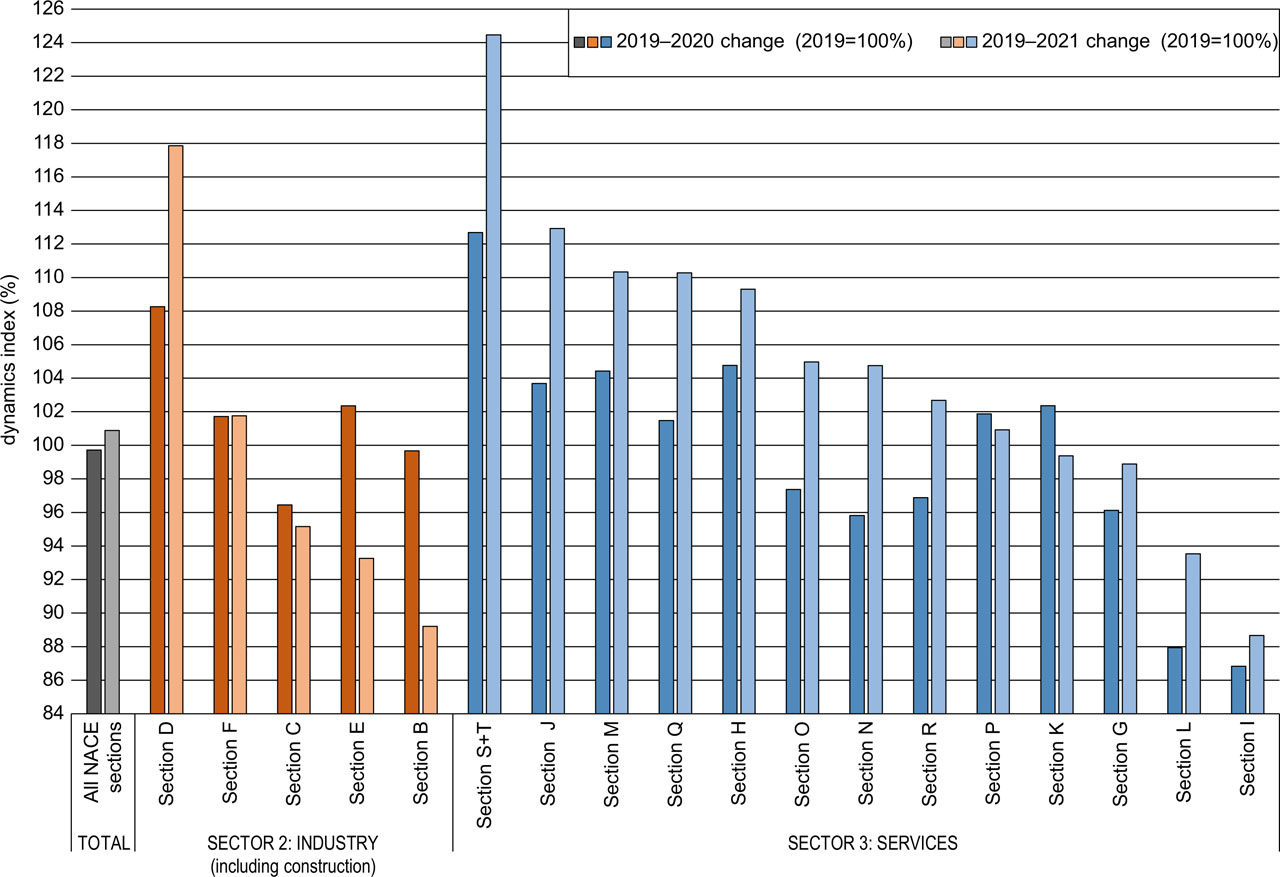
Fig. 2
Employment growth in industry and services by the NACE section in the period of 2019–2021 in Poland (2019 – 100%).
Section B: mining and quarrying; Section C: manufacturing; Section D: electricity, gas, steam and air conditioning supply; Section E: water supply, sewerage, waste management and remediation activities; Section F: construction; Section G: wholesale and retail trade; repair of motor vehicles and motorcycles; Section H: transport and storage; Section I: accommodation and food service activities; Section J: information and communication; Section K: financial and insurance activities; Section L: real estate activities; Section M: professional, scientific and technical activities; Section N: administrative and support service activities; Section O: public administration and defence; compulsory social security; Section P: education; Section Q: human health and social work activities; Section R: arts, entertainment and recreation; Section S+T: other service activities and activities of households as employers; undifferentiated goods- and services-producing activities of households for own use
Source: own study based on Eurostat data.
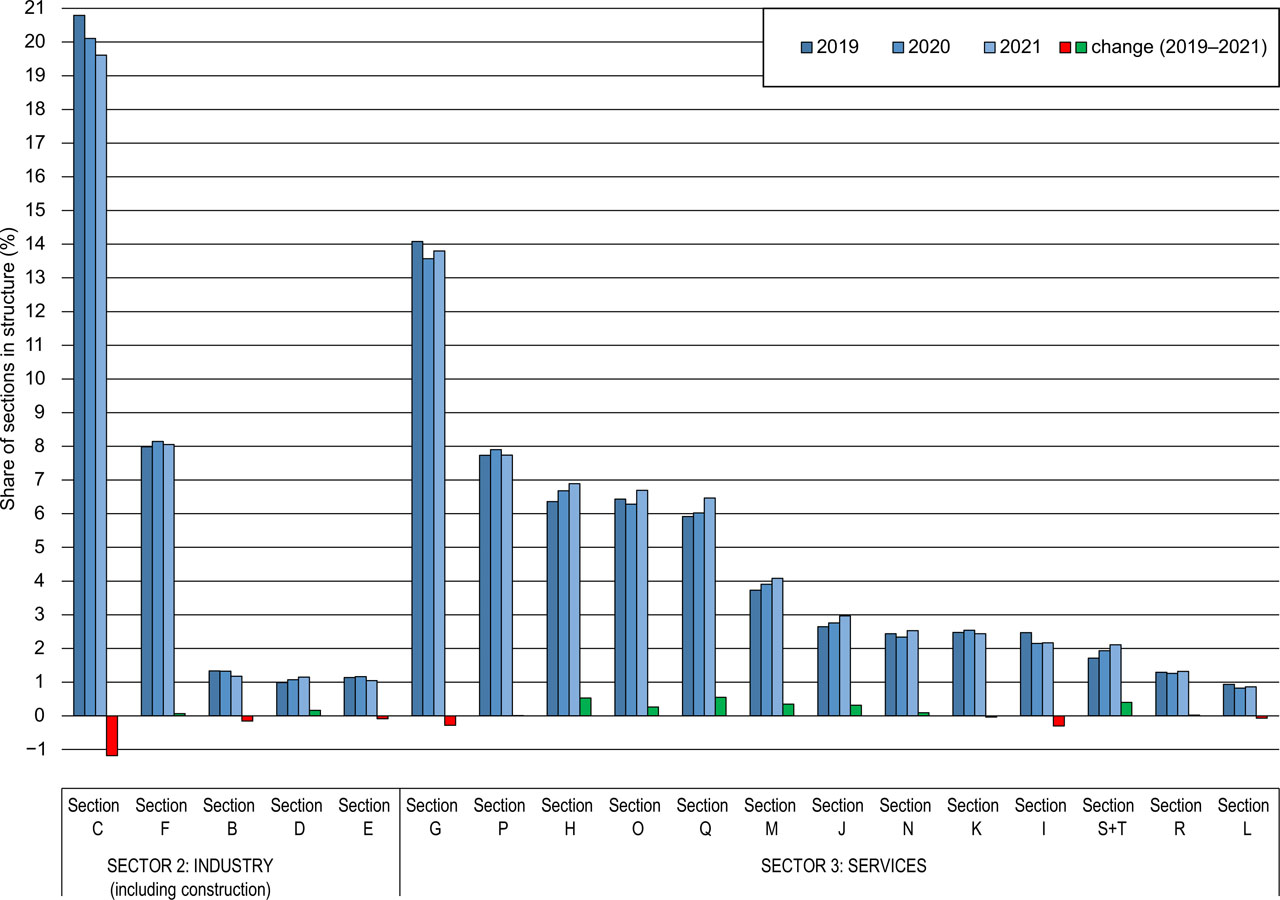
Fig. 3
Changes in the employment structure of industry and services sectors by section in the years 2019–2021 in Poland.
Section B: mining and quarrying; Section C: manufacturing; Section D: electricity, gas, steam and air conditioning supply; Section E: water supply; sewerage, waste management and remediation activities; Section F: construction; Section G: wholesale and retail trade; repair of motor vehicles and motorcycles; Section H: transport and storage; Section I: accommodation and food service activities; Section J: information and communication; Section K: financial and insurance activities; Section L: real estate activities; Section M: professional, scientific and technical activities; Section N: administrative and support service activities; Section O: public administration and defence; compulsory social security; Section P: education; Section Q: human health and social work activities; Section R: arts, entertainment and recreation; Section S+T: other service activities and activities of households as employers; undifferentiated goods- and services-producing activities of households for own use
Source: own study based on Eurostat data.
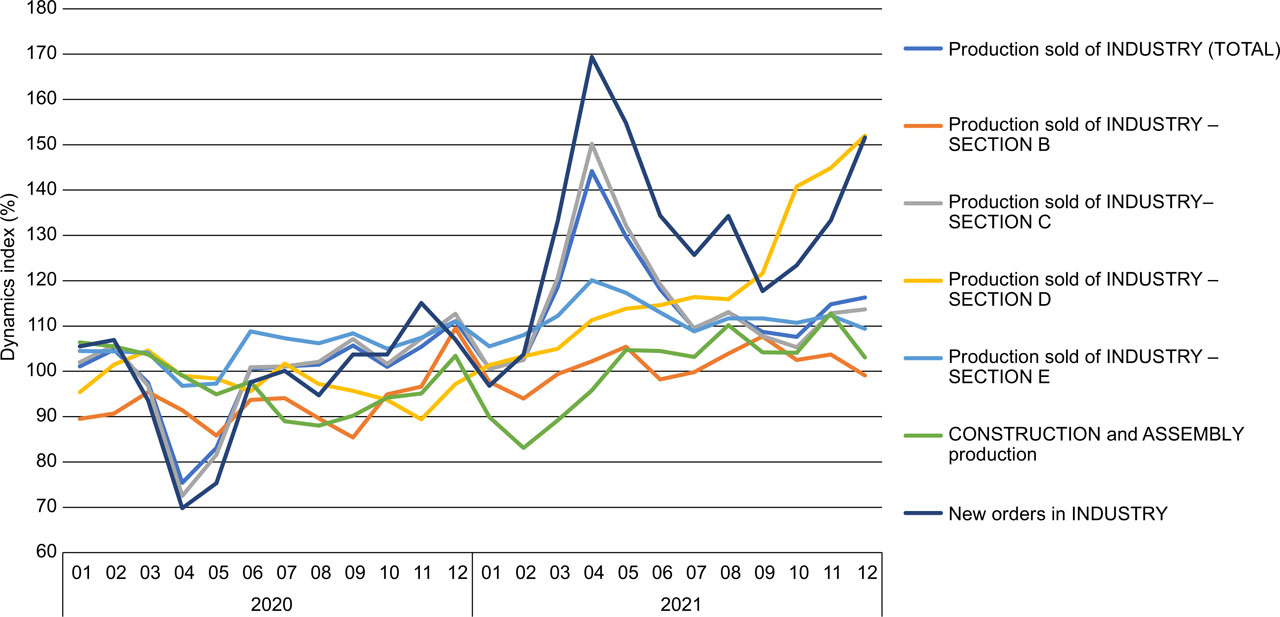
Fig. 4
Dynamics of industrial production sold, construction and new orders in industry in Poland in the years 2020–2021* (corresponding period of the previous year = 100).
*Production in constant prices, new orders in current prices
Section B: mining and quarrying; Section C: manufacturing; Section D: electricity, gas, steam and air conditioning supply; Section E: water supply, sewerage, waste management and remediation activities
Source: own study based on Statistics Poland (GUS) data.
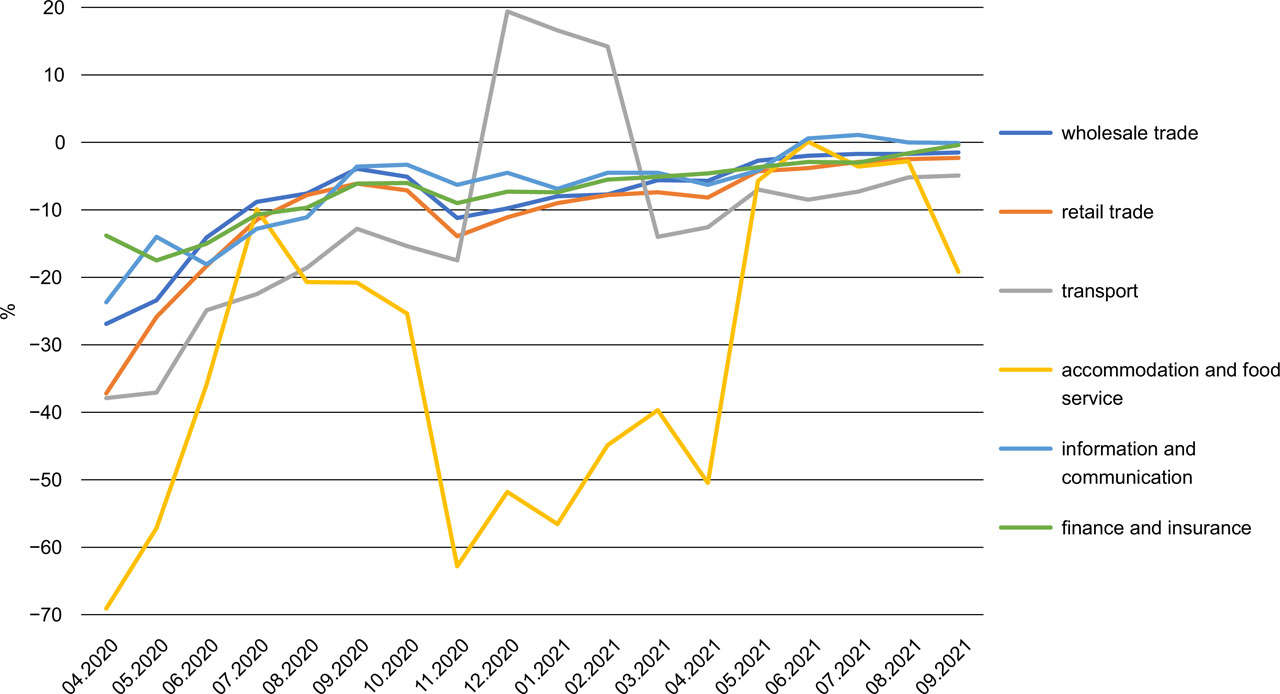
Fig. 5
Change in service orders in Poland between April 2020 and September 20212.
Source: own study based on GUS data from the publication: The impact of the COVID-19 pandemic on the economic situation – assessments and expectations (detailed data and time series) – Annexe to the publication: “Economic situation in manufacturing, construction, trade and services 2000–2021 (September 2021)” (GUS, 2021)
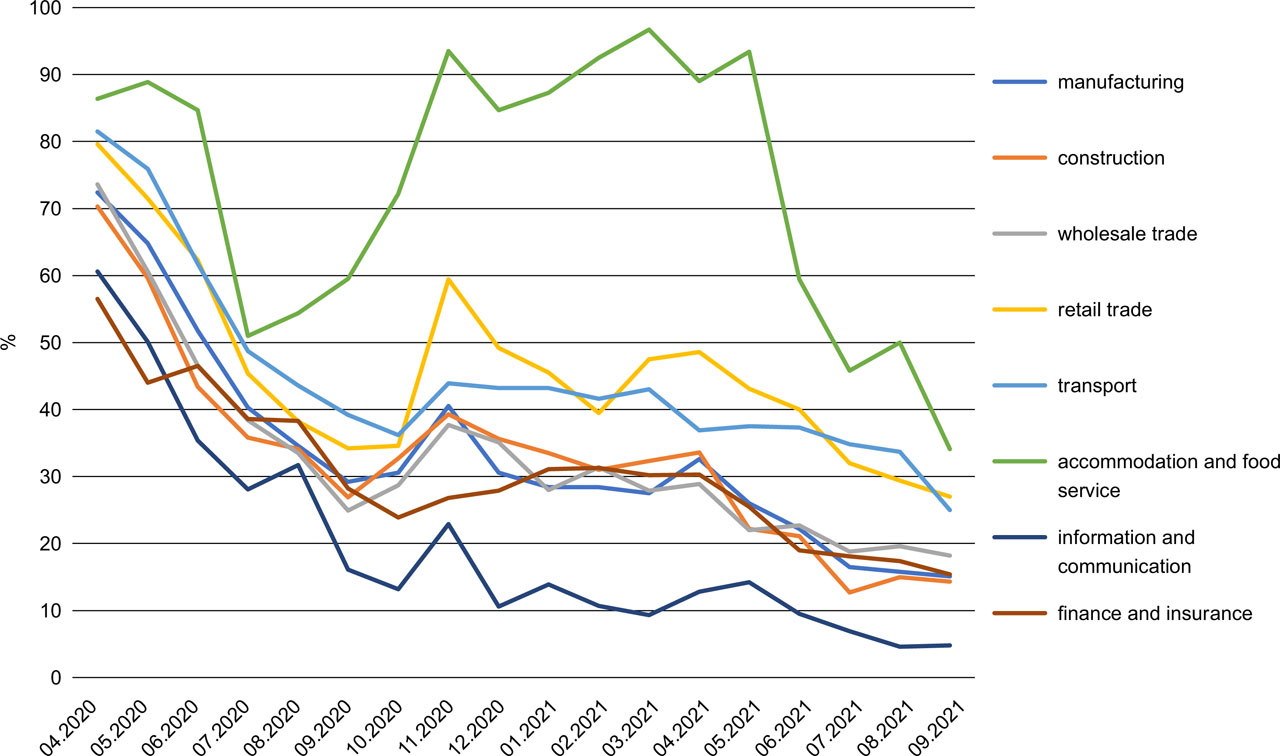
Fig. 6
Proportion of Polish industrial, construction and service enterprises assessing the impact of the COVID-19 pandemic as serious or threatening the stability of the company during the pandemic in Poland, from April 2020 to September 2021.
Source: own study based on GUS data from the publication: The impact of the COVID-19 pandemic on the economic situation – assessments and expectations (detailed data and time series) – Annexe to the publication: “Economic situation in manufacturing, construction, trade and services 2000–2021 (September 2021)” (GUS, 2021).