
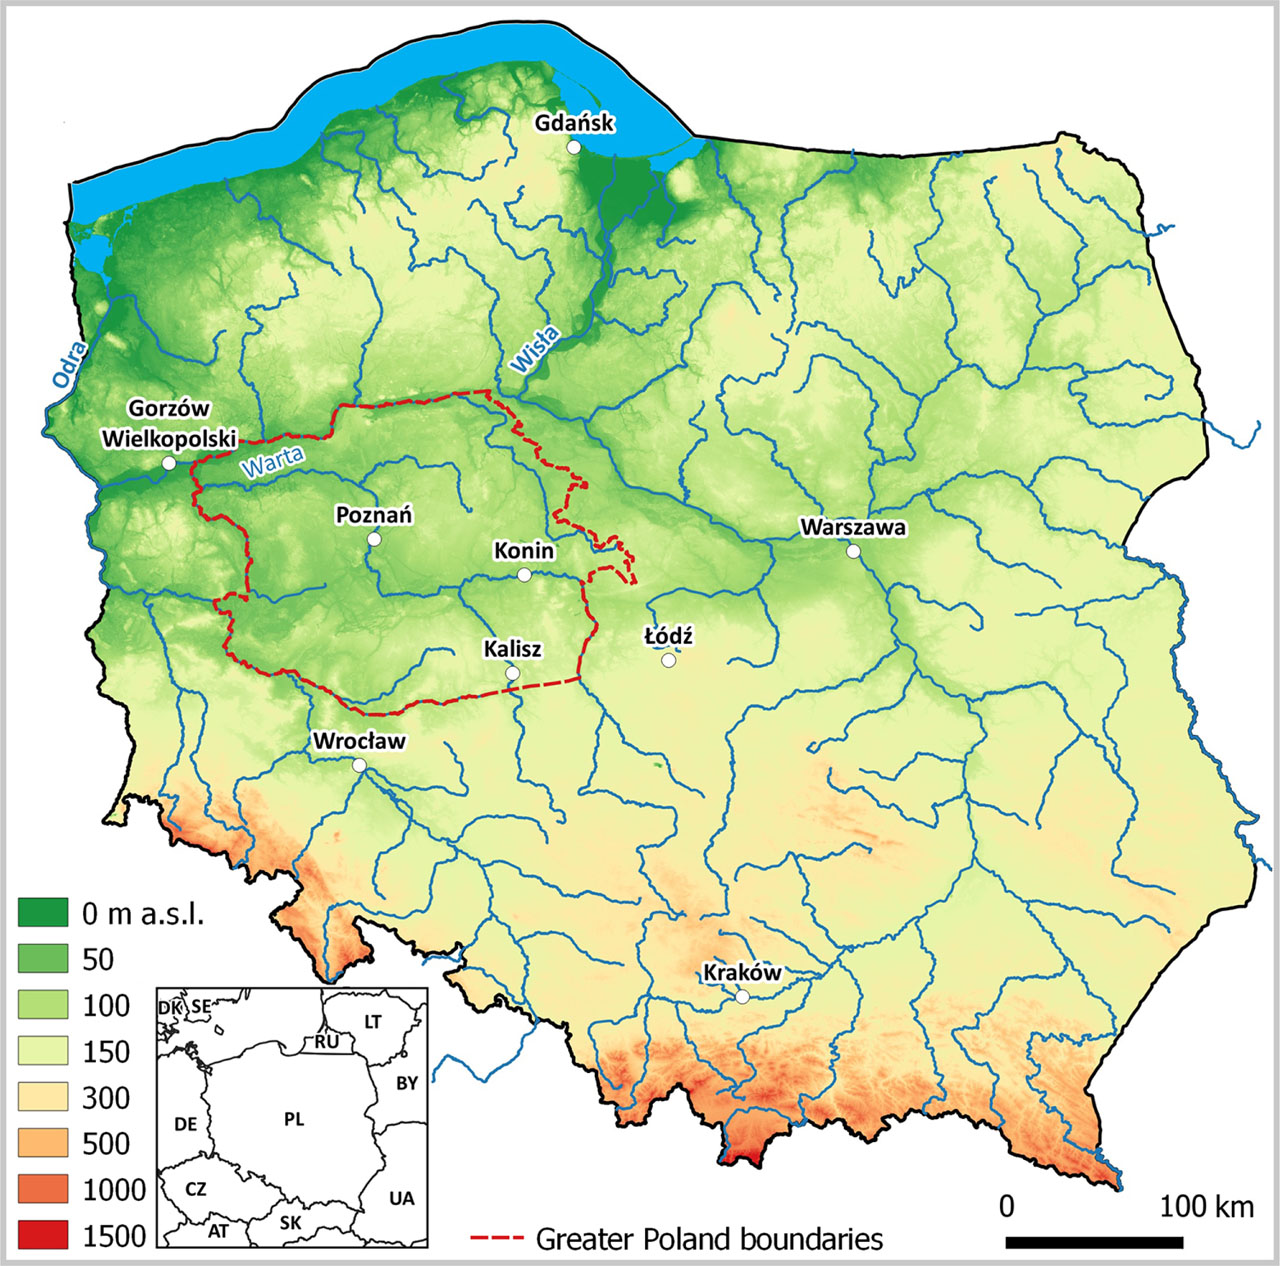
Fig. 1
Geographical position of the Greater Poland region in Poland.
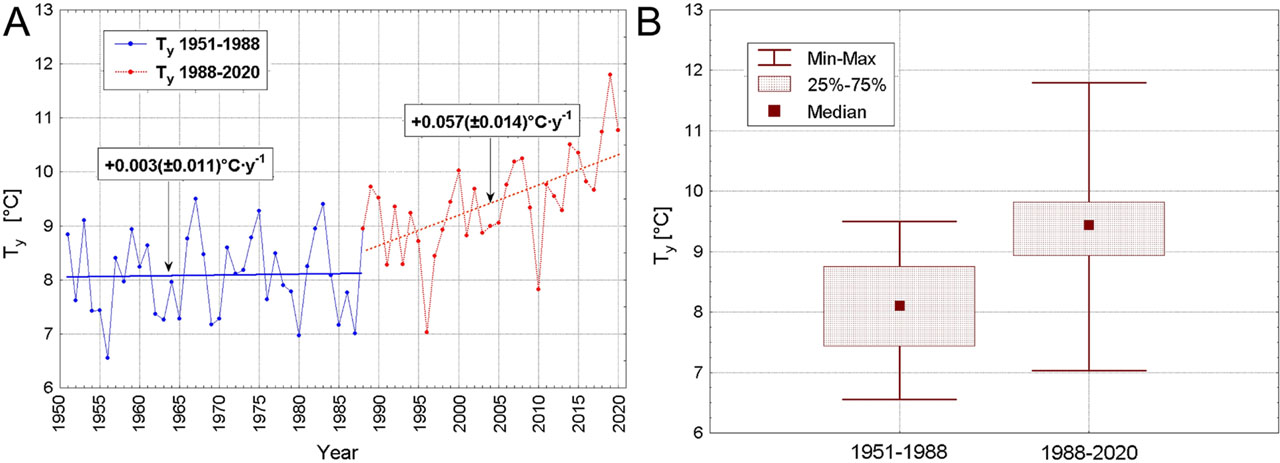
Fig. 2
The annual air temperature (Ty) with values of linear trends and the standard error of their estimation (in brackets) (A), and its variability ranges (B) in Poznań in sub-periods 1951–1988 and 1988–2020.
Table 1
Basic statistics of the annual air temperature in Poznań in the two sub-periods.
| Period | Number of years | Minimum | Average | Median | Maximum | Standard deviation |
|---|---|---|---|---|---|---|
| [°C] | [σ] | |||||
| 1951–1988 | 38 | 6.553 | 8.092 | 8.102 | 9.499 | 0.761 |
| 1988–2020 | 33 | 7.031 | 9.423 | 9.442 | 11.800 | 0.925 |
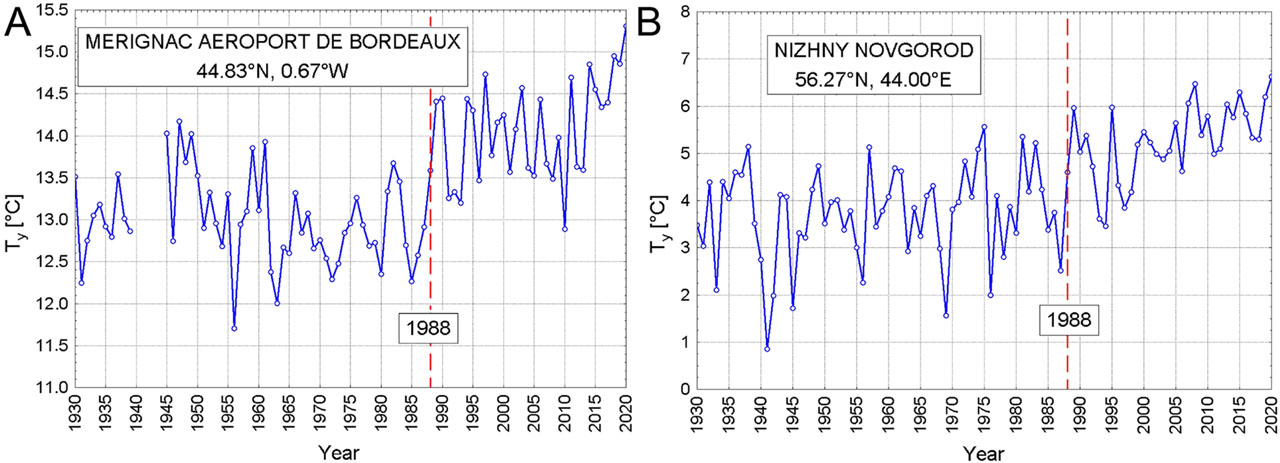
Fig. 3
The annual air temperature at Merignac Aeroport de Bordeaux (France, coast of the Bay of Biscay) (A) and at Nizhny Novgorode (the European part of the Russian Federation, around 350 km ENE of Moscow) (B) in 1930–2020. 1988 is marked with a vertical dashed line. The data in (A) are incomplete due to the Second World War.
Table 2
Values of the correlation coefficients between selected climatic elements in Poznań.
| Parameter | N | P | f | SD | SDApr–Sep | Vw |
|---|---|---|---|---|---|---|
| T | r = −0,12 n = 70 p = 0.325 | r = −0.05 n = 70 p = 0.691 | r = −0.62* n = 70 p <<0.001 | r = 0.71* n = 62 p << 0.001 | r = 0.73* n = 62 p << 0.001 | r = −0.21 n = 70 p = 0.078 |
| N | 1.00 | r = 0.56* n = 70 p << 0.001 | r = 0.49* n = 70 p << 0.001 | r = −0.44* n = 62 p << 0.001 | r = −0.36 n = 62 p = 0.004 | r = 0.25 n = 70 p = 0.041 |
| P | 1.00 | r = 0.55* n = 70 p << 0.001 | r = −0.31 n = 62 p = 0.014 | r = −0.26 n = 62 p = 0.038 | r = 0,14 n = 70 p = 0.252 | |
| f | 1.00 | r = −0.70* n = 62 p << 0.001 | r = −0.68* n = 62 p << 0.001 | r = 0.09 n = 70 p = 0.447 | ||
| SD | 1.00 | r = 0.96* n = 62 p << 0.001 | r = −0.51* n = 62 p << 0.001 | |||
| SDApr–Sep | 1.00 | r = −0.48* n = 62 p << 0.001 |
[i] n denotes number of the correlated pairs and p the statistical significance of their relationship. In the case when n = 70, the correlated series cover the period 1951–2020, and in the case when n = 61, the period 1959–2020. Significant (p < 0.05) correlation coefficients are marked in bold, highly significant are additionally marked with asterisk; SD, sunshine duration.
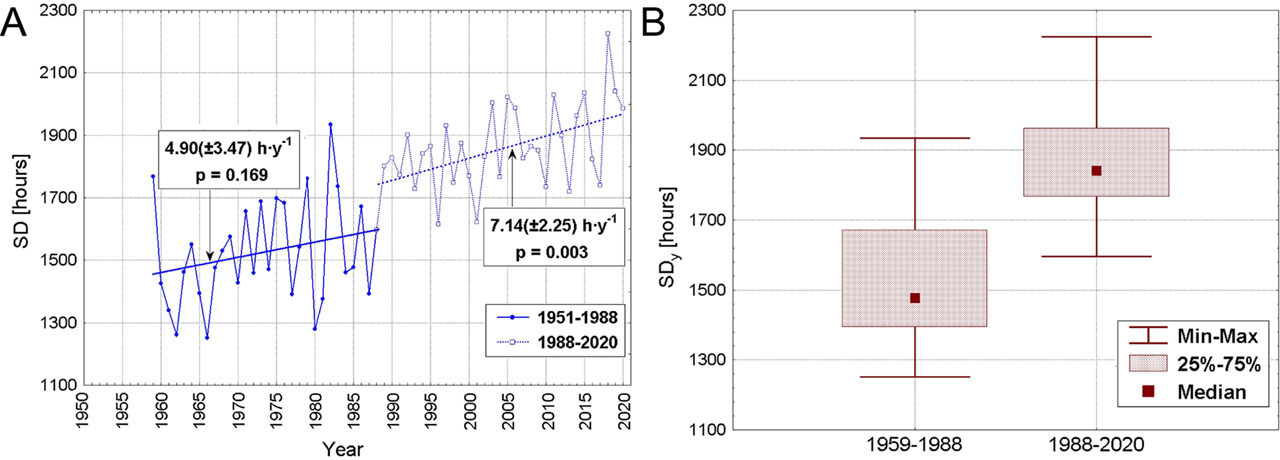
Fig. 4
The annual SDy with marked values of trends and their statistical significance (p) (A), and its variability ranges (B) in Poznań in sub-periods 1959–1988 and 1988–2020. SD, sunshine duration.
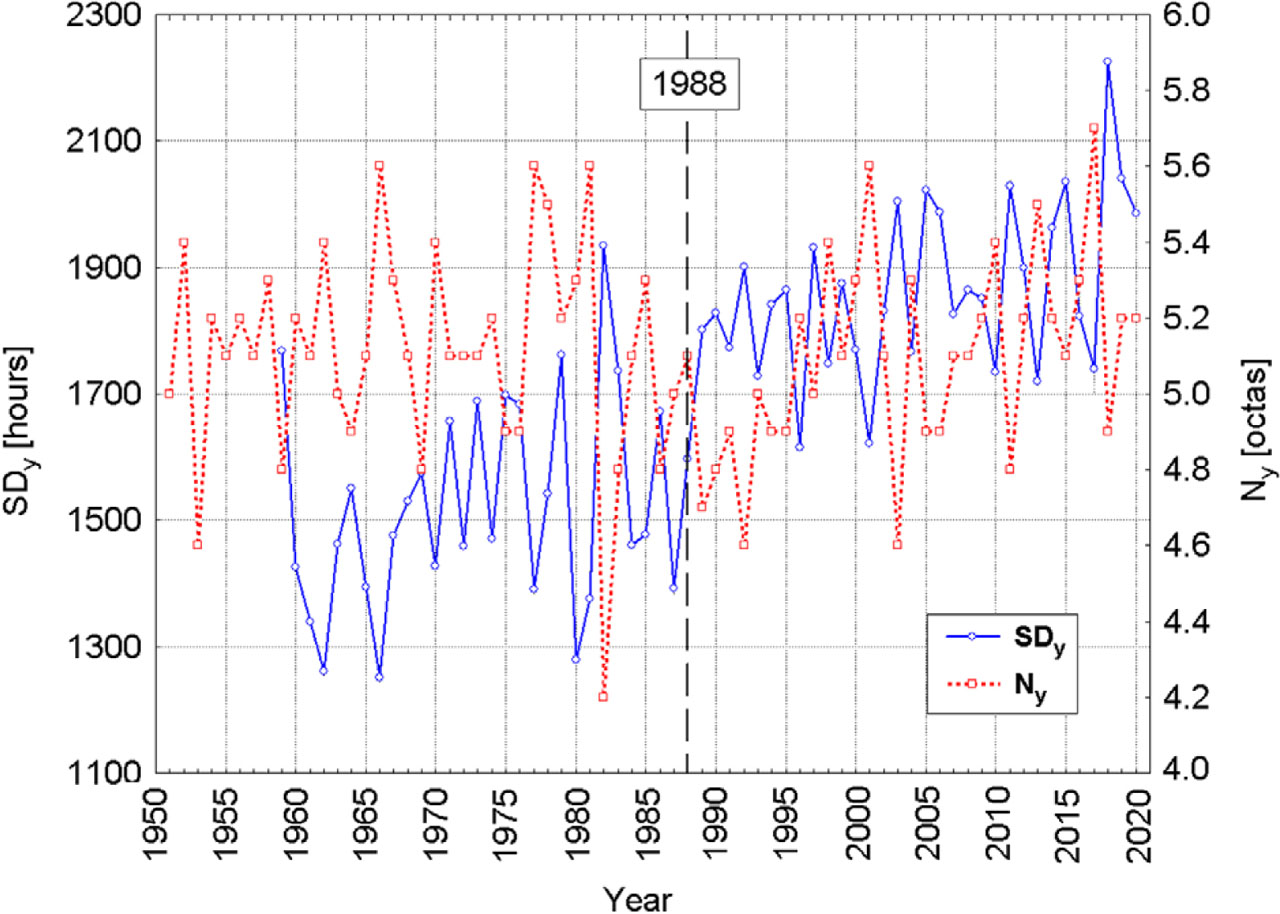
Fig. 5
The annual SDy and annual total cloud cover (Ny) in Poznań in 1951–2020. The year of temperature and SDy discontinuity is marked with vertical dashed line. SD, sunshine duration.
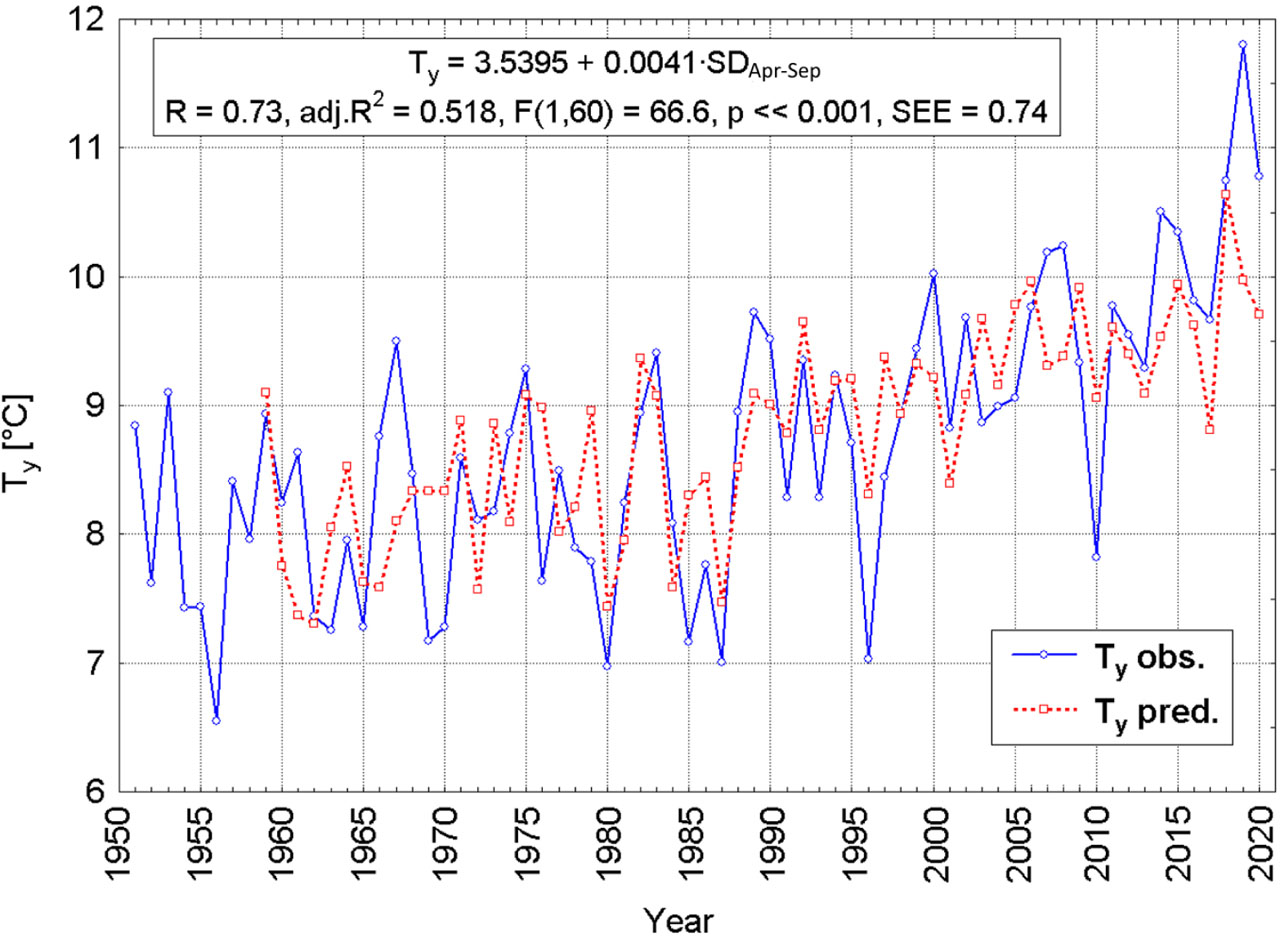
Fig. 6
The annual temperature observed (Ty obs.) and estimated (Ty pred.) in Poznań in 1951–2020 as a function of the insolation of the warm half-year.
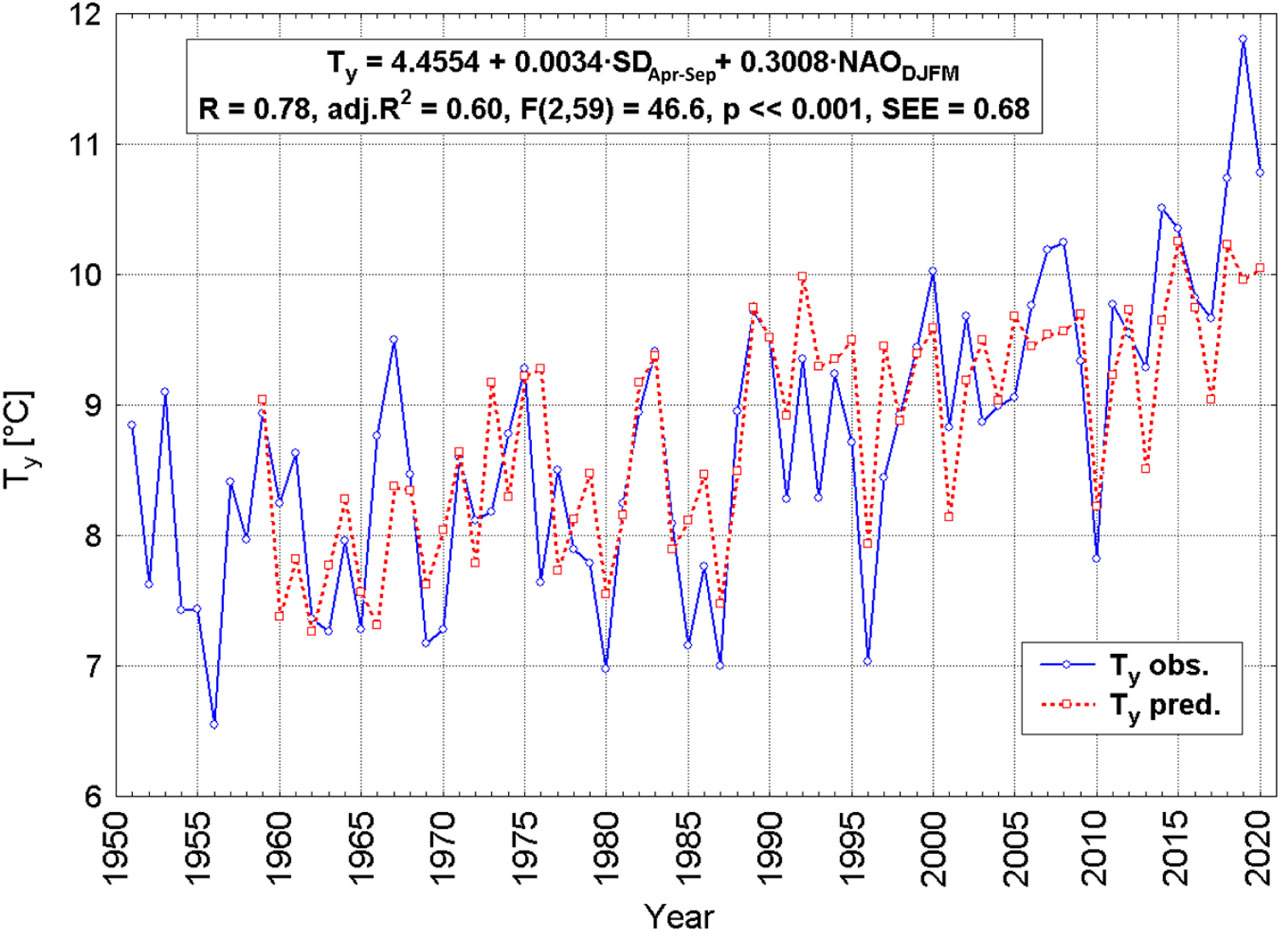
Fig. 7
The annual temperature observed (Ty obs.) and estimated (Ty pred.) in Poznań in 1951–2020 as a function of SD of the warm half-year (variable SDApr–Sep) and the winter PC-based NAO Hurrell index (variable NAODJFM). NAO, North Atlantic Oscillation; SD, sunshine duration.
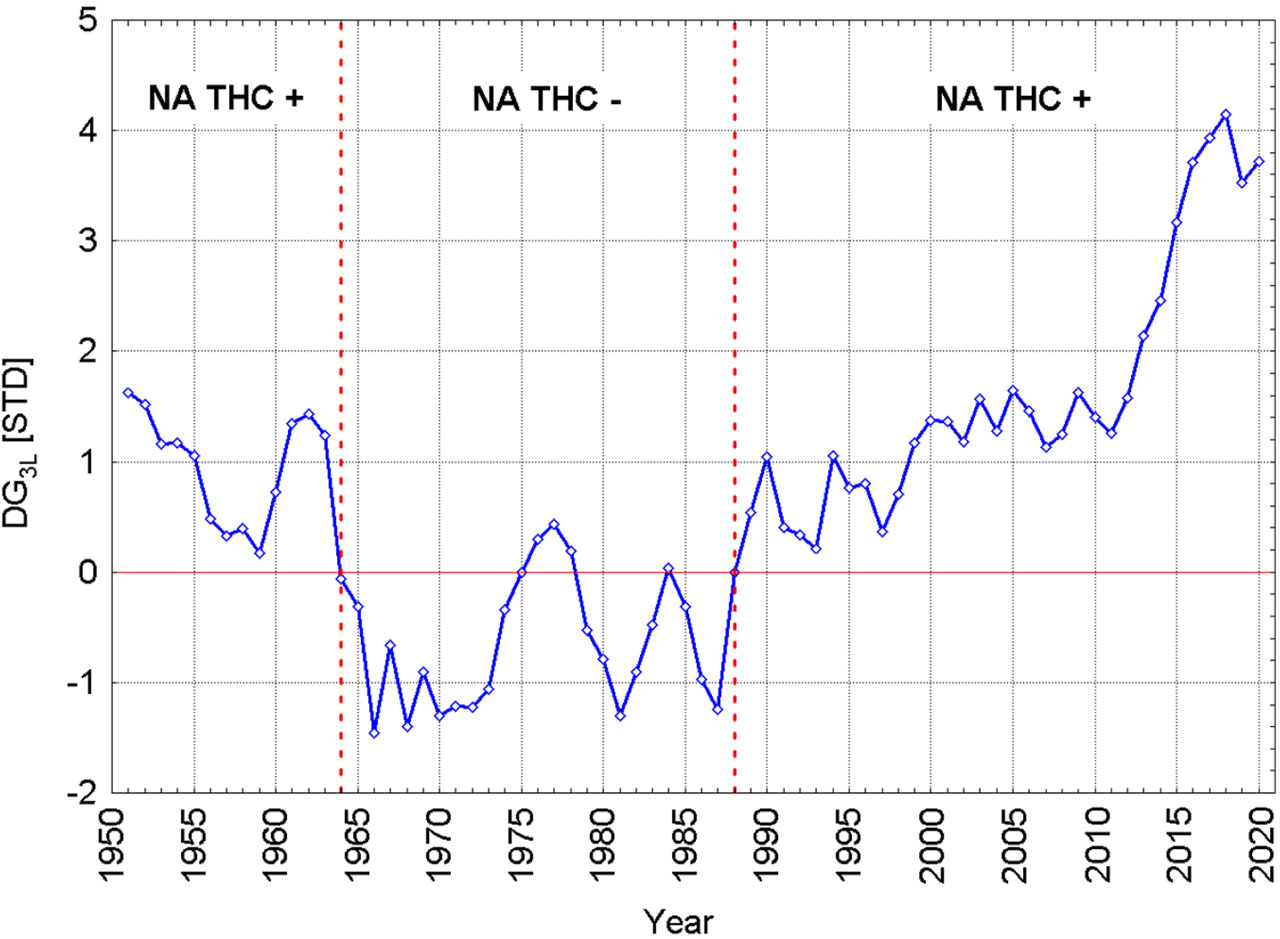
Fig. 8
The standardised DG3L index characterising the intensity of heat transport through the thermohaline circulation (NA THC) from the Atlantic tropics to the Arctic. Vertical dashed lines mark the NA THC phase changes. The index values were calculated based on the ERSST v.5 dataset. NA THC, North Atlantic thermohaline circulation.
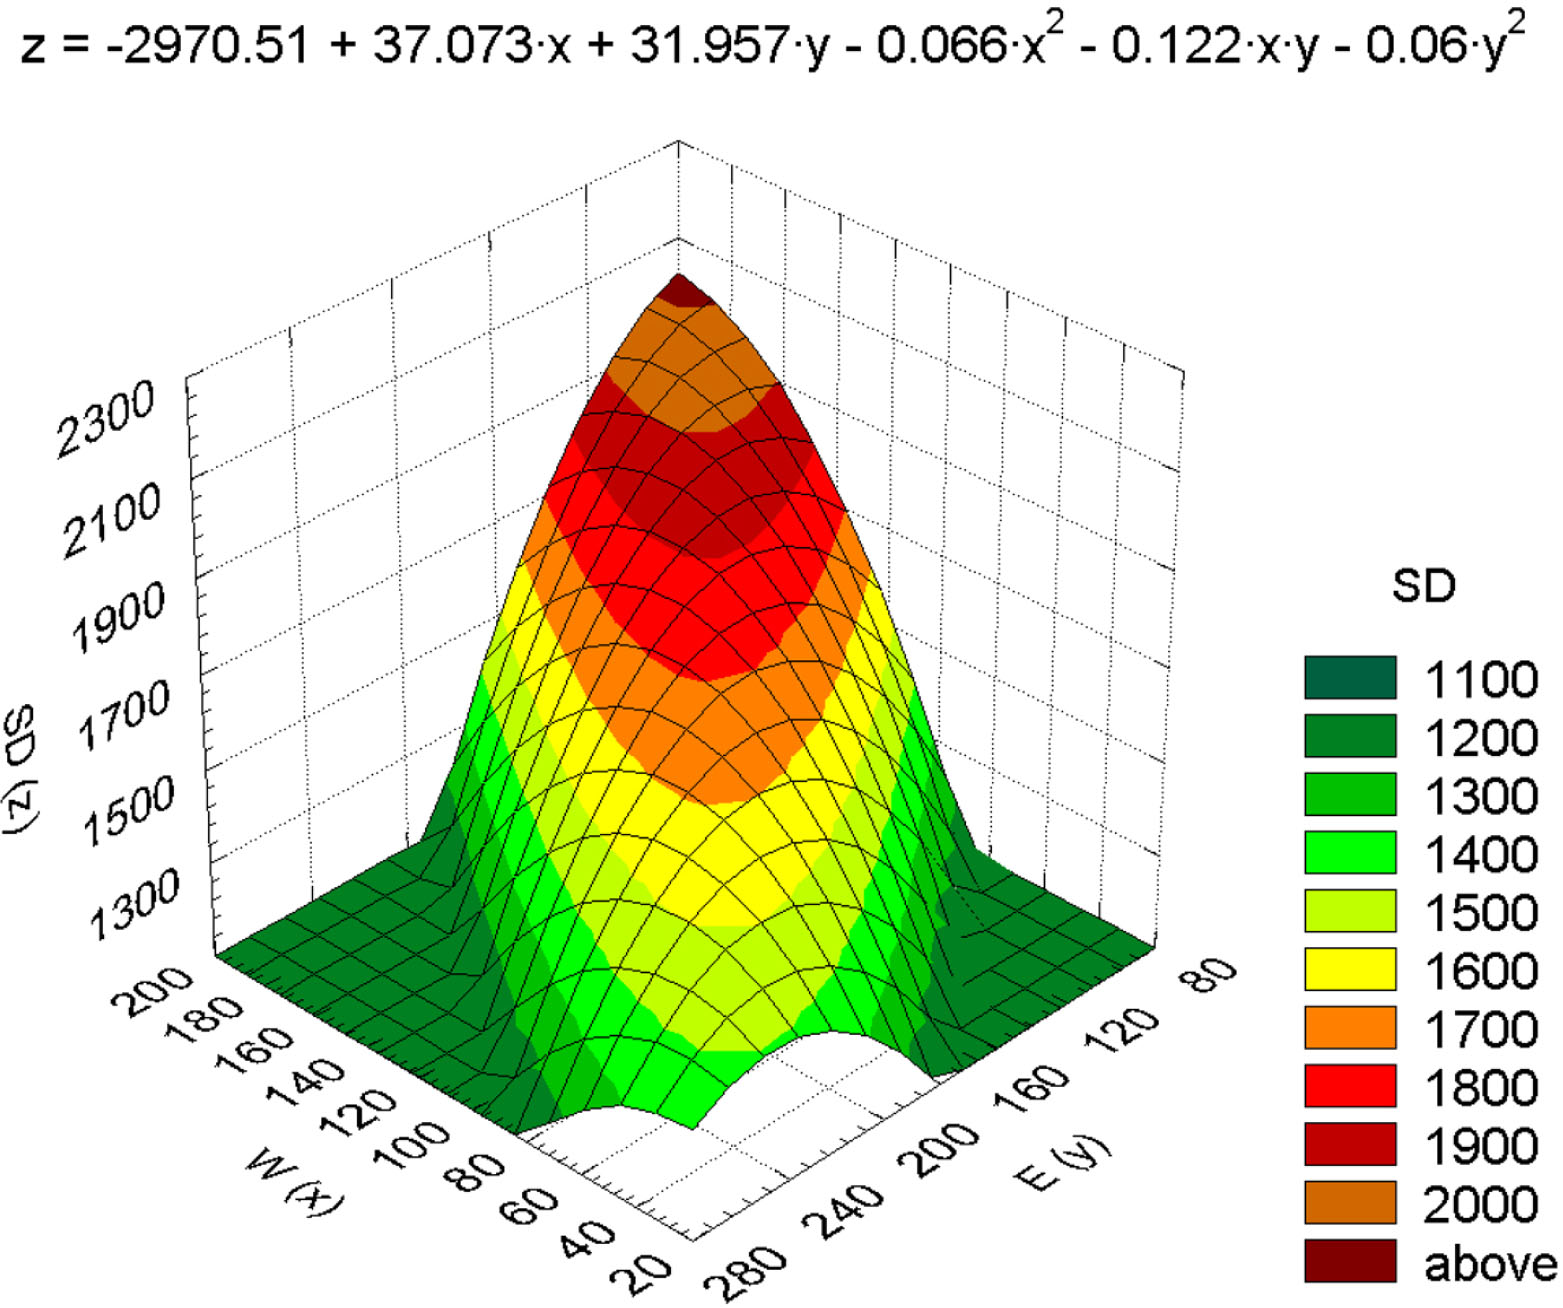
Fig. 9
Relationship between the annual SD (unit: hours) in Poznań and the annual frequency of macrotypes W and E of the mid-tropospheric circulation (unit: number of days per year) in 1959–2020. SD, sunshine duration.
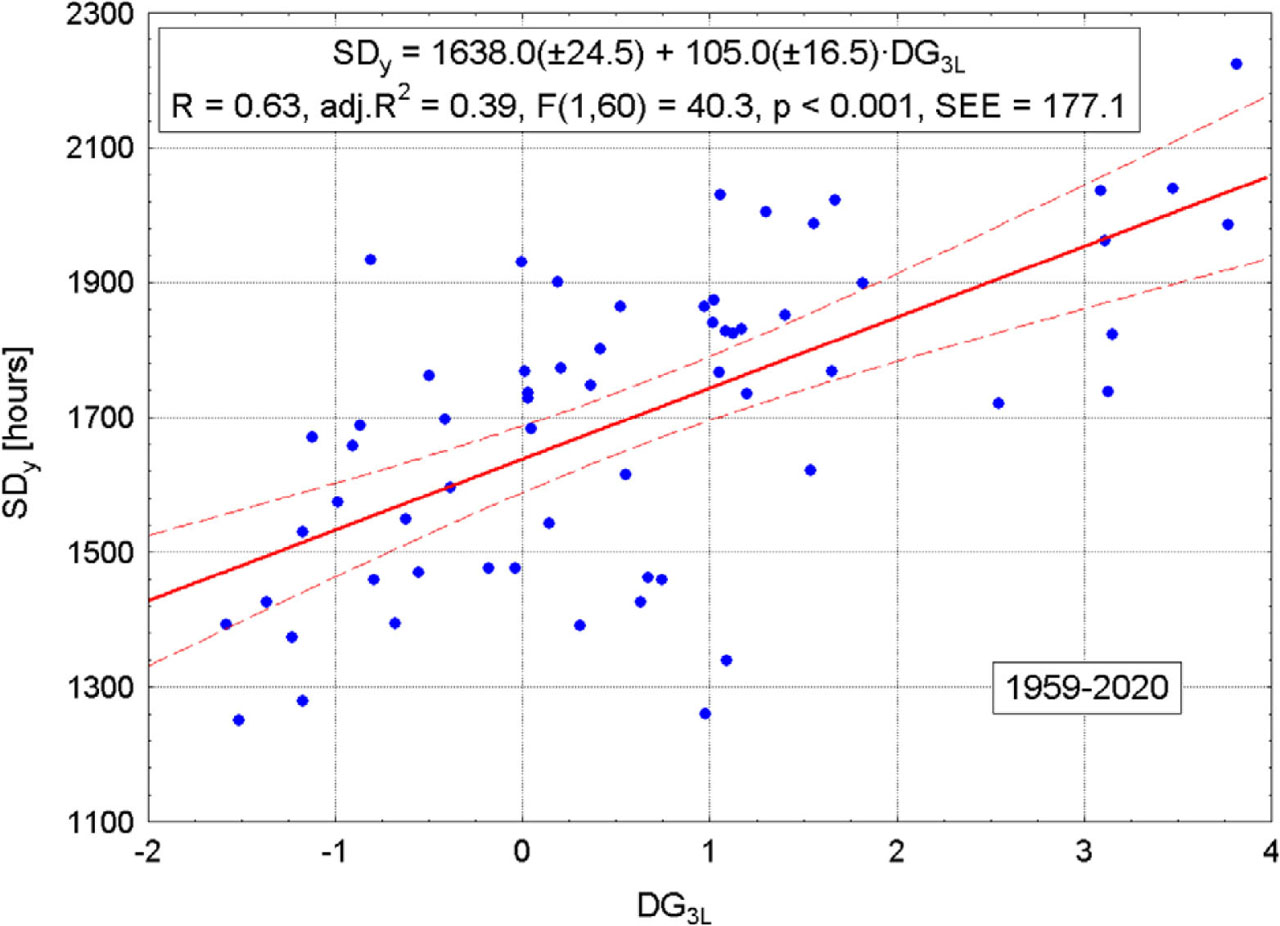
Fig. 10
Relationship between the annual SDy in Poznań and the DG3L index characterising the NA THC intensity in the North Atlantic in 1959–2020. The regression line is marked with bold solid line and boundaries of confidence level of 95% (p = 0.05) with dashed lines. NA THC, North Atlantic thermohaline circulation; SD, sunshine duration.
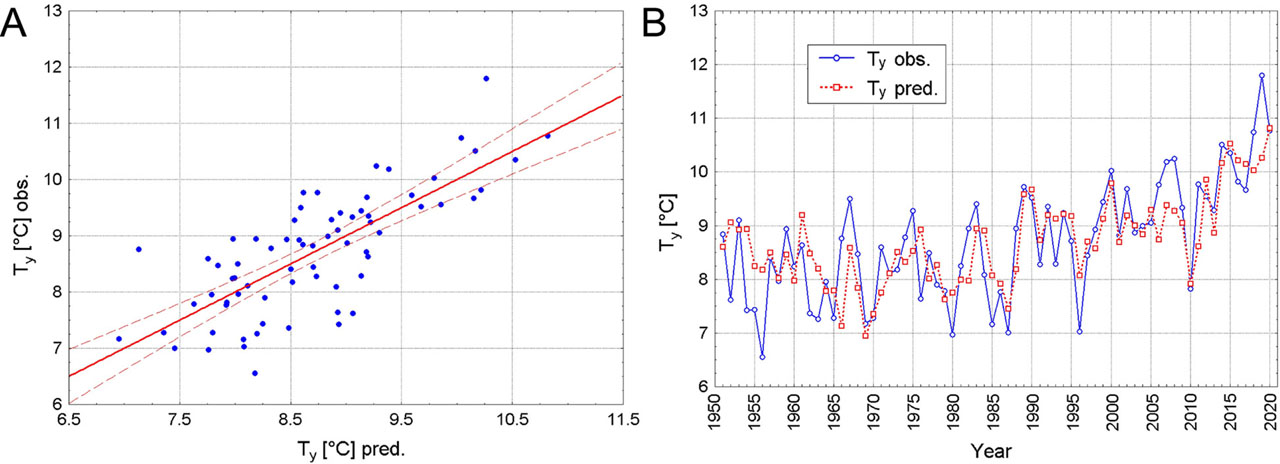
Fig. 11
Values of the annual temperature (Ty pred.) estimated using Eq. (2) in relation to the observed values (Ty obs.) (A) and their course (Ty pred.) estimated using Eq. (1) and the observed values (Ty obs.) (B) in Poznań in 1951–2020.
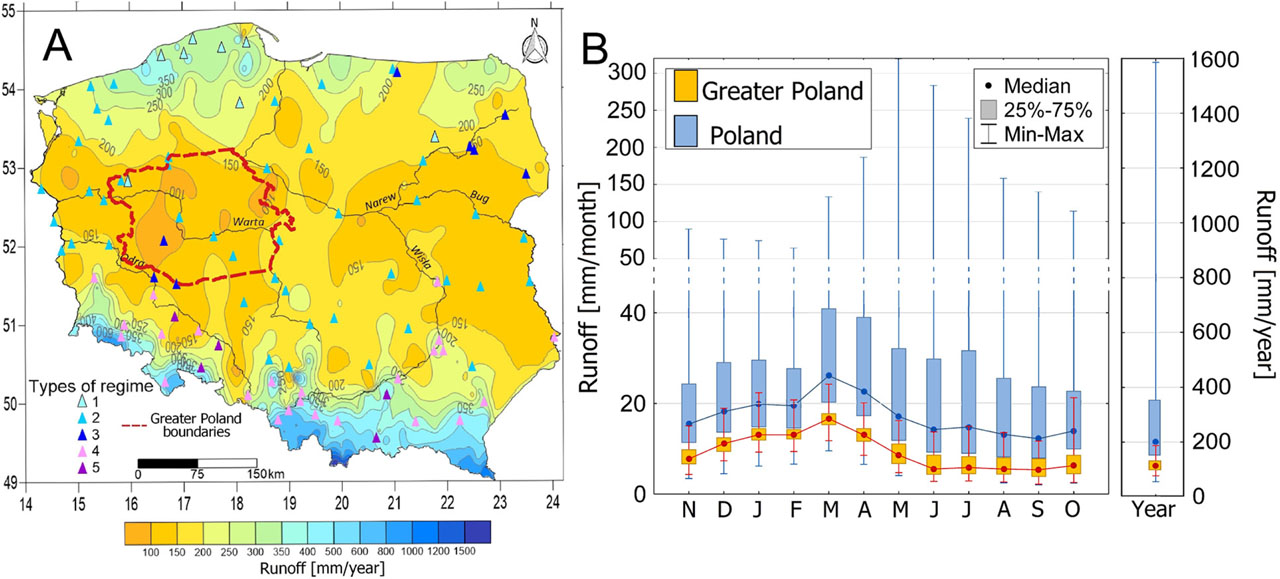
Fig. 12
River runoff and types of the river regime in Poland (A) (types of regimes: 1 – nival poorly formed; 2 – nival moderately formed; 3 – nival well-formed; 4 – nival-pluvial; 5 – pluvial-nival [after Wrzesiński 2021]), and the scope of changes in monthly and annual runoff of rivers in the Greater Poland region and Poland in 1971–2015 (B) (after Wrzesiński and Perz 2019a, b).
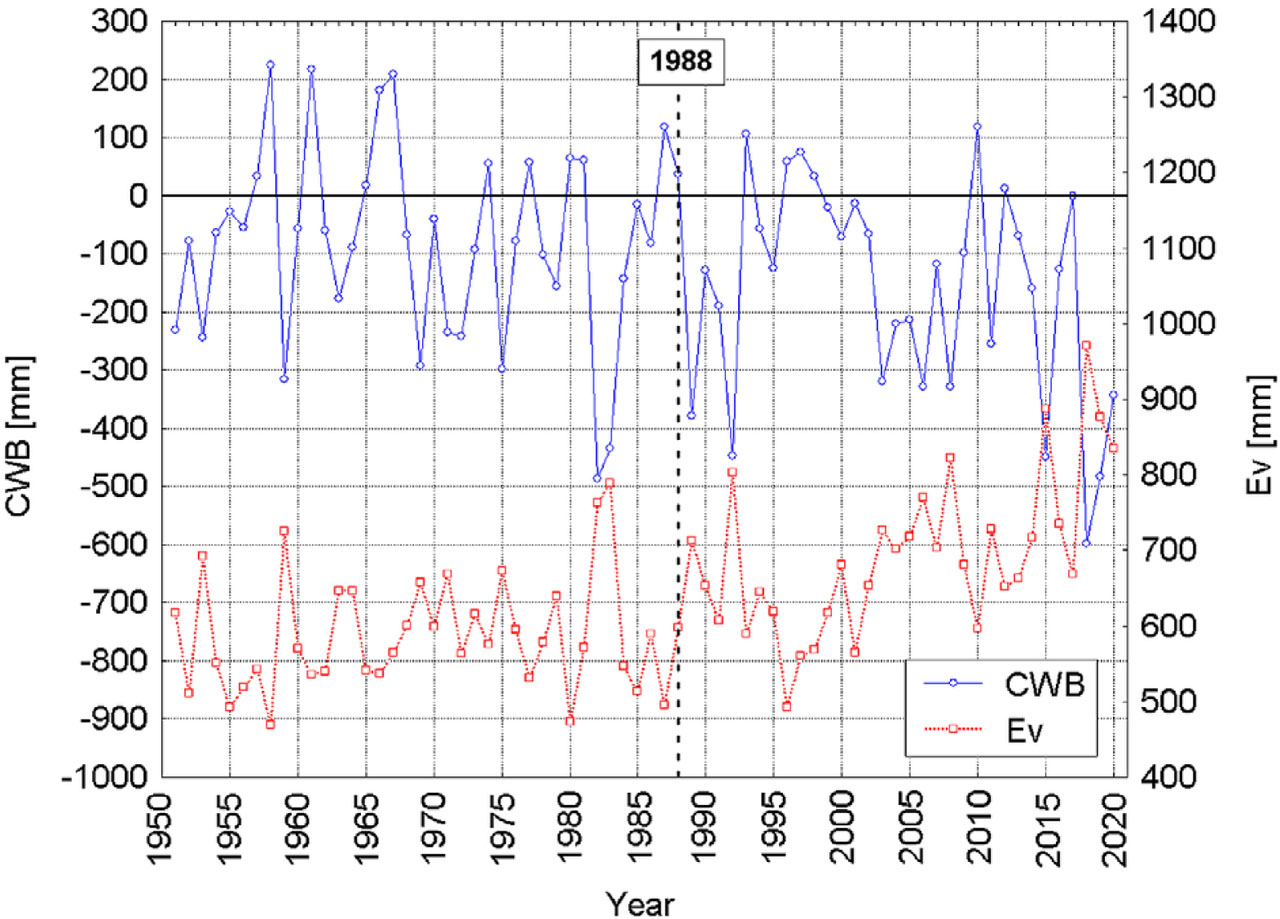
Fig. 13
The CWB in the calendar year (January–December) (CWB, unit: millimetre of water column) and the annual field evaporation (Ev, unit: millimetre of water column) in Poznań in 1951–2020. The vertical dotted line marks the year when the climate regime changed (1988). CWB, climatic water balance.
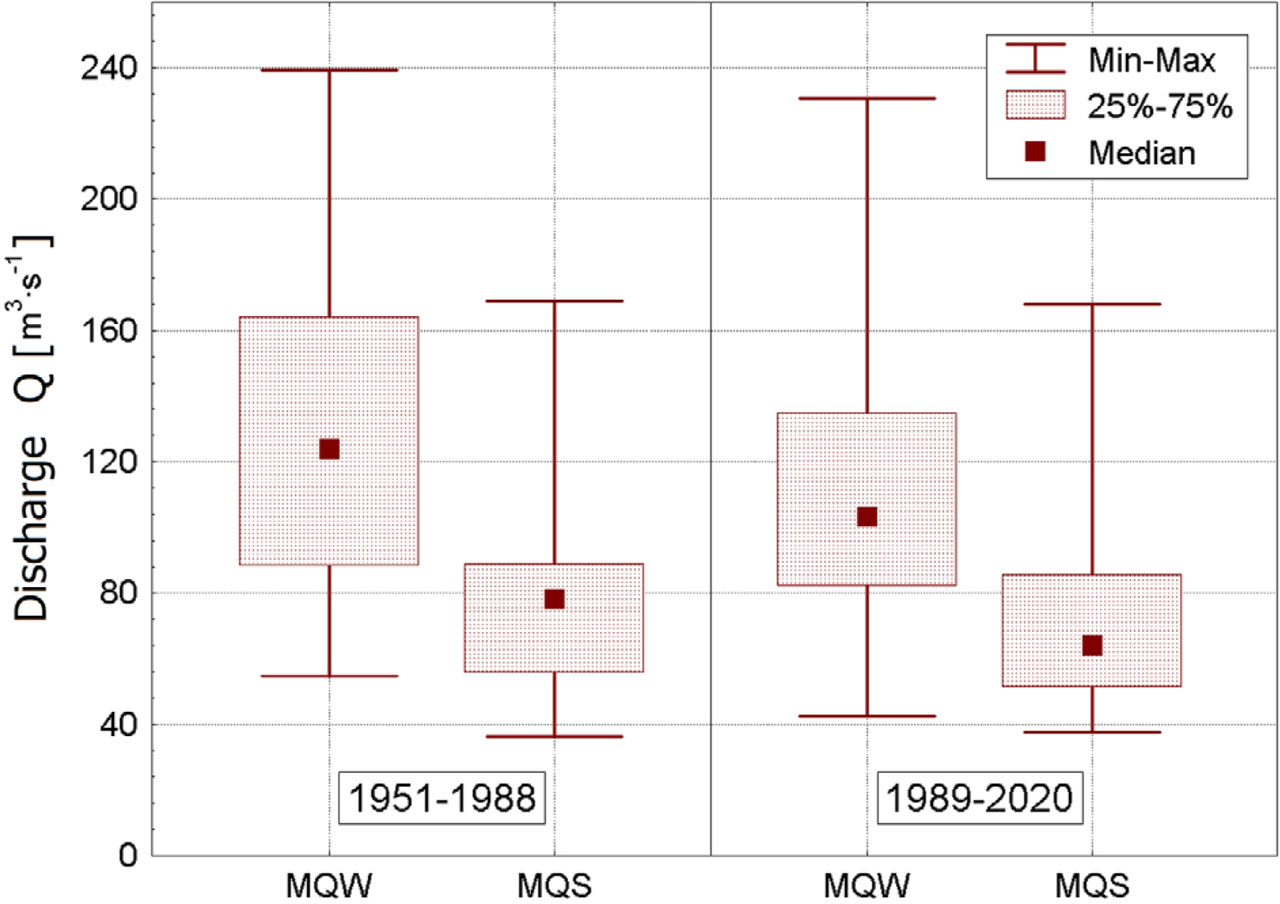
Fig. 14
Range of variability of the seasonal discharge of the Warta River in Poznań in sub-periods 1951–1988 and 1989–2020. MQW, average discharge in the cold half-year (November–April; unit: m3 · s−1); MQS, average discharge in the warm half-year (May–October; unit: m3 · s−1).