

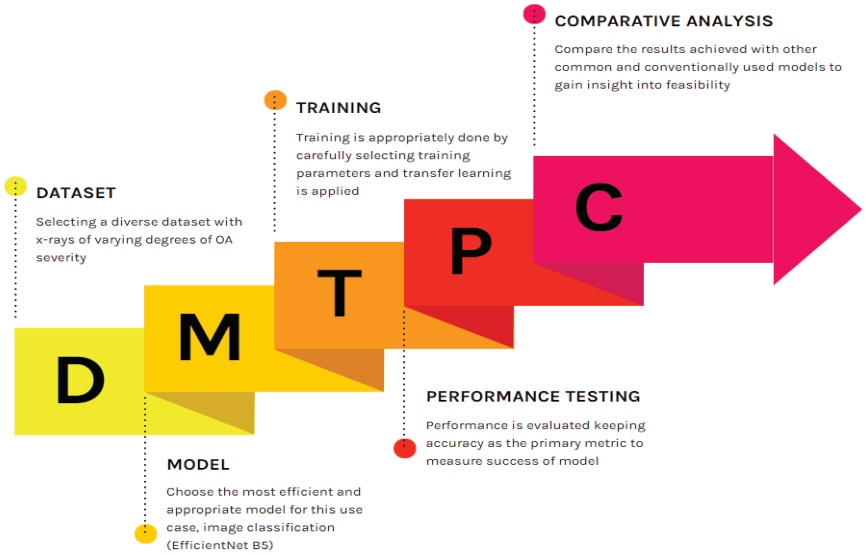
Figure 1.
Flow diagram describing the model development and testing process
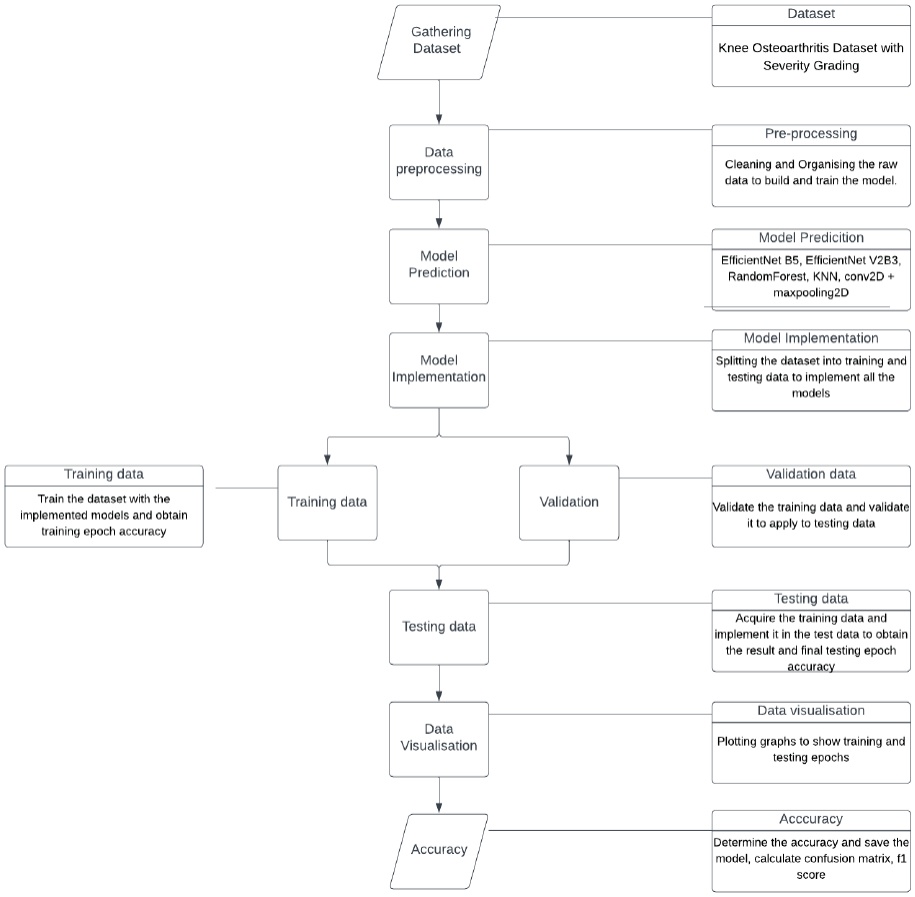
Figure 2.
Flow chart detailing the data training and validation stages of the methodology
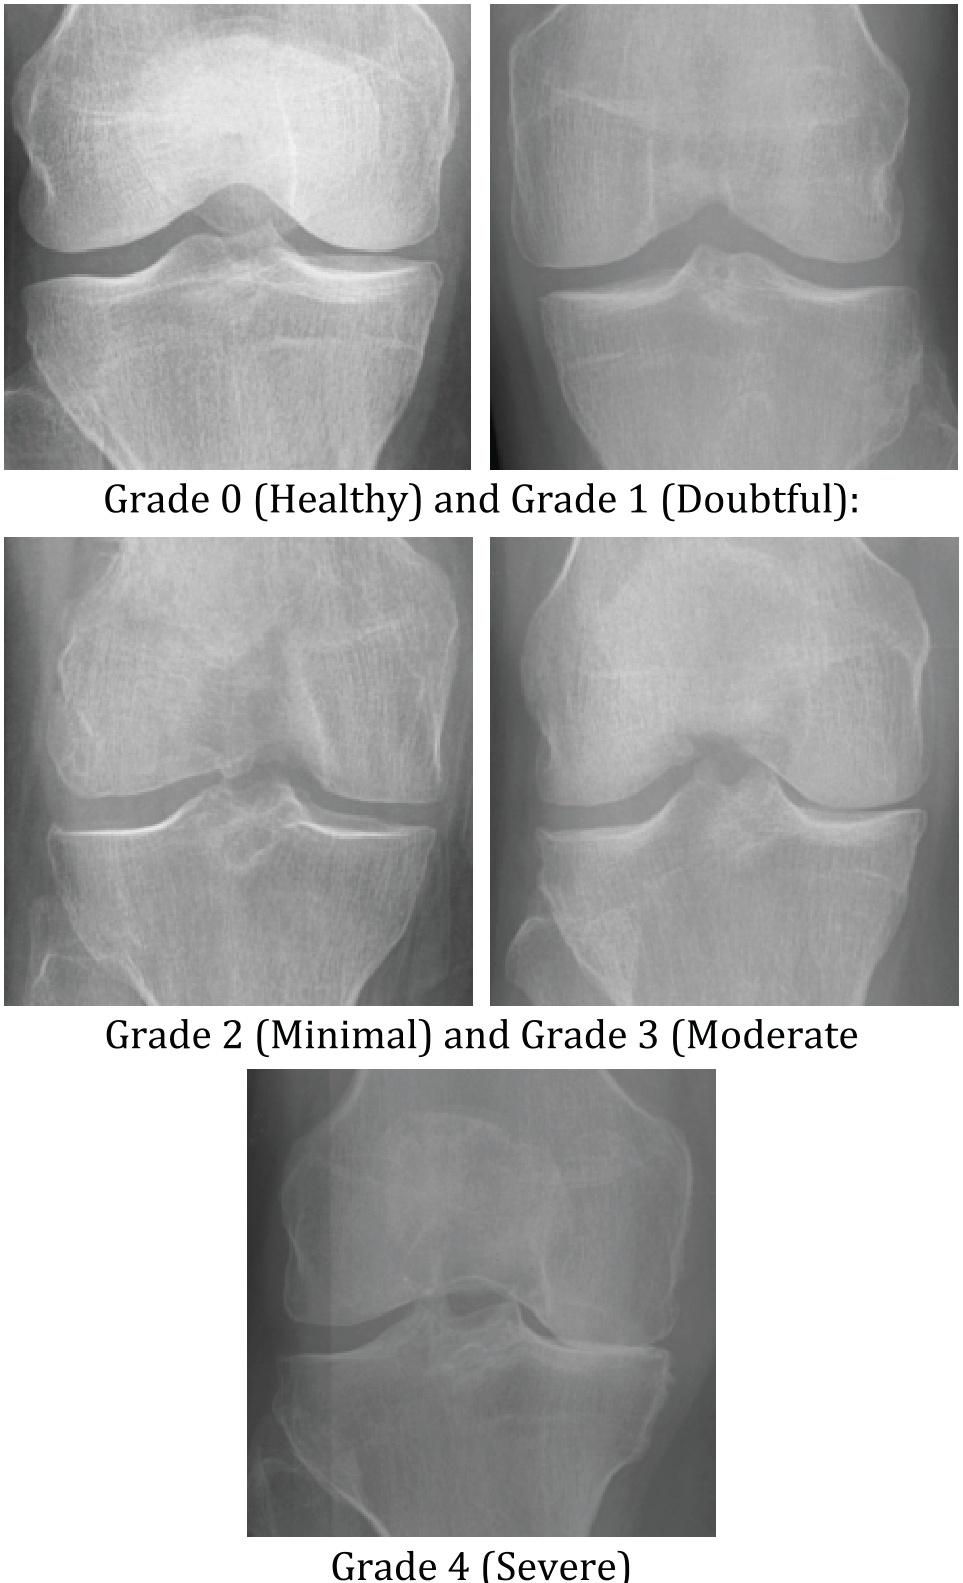
Figure 3.
Sample images of each class of knee OA severity
Table 1.
Comparative analysis of models
| Model | Parameters | Input Size | Conv Layers | Key Features |
|---|---|---|---|---|
| EfficientNet-B5 | ~29.3M | 456×456 | MBConv (39) | Compound scaling, SE blocks, Swish |
| ResNet50 | ~25.6M | 224×224 | 50 | Residual blocks, skip connections |
| VGG16 | ~138M | 224×224 | 13 | Deep stack, large fully connected head |
| MobileNetV2 | ~3.4M | 224×224 | ~53 | Lightweight, depthwise separable conv |
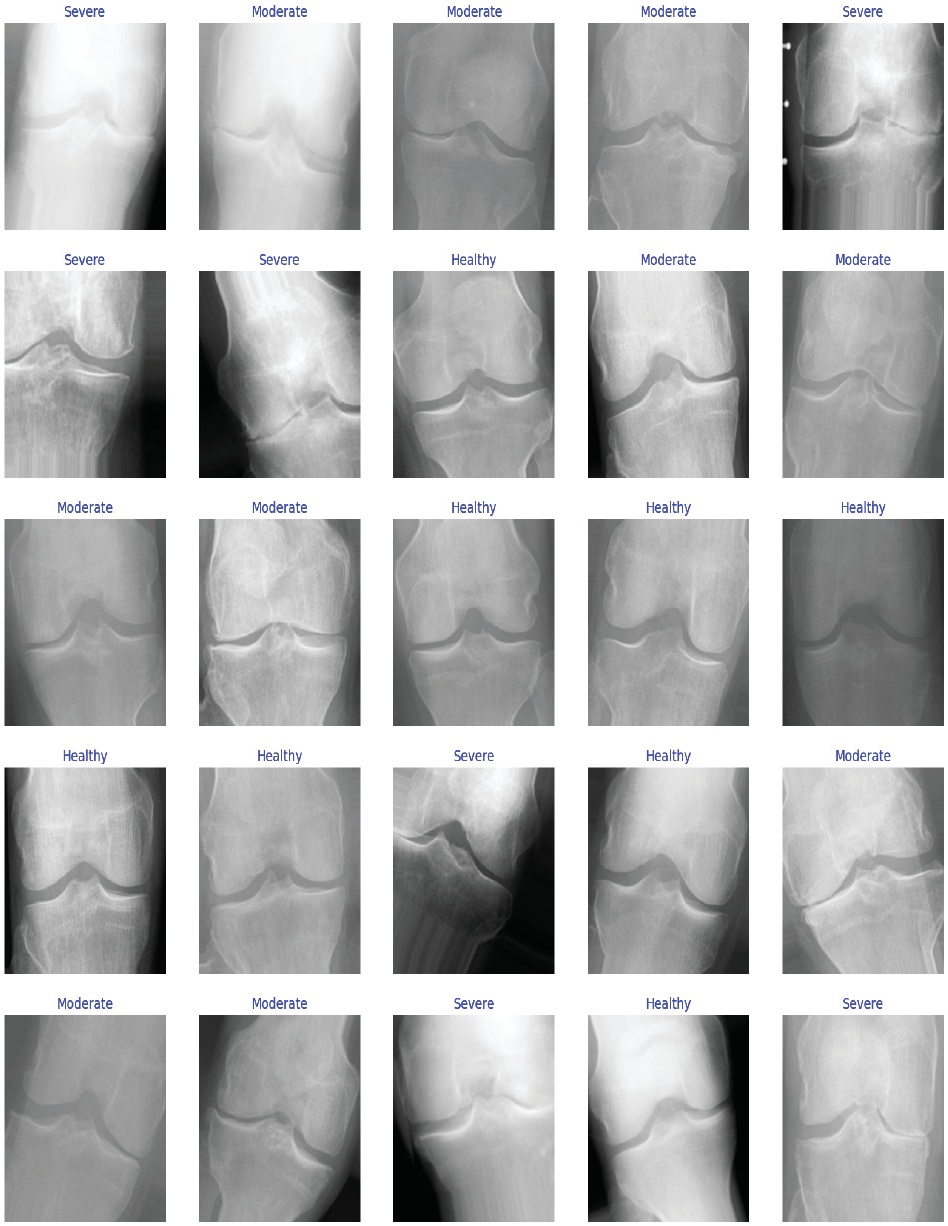
Figure 4.
Sample Images
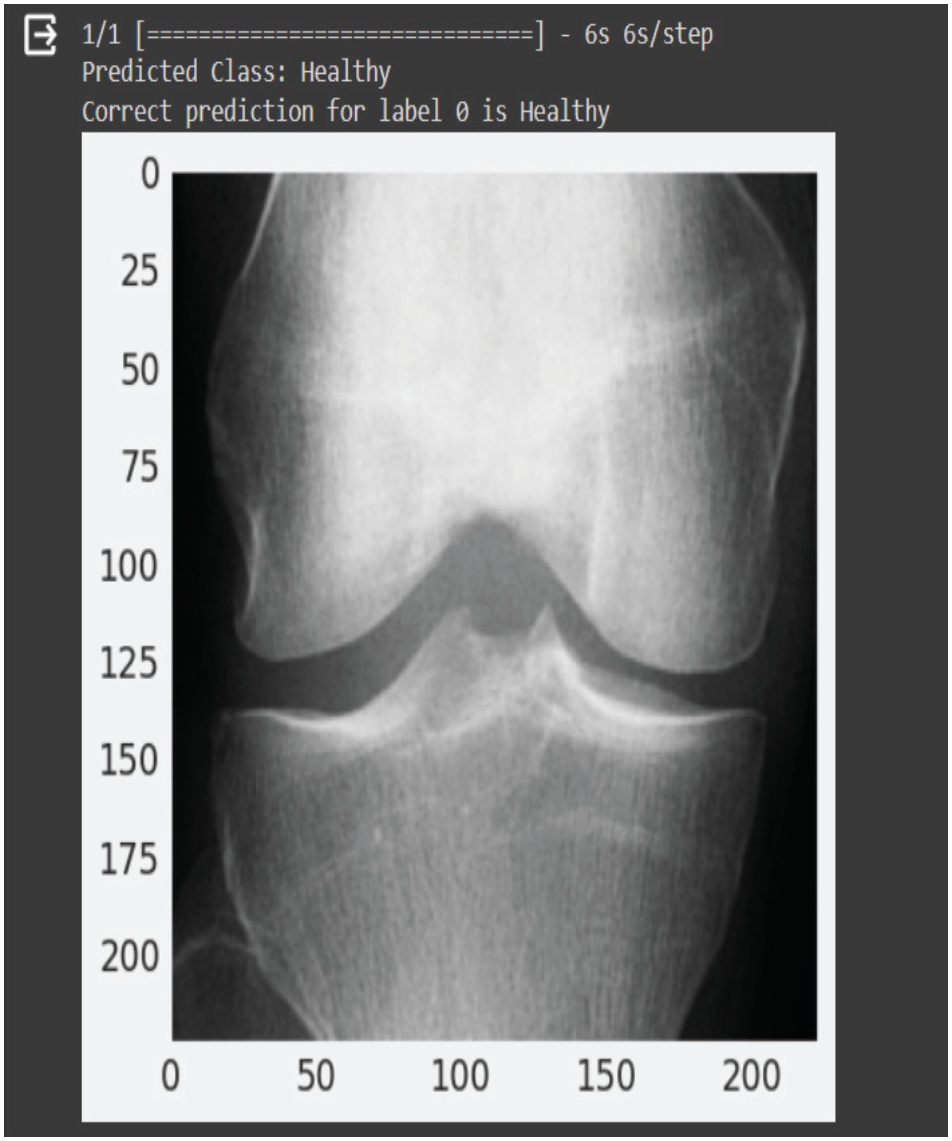
Figure 5.
Predicted Image
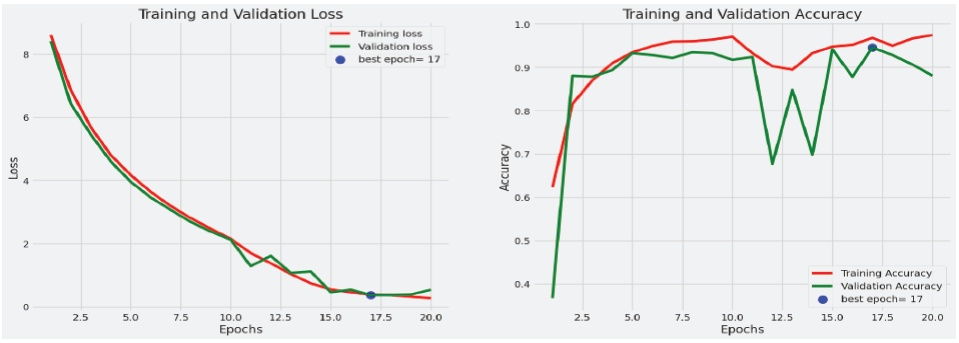
Figure 6.
Output Graph
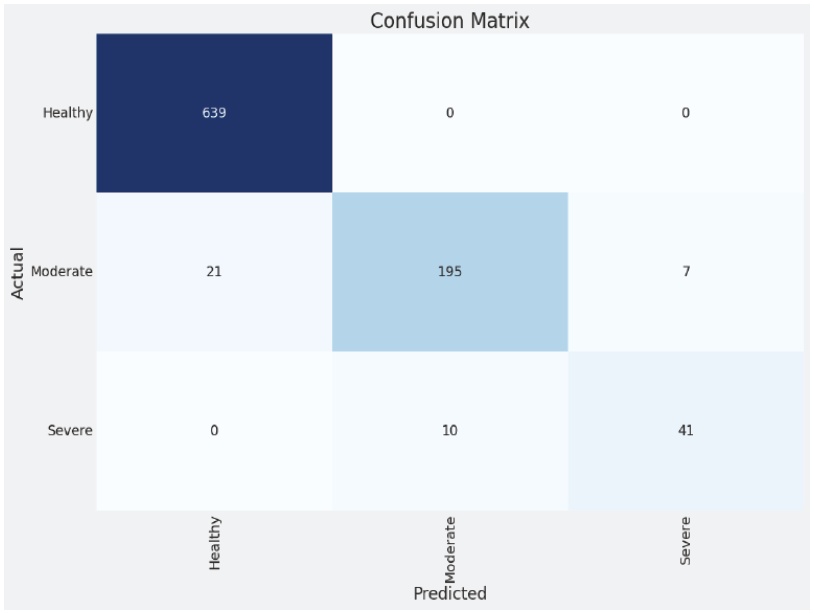
Figure 7.
Confusion Matrix Efficient Net B5
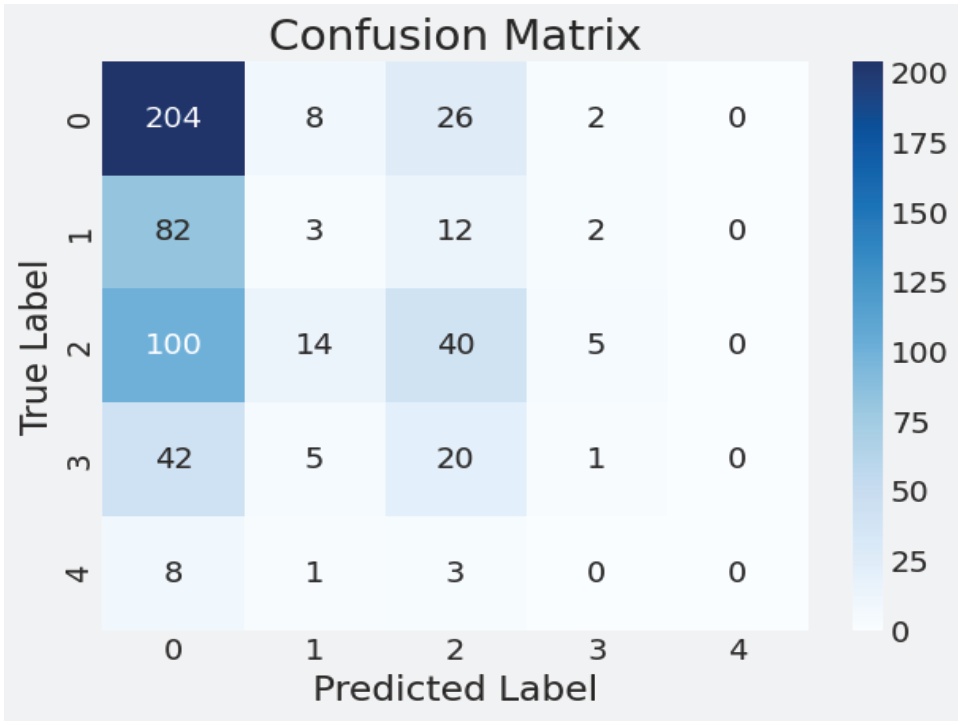
Figure 8.
Confusion Matrix KNN
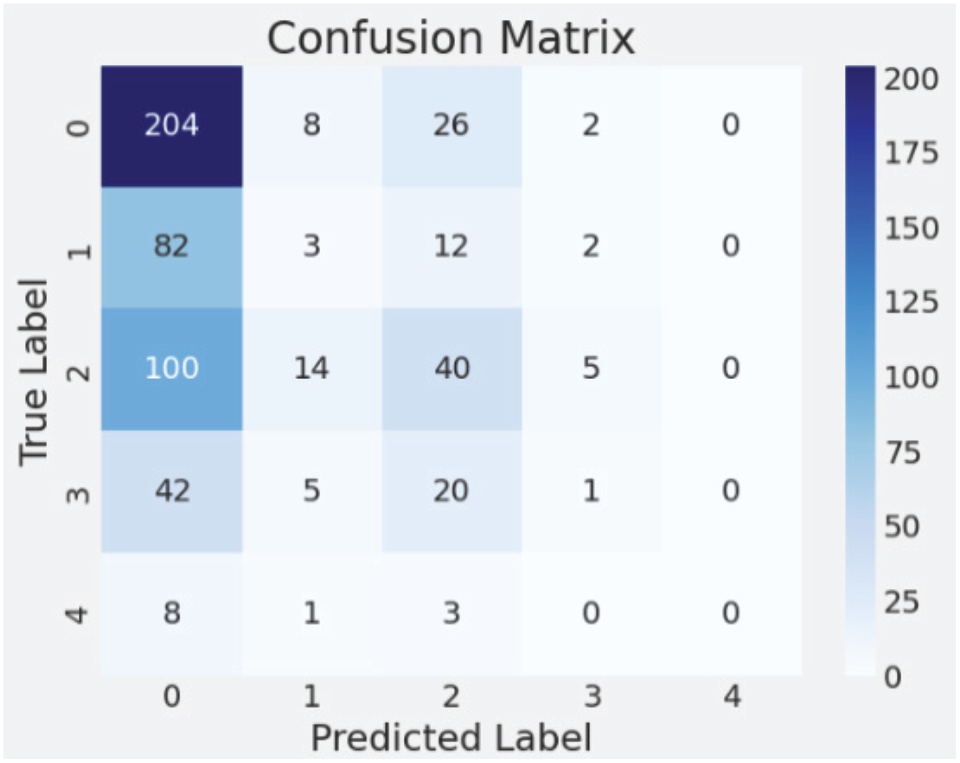
Figure 9.
Confusion Matrix Random Forest