

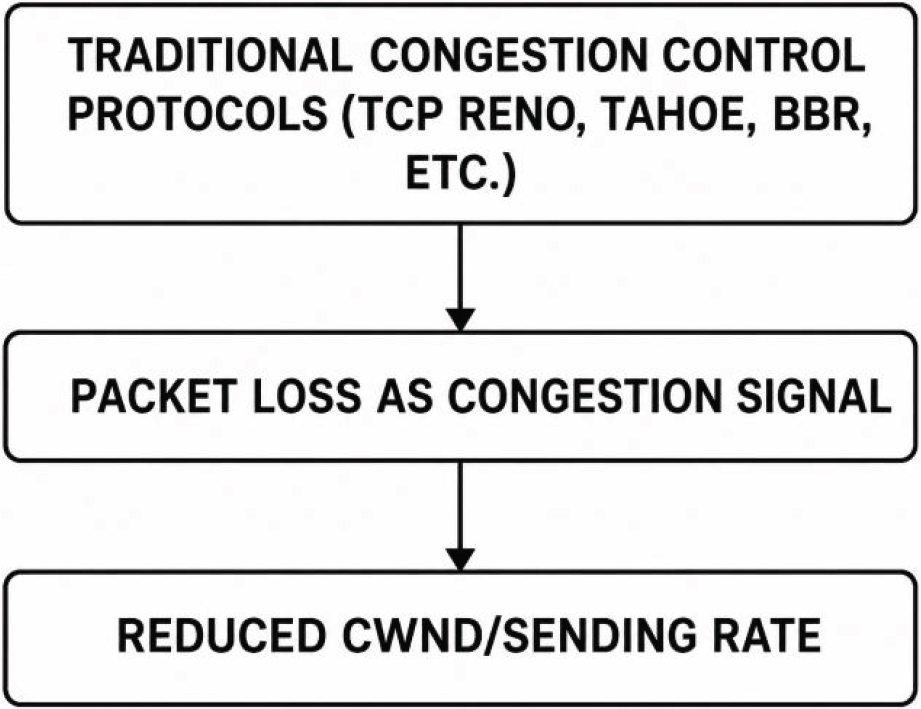
Figure 1.
Traditional approach to congestion control
Table 1.
Comparison between ML-based methods
| Metric | AHMA(Proposed) | PPO | DQN |
|---|---|---|---|
| Loss cause accuracy | High (Bayesian Transformer Classifier) | Not cause-aware | Not cause-aware |
| Decision accuracy | Highest (Cause-Aware) | Medium | Lower |
| Adaptation speed | Fast (RL + Classifier Feedback) | Medium | Slower |
| Packet loss (%) | Lowest | Higher | Higher |
| Throughput (Mbps) | Highest | Medium | Lower |
| Latency (ms) | Lowest | Medium | Higher |
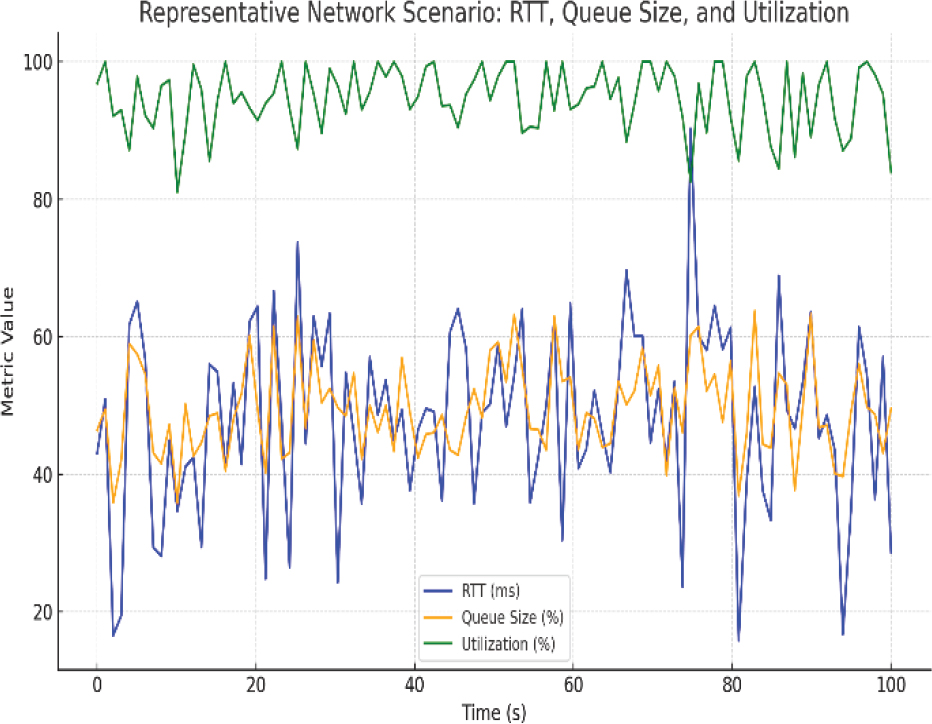
Figure 2.
Reprentation of network parameters
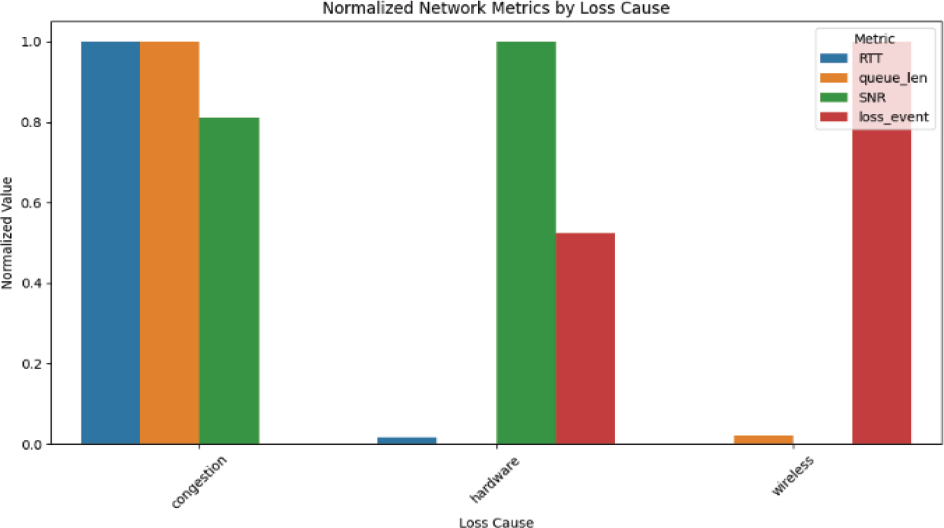
Figure 3.
Representation of Network Parameters
Table 2.
Outcome comparison
| Algorithm | Decision Accuracy (%) | Packet Loss (%) | Throughput (Mbps) | Avg Latency (ms) |
|---|---|---|---|---|
| AHMA | 92 | 2.5 | 8.6 | 10 |
| PPO | 78 | 4.8 | 7.2 | 18 |
| DQN | 70 | 6.1 | 6.5 | 25 |
| TCP Cubic | N/A | 8.3 | 5.9 | 30 |
| TCP Reno | N/A | 10.5 | 5.2 | 35 |
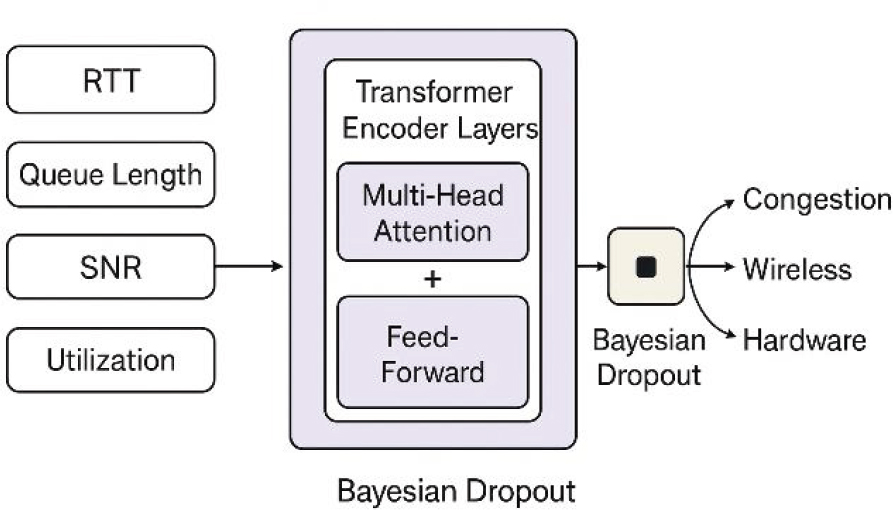
Figure 4.
Overview of Bayesian Transformer
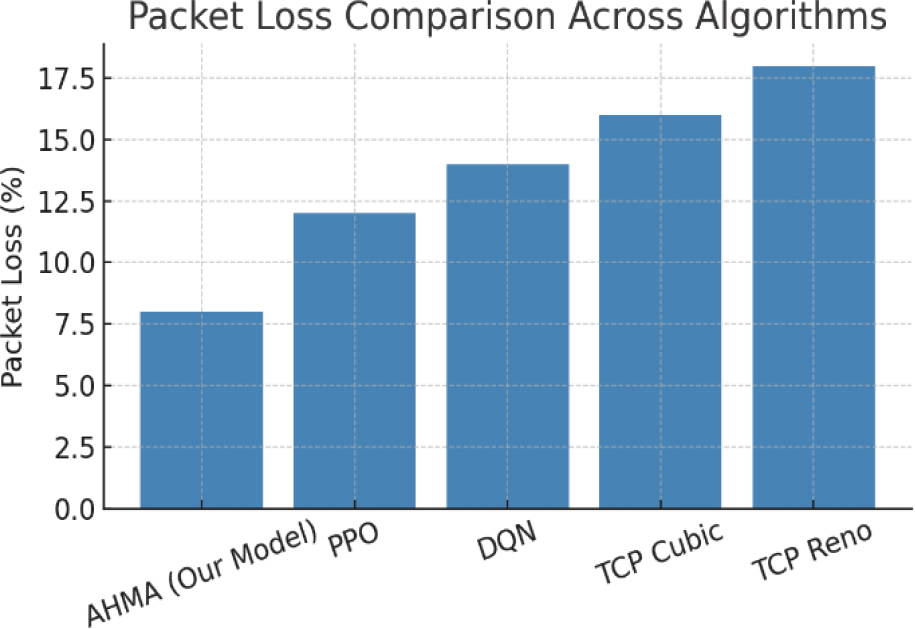
Figure 5.
Packet loss comparison
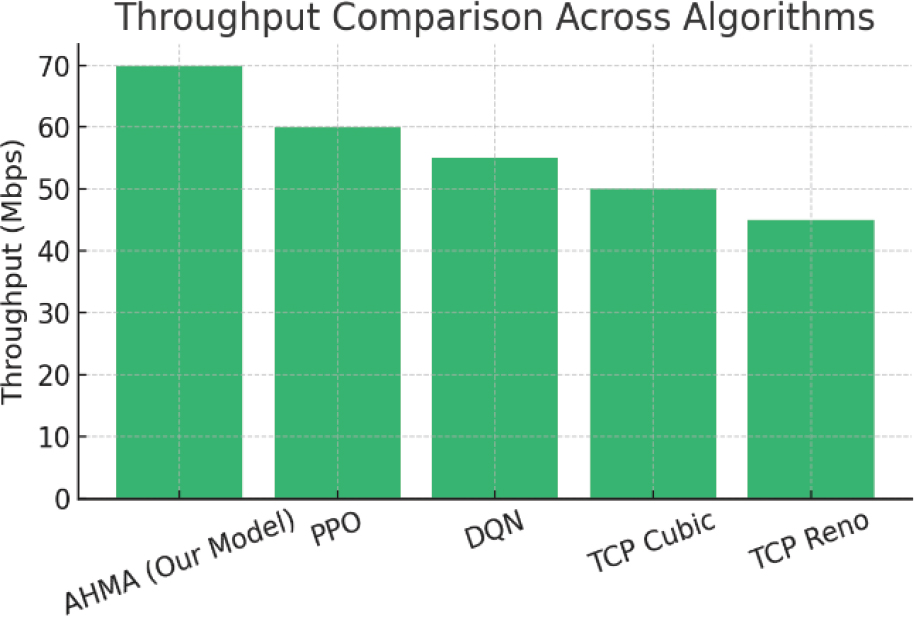
Figure 6.
Throughput comparison
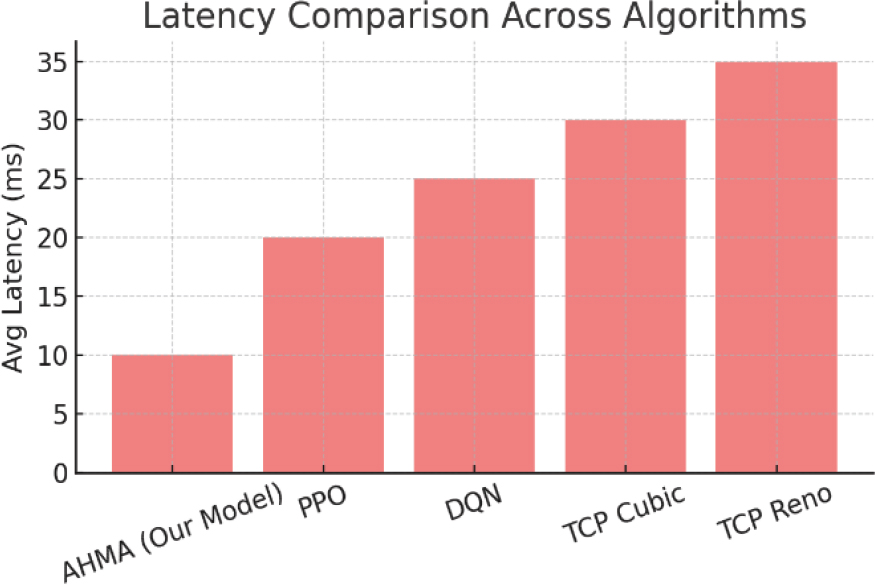
Figure 7.
Delay comparison