

1. Introduction
Glaucoma has become one of the leading causes of visual disability worldwide. According to recent statistics, approximately 85.9 million people were expected to be affected by glaucoma in 2023 [1]. This progressive eye disease results in irreversible vision loss due to damage to the optic nerve, which is responsible for transmitting visual information from the eye to the brain. Among the constraints that face the management of glaucoma, it is highly asymptomatic at its initial stages, and thus, detecting the disease is quite challenging. The optic nerve head (ONH), also known as the optic disc, undergoes structural changes as the optic nerve begins to degenerate. This is a structure with two parts: the neuroretinal rim, which is at the periphery, and the optic cup, which is at the center.
These structural components are compromised as glaucoma progresses, resulting in thinning of the neuroretinal rim and enlargement of the optic cup. Thus, the precise identification of changes in the optic disc and optic cup and constant monitoring are the key to detecting glaucoma earlier and its course. Nonetheless, optic cup automatic detection is more difficult than optic disc automatic detection, primarily because it is less defined in boundaries and may have a different appearance in different retinal fundus images [2].
Historically, the diagnosis of glaucoma has been conducted with the help of multiple clinical tools and metrics like Dynamic Contour tonometry (DCT), airpuff non-contact tonometry, and other tonometry-related procedures of intraocular pressure measurement [3]. Nonetheless, the traditional diagnostic measures have several shortcomings, which include low accuracy, the time-consuming nature of the examination process, and a high level of manual intervention on the part of clinicians.
To overcome these issues, there has been an increase in the use of computerized methods for diagnosing glaucoma. These systems will facilitate the aims of minimizing the challenges encountered by clinicians when carrying out a holistic assessment of glaucoma through more efficient, objective, and automated diagnostic assistance. The described transition is an indication of the growing need for quicker and more dependable diagnostic tools in clinical practice [4].
Some automated tools have been created in recent years to enable glaucoma diagnosis. The techniques primarily use retinal fundus images to examine structural alterations associated with the disease. The use of these methods is intended to improve efficiency in the diagnostic process, enhance detection accuracy, and save time on time-consuming manual procedures [5]. The introduction of the automated glaucoma detection systems is a crucial improvement in the ophthalmic diagnostics since it enhances the efficiency of detecting this sight-threatening disease, and its reliability and accuracy [6].
Computer-Aided Diagnosis (CAD) can be a valuable resource for large-scale disease exploration and screening across diverse populations. CAD systems are more efficient, consistent, and scalable than traditional clinical examinations conducted by medical professionals in detecting a disease. Such technologies, when integrated, can improve, streamline, and facilitate the existing healthcare systems. This comes in handy, especially in the resource-constrained and developing world, where skilled and experienced optometrists or ophthalmologists may be in short supply [7]·
Computer-aided diagnosis (CAD) systems have been extensive in ophthalmology, where they have been used to analyze and segment optic nerves in retinal fundus images to identify the early signs of glaucoma [8]. The studies of the available literature have proven that image processing methods are effective in assessing the structural changes of the optic disc and optic cup, which are some of the major indicators of glaucomatous damage. Glaucoma is a chronic and progressive eye disease and is among the leading causes of blindness in the world, and the United States is not an exception. Despite the number of automated diagnostic methods already developed, the existing methods also contain a few drawbacks, which include unreliable segmentation accuracy and sensitivity to image quality changes. These issues demonstrate the necessity of creating stronger and more efficient models to address the drawbacks of the existing methods and enhance the quality of the glaucoma detection systems [9].
Retinal image databases have been widely used in the initial years of glaucoma research to analyze and develop models. Medical practitioners have traditionally done eye examination by hand when examining images of the retinal fundus to detect glaucomatous abnormalities. In the process, clinicians determine structural characteristics of the Cup-to-Disc Ratio (CDR), as well as changes in the diameter and limits of the optic disc and optic cup. Nevertheless, one of the biggest problems is related to the inadequate number of qualified specialists, which may cause certain delays in terms of the timely identification of ocular abnormalities.
Diagnosis and treatment of glaucoma at early stages are of high importance because early treatment is expected to prevent the progression of the disease and minimize the chances of total blindness [10]. Consequently, this brings about the urgent need to come up with more efficient and reliable automated models that can help overcome such shortcomings and help in the early diagnosis of glaucoma and in the end lead to better patient outcomes.
The models of deep learning, specifically the Convolutional Neural Networks (CNNs), have demonstrated excellent performance in a variety of applications in computer vision, including image classification, object detection, and image segmentation. Deep learning methods have greatly improved medical image analysis, as they now enable more successful and efficient disease detection and diagnosis [11].
Nevertheless, medical imaging data are usually associated with such issues as the imbalance in classes and the scarcity of expert-labeled data. To overcome these challenges, several methods have been proposed to expand training datasets by generating synthetic medical images. These techniques increase the efficiency and strength of computer-aided diagnosis (CAD) systems by increasing the size and variety of the training data. Synthetic images are significant in medical imaging because they improve the performance of classification and segmentation tasks by supplementing datasets and enabling models to learn more representative features. The method is especially useful in cases of small or unbalanced datasets, which eventually results in the creation of more precise and valid deep learning models used in medical image analysis [12].
Generative Adversarial Networks (GANs) represent a type of unsupervised machine learning model that has proven very successful with both synthetic image generation as well as image-to-image translation in the real-world image space. The common GAN architecture is a two-player zero-sum game, and it involves two neural networks, one called the generator and one called the discriminator, which are both trained simultaneously [13].
Here, the generator is trained to generate candidate images that are distributed according to the target data through a latent variable. In the meantime, the discriminator tries to distinguish generated images from real samples using the actual data distribution. In this adversarial training, the generator gets better at making realistic-looking synthetic images, whereas the discriminator is getting better at detecting generated samples [14].
Various versions of Generative Adversarial Network (GAN) models have been built, such as WGAN, InfoGAN, DCGAN, CGAN, Pix2Pix, and CycleGAN, among others [15]. These models have shown great potential in solving image-to-image translation problems and synthetic image generation problems. Consequently, GANs keep evolving and become more flexible in computational intelligence and image processing. These various architectures have been created due to the continued improvements in the field of generative modeling, which allows more efficient solutions to complex image analysis tasks.
The novelty of the proposed work lies in the integration of multiple advanced techniques to improve the accuracy and reliability of automated glaucoma detection. The proposed framework, unlike the current approaches that only use the traditional deep learning frameworks, also involves Generative Adversarial Networks (GANs) to address the issue of class imbalance by creating synthetic retinal images. Moreover, Precise optic cup segmentation is achieved using an Enhanced Level Set Algorithm, which improves the extraction of important structural characteristics of fundus images. Lastly, classification is performed using a pretrained MobileNetV2 model, enabling efficient feature extraction and high detection rates. The proposed framework has better segmentation accuracy, better dataset balancing, and better classification performance when compared to the current methods, including CNN-based, graph-based, and ensemble models, with an overall accuracy of 98.9% on the ORIGA dataset.
2. Literature Survey
Several studies examined the automated method of detecting glaucoma in machine learning, computer vision, and deep learning. The techniques are mainly aimed at analyzing retinal fundus images to detect the structural changes in the optic disc and optic cup areas, which are major indicators of the glaucomatous damage.
The extraction of multi-scale features of the retinal images is a recent technique called M-LAP that has been suggested to enhance the precision of glaucoma identification. It is an effective technique to bridge the gap between global semantic analysis and the localization of glaucomatous regions, thereby more accurately identifying patterns associated with the disease [16]. Also, it identifies abnormal areas in fundus images, thereby making glaucoma analysis more interpretable and clinically significant [17]. Experimental results have shown promising performance, particularly in terms of Area Under the Curve (AUC). Similarly, the EAMNet framework demonstrates high sensitivity, which contributes to improved diagnostic accuracy. However, these methods still face certain limitations, including challenges in accurately detecting the optic cup region. Additionally, the use of Global Average Pooling (GAP) may restrict the representation of high-resolution feature maps, thereby affecting fine-grained feature extraction [18].
In another study, glaucoma detection was performed by analyzing blood flow patterns in retinal arterial and venous networks. In this method, Support Vector Machines (SVMs) were used to classify vascular features extracted from fundus images [19]. The approach achieved high accuracy and sensitivity in identifying glaucomatous changes. Nevertheless, the model requires a large amount of data for effective training and analysis, thereby increasing computational complexity and limiting its practical applicability.
Optimization-based techniques have also been investigated for glaucoma detection. For instance, a Group Search Optimization (GSO) model has been developed for automatic detection of the optic cup in retinal fundus images. This approach constructs the solution based on the intensity gradient within the cup region. The GSO algorithm incorporates adaptive neighborhood behavior, which improves search capability and allows accurate detection even in cases with weak cup boundaries or low contrast. Although the method achieves a high F-score and reduced detection errors, it requires careful estimation of the Cup-to-Disc Ratio (CDR). Moreover, when applied to low-resolution images, the model may suffer from insufficient pixel information, which affects the accurate delineation of optic cup boundaries [20].
Recent research has also focused on computer vision-based techniques for automated glaucoma detection using digital fundus images. One such approach utilizes a geometric feature-based model for optic disc segmentation. This method improves system robustness against image noise and illumination variations, thereby enhancing detection accuracy [21]. However, the approach still faces challenges such as class imbalance in the dataset and significant variability in pixel intensity within the optic disc and surrounding blood vessels, which can negatively affect segmentation performance [22].
With the rapid advancement of deep learning techniques, Convolutional Neural Networks (CNNs) have been widely applied to glaucoma detection. An interpretable Computer-Aided Diagnosis (CAD) model was proposed to enable glaucoma detection directly from mobile devices. The framework integrates multiple datasets to construct CNN-based models for both classification and segmentation tasks [23]. The suggested pipeline performs thorough segmentation and characterizes retinal structures associated with glaucoma, resulting in improved glaucoma analysis. Experimental findings prove less computational complexity, high accuracy, and F-score [24]. Nevertheless, this method is also characterized by the shortage of training samples and the coverage of pathological areas of attention maps.
Another important contribution is the Attention-based Convolutional Neural Network (AG-CNN), developed specifically for glaucoma detection using the LAG database and other fundus images [25]. The AG-CNN architecture improves model convergence and robustness while reducing classification errors. Despite these advantages, the model exhibits certain drawbacks, including a decrease in Area Under the Curve (AUC) and the inability of the attention mechanism to fully capture the entire pathological region [26].
Furthermore, deep learning frameworks such as the disc-aware ensemble network have been proposed for glaucoma screening using retinal fundus images. This architecture integrates contextual information from both the global fundus image and the local optic disc region. The network consists of several components, including a global image stream, a segmentation-guided network, a local disc region stream, and a disc polar transformation stream [27]. Although the method achieves high specificity and accuracy in glaucoma detection, it requires significant computational resources and longer processing time due to its complex architecture.
Despite the significant progress achieved by existing approaches, several challenges remain in automated glaucoma detection. These include dataset imbalance, variability in optic disc and optic cup structures, sensitivity to image-quality variations, and limited segmentation accuracy. Therefore, there is a need for a more robust framework that can effectively address these challenges. To overcome these limitations, the present study proposes a GAN-based synthetic image generation approach combined with Enhanced Level Set segmentation and a pretrained MobileNetV2 classification model for accurate and efficient glaucoma detection.
Table 1 provides a comparative summary of existing glaucoma detection approaches reported in the literature. The table highlights the key methodologies, datasets used, main contributions, and limitations of each study From the comparison, it can be observed that many existing methods focus on improving classification accuracy using machine learning and deep learning techniques. However, several challenges remain, including dataset imbalance, sensitivity to image quality variations, and difficulties in accurately segmenting optic disc and optic cup regions. These limitations indicate the need for more robust frameworks that can address these issues effectively. To overcome these challenges, the proposed method integrates GAN-based data augmentation, an enhanced level set algorithm for accurate segmentation, and a pretrained MobileNetV2 model for reliable glaucoma classification.
Table 1.
Comparative analysis of existing glaucoma detection approaches
| Ref | Method / Model | Dataset | Key Contribution | Limitations |
|---|---|---|---|---|
| [16] | M-LAP Model | Fundus Images | Multi-scale feature extraction for glaucoma detection | Difficulty in accurate optic cup segmentation |
| [19] | SVM-based Classification | Retinal fundus images | Uses retinal blood flow features for glaucoma classification | Requires large datasets for effective training |
| [20] | GSO Algorithm | Fundus Images | Automatic optic cup detection using intensity gradients | Performance affected by low-resolution images |
| [21] | Geometric Feature Model | Digital fundus images | Optic disc segmentation using computer vision methods | Sensitive to illumination and intensity variations |
| [23] | CNN-based CAD Model | Fundus Images | Automated glaucoma detection using deep learning | Limited training samples and incomplete attention mapping |
| [25] | AG-CNN | LAG Dataset | Attention-based CNN improves convergence and robustness | Reduced AUC and incomplete attention coverage |
| [27] | Disc-aware Ensemble Network | Fundus Images | Integrates global and local contextual information | High computational complexity |
3. Methodology
Manual glaucoma diagnosis can be time-consuming and costly, and many existing automated glaucoma detection techniques either do not achieve satisfactory performance or lack comprehensive statistical validation. Therefore, this study proposes an improved Convolutional Neural Network (CNN)- based detection model for glaucoma identification. The detailed architecture and workflow of the proposed model are presented in the following sections, as illustrated in Figure 1.
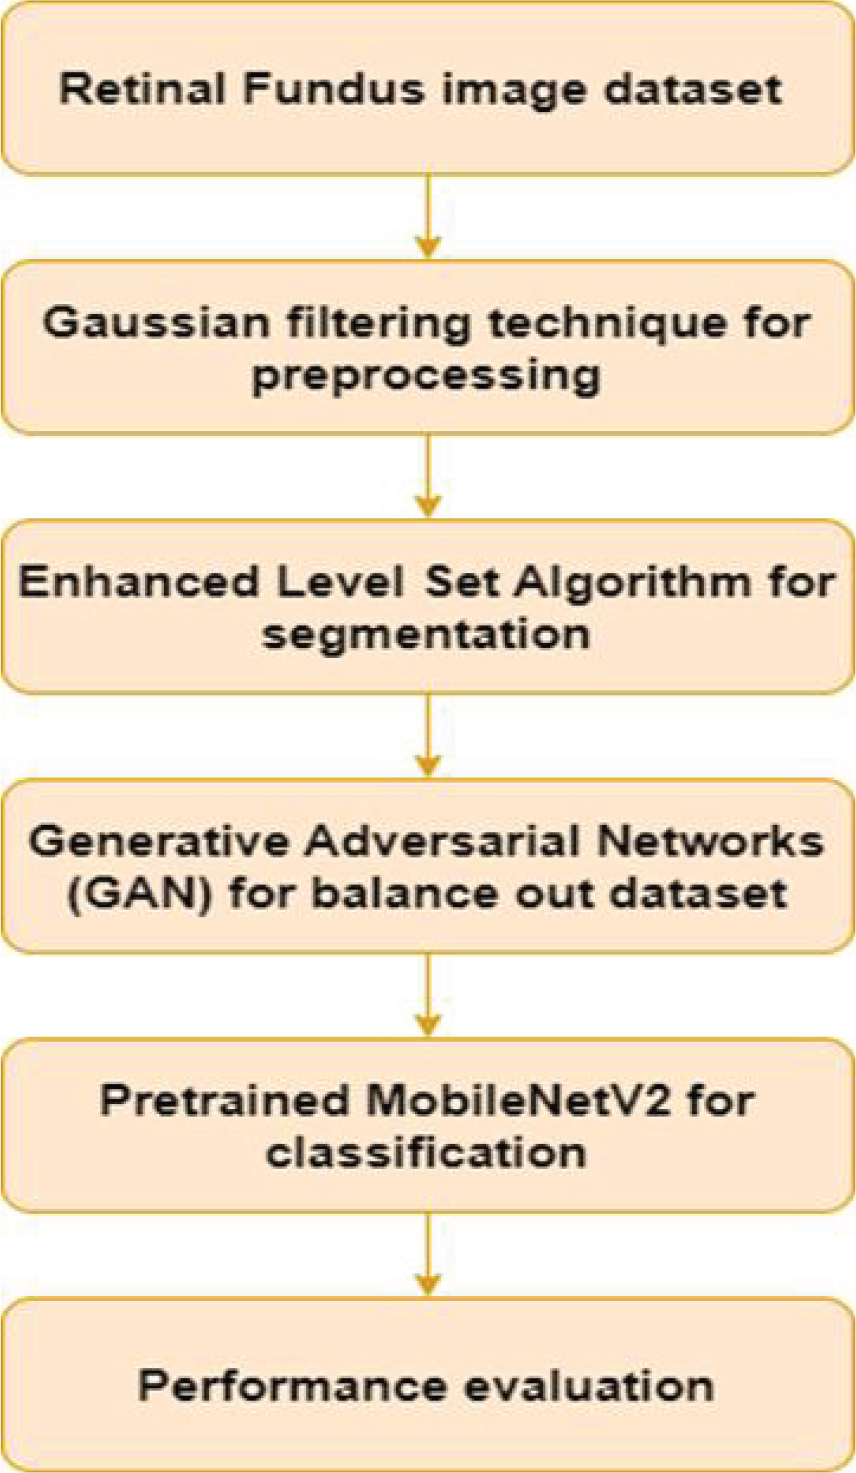
Figure 1.
Workflow of Proposed Work
3.1. Pre-Processing Phase
Following the application of a Gaussian Filter (GF) during the preprocessing step, the quality of the input image is improved by the application of a filtering process. After going through the process of scaling, the original image, which had dimensions of (1154,1600, 3), has been changed to (512, 512, 3).
The Modified Level Set Algorithm is utilized to accomplish the task of optic cup segmentation. Two categories of features are utilized in the process of feature extraction: morphological and non-morphological features. Morphological features, also known as Femf, are derived through the applications of closing and dilation operations. These features include disc region, cup region, and RNFL thickness. The extraction process also includes the extraction of non-morphological aspects, often known as Fenmf, which include color, form, and Modified Local Binary Pattern (LBP) [28].
After this, the features are sent to a Convolutional Neural Network (CNN), which has been optimized. The weights of CNN are subsequently fine-tuned using the simulated annealing and Biogeography-Based Optimization Algorithm (SA-BOA) method. A graphical representation of the entire workflow is given in Figure 1.
Pre-processing of the image under use is the first step and involves Gaussian filtering, a necessary process to enhance image quality. A blurred image can be well refined through the application of Gaussian filtering, which is applied to take away noise and blur that is caused by the reduction of high frequencies in an image. This filtering process is particularly useful when the task is to minimize Gaussian noise in an image where the noise has been introduced by speckle noise or by brain MR images in ultrasound imagery Under this technique, the noise pixel is replaced with the mean of the pixels that are adjacent to the noise pixel, with the help of a Gaussian filter. Using a 5 x 5 window, the Gaussian denoising approach is applied. Following this, the pre-processed image that was produced, which is referred to as ImPr, is segmented in order to conduct additional analysis.
3.2. Generative Adversarial Networks (GAN)
Within the context of game theory, the Generative Adversarial Nets (GAN) function according to the principles of Nash equilibrium. There are two components that make up the model’s fundamental structure: G and D. G’s primary objective is to learn the mapping relationship between the retinal image x and the corresponding optic disc and optic cup. The ultimate objective is to separate the optic disc and optic cup based on the retinal picture that is being input, x, while making certain that the representation D(G(x)) of the segmentation outcome G(x) on D coincides with the representation D(y) of the ground truth y on D. Only then will the goal be accomplished. During this procedure, it is D’s responsibility to learn the differences between y and G(x), as well as to accurately differentiate between the source data of the input optic disc and the label on the optic cup (whether it is the ground truth or G). D directs G to reduce this discrepancy as much as possible, which ultimately results in an improvement in the precision of the partitioned optic disc and optic cup. In the course of model training, it is essential to perform periodic optimization of G and D in order to enhance their capacity for segmentation and discrimination. The objective is to locate the Nash equilibrium between these two variables. The Nash equilibrium is reached when the resultant of D equals half, which indicates that the origin of the optic disc and optic cup label are unable to be reliably differentiated because they are both identical. Since G is now able to precisely separate the optic disc and optic cup, the training is regarded as finished at this time. The ultimate objective of the architecture is to achieve the following objective function, which was given in Equation (1).
3.2.1. Generator Network (GE)
The G is a complete convolutional network framework with 19 layers. Figure 2 shows the structure of its network. The retinal picture x is fed into this model. In this study, we set H = W = 512 and C1 = 3. There is an encoder (on the left) and a decoder (on the right) in the network layout. To get characteristics from the retinal image, the encoder uses the VGG16 network layout. Even though the original VGG16 network has a downsampling ratio of 32, we found that too much downsampling causes important characteristic data to be lost, especially in areas that are smaller than 32 pixels, like the optic disc. To fix this, we got rid of the last two downsampling levels and raised the reduction factor to 16. This cuts down on data loss, model settings, and computations.
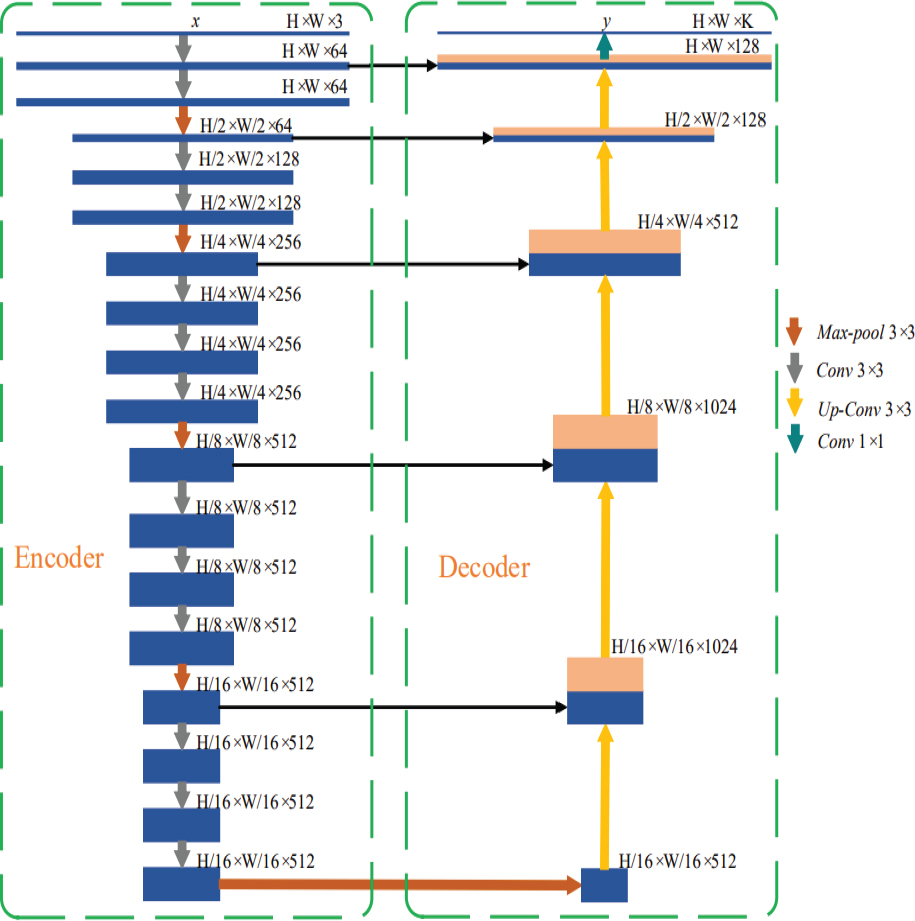
Figure 2.
Structure of generator
The ReLU activation function is used to turn on the output feature map of each convolutional layer. We allow skip links to improve the model’s ability to get back low-level information and get full context information. The feature map input from the layer that pools data within the encoder is sent straight to the decoder through those connections. Using deconvolution techniques for up sampling, the decoder brings back feature knowledge. The output segmentation map with features is then joined with the pooling layer’s characteristic map of the same size in the encoder, based on channel measurement. The decoding layer does four downsampling operations. The encoder then does four upsampling operations to match both the width and height of the feature list with the input image.
The encoder’s last predictor uses a 1x1 convolutional layer with softmax activation to classify pixels one by one and make a probability map. Optical disc, optic cup, and backdrop segmentation give us G(x), which is a K-channel probability map. K is the class number, and in our case, it is 3. The forecasted probability map shows which group has the highest chance of occurring for each pixel. This makes it possible to separate the optic disc and optic cup at the same time. Each time, dropout = 0.8 is given to the last two stages of the encoder to stop over fitting and make the model more general. The same is done for every single component of the decoder.
3.2.2. Discriminator Network (DN)
Figure 3 shows that the discriminator is built with an 8-layer network model. Input data for D is made up of the retinal picture x and the ground truth y, which is written as G(x). The amount of info that D needs is H × W × (C1 + C2). The chance (D(x, y)) of the optic disc and optic cup label for the retinal image x is shown by D. This makes it easier to find the best values for the network structure’s parameters. Each layer uses strided convolution (strided = 2) instead of a pooling layer. After each convolution, the size of the feature map is cut in half, to 1/4 of its original size.
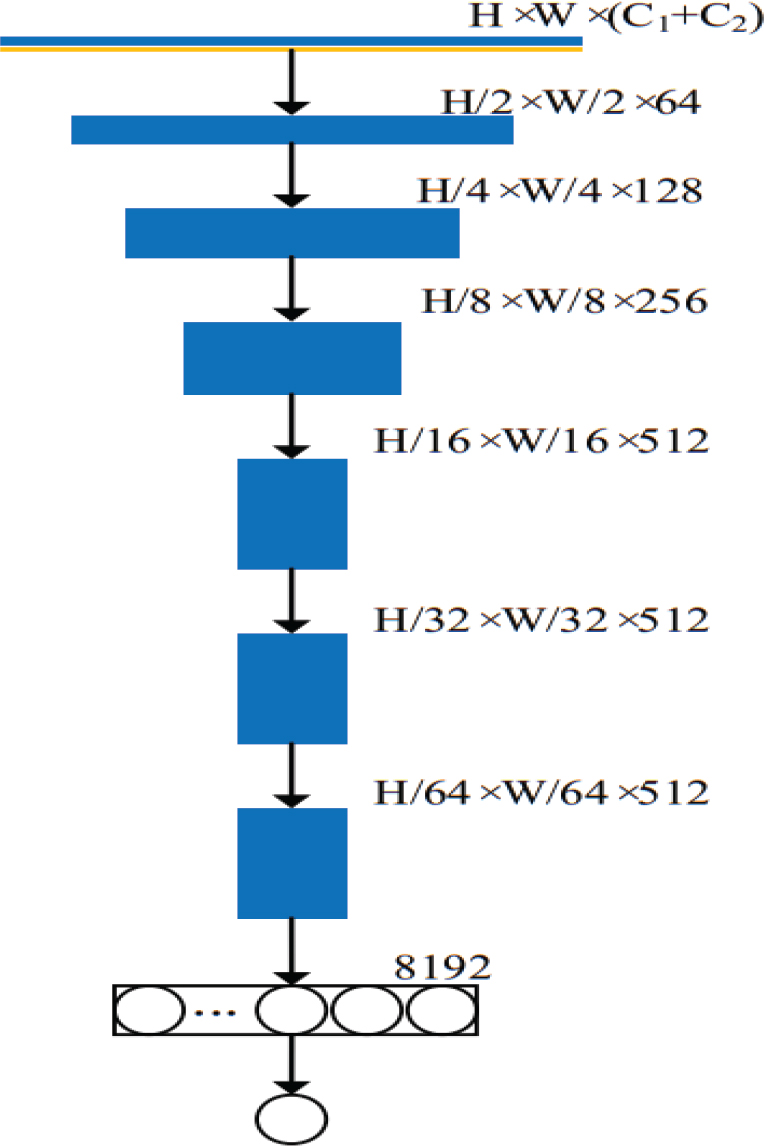
Figure 3.
Structure of discriminator network
Batch normalization is used to make the information of each layer in the convolutional layer more normal (mean s = 0, variance ε = 1). This speeds up convergence and lessens the effect of weight introduction on the network model. In every single layer, the activation function is Leaky-ReLU with α = 0.2. The main image’s resolution drops to H64 × W64 after six downsampling steps. The link is made by the last fully connected layer. D sends either 0 or 1 as the discriminant answer. The gradient descent method is used to change the parameters βg of G and the value of the parameter θd of D based on the difference between the D value and the labeled result. The goal of this method is to get the best model improvement effect.
Algorithm 1
TGA Algorithm
Input: U → Number users
C → Number of servers
Output: AS → List of Allocated server
Start
Define RTF = [SCPUsMems BW]//Assign the RTF
(Resource Threshold Factor) using the basic
parameters of servers like their CPU, RAM and
bandwidth
For each U
TimInt = random//Requests at Time Interval
DemR = max([uCPUuMemuBW]) // User demand
for resources
UtilRate = DemR × TimInt//Resource Utilization
Rate
If max (UtilRate) ≤ max? (RTF)
AvgPTimeSer (i) = DemR(i)/(1-
UtilRate (i) AvgPTime AllSeri (i) = (AvgPTimeSer (i)
× TimInt (i))/TimInt(i))
AS LIST = ceil(cserver × rand)
End - If
End - For
Return: AS LIST as a list of allocated servers
End - Algorithm
3.3. Segmentation of Optic Cup using Enhanced Level Set Algorithm
Historically, many prior techniques have been categorized under edge-based frameworks [29, 30]. These approaches primarily rely on image gradient information to construct edge detection functions for identifying object boundaries. The mathematical formulation of the level set model used in such methods is illustrated in Equation (2).
From Equation (2), div forecasts the curvature of the mean, u denotes the forces with respect to the balloon and ϕ indicates the different levels of set operation.
In level set schemes, the reliability function, denoted by the symbol ϕ, plays a crucial role in ensuring stable evolution and accurate computations during the segmentation process. To address this challenge, a fast level set formulation has been developed to improve computational efficiency and stability. The mathematical representation of this formulation is given in Equation (3).
The penalizing function, which is denoted by the symbol P(φ), places an emphasis on the difference between the sign separation operation and the deviation of φ during its evolution. As shown in Equation (4), the succeeding function η(IG, φ) is responsible for integrating the data pertaining to the image gradient.
The Dirac function is represented by the symbol δ(φ). Parameters such as λ, u, and μ are used to determine the individual contributions of the constraints within the model. In conventional approaches, the parameter u is typically maintained at a constant value. However, in the proposed model, uis designed to vary adaptively, as defined in Equation (5).
In this formulation, Hσ denotes a Gaussian filter with standard deviation σ, while ΔHσ × I represents the Laplacian operator applied to the filtered image. The parameter w denotes the controlling constraint, where w > 0. Furthermore, IG represents the function u(Im), enabling u(Im) to adapt dynamically according to the information present in the image. For region detection, conventional methods generally employ a Gaussian kernel. In contrast, the proposed model replaces this with a bilateral kernel, which helps preserve edge information while performing region-based analysis.
3.4. Accurate Classification of Glaucoma using MobileNetV2 Pretrained Model
Transfer learning is the process of utilizing a model that has already been trained on an extensive data set in order to subsequently adapt to and carry out tasks on various data sets. This method is particularly popular because it successfully classifies small datasets. It does this by addressing the difficulty of getting high precision while training models using deep learning from scratch on limited data. The MobileNetV2 network, which has been pre-trained on the ImageNet dataset, is the basis for this methodology. It acts as the foundation.
Within the framework of the proposed method, we augment the convolutional layers of MobileNetV2 by incorporating a collection of calculations that are referred to as the head model. A feature map with dimensions 7x7x1280 pixels is produced when the base model’s output is fed into the first layer of the topmost model, which is a global pooling layer. A pooling operation is performed by the global pooling layer, producing a one-dimensional feature vector. This is done in order to greatly reduce the dimensionality of the data. In the overall pooling layer, the suggested method makes use of an average pooling technique with a kernel size of 7x7 pixels. This results in the generation of an output feature map that is 1x1x1280 pixels in size [31].
The global pooling layer is followed by two fully connected layers. Within these entirely interconnected layers, the ReLU activation function is responsible for activating 128 and 64 nodes, respectively. When the two subclasses of the dataset (glaucoma and non-glaucoma) and the application of one-hot encoding are taken into consideration, the output layer is made up of two nodes that are activated by softmax technology. Particularly noteworthy is the fact that the 1x1 convolutional layer diverges from the standard by not having a layer for batch normalization and an activation function (ReLU6). This is because its low-dimensional output is only subjected to batch normalization.
3.5. Algorithmic Representation of Proposed Framework
The proposed algorithm 1 describes the complete workflow of the glaucoma detection framework. Initially, retinal fundus images are collected and preprocessed using Gaussian filtering to remove noise and enhance image quality. To address the issue of dataset imbalance, Generative Adversarial Networks (GANs) are employed to generate synthetic retinal images. The augmented image data is then subjected to the Enhanced Level Set Algorithm, which correctly splits the optic cup region based on the fundus images. Lastly, the segmented images are fed into a pre-trained MobileNetV2 model to extract and classify the images into glaucomatous and normal, classifying the images into glaucomatous and normal. This step-wise process enhances the accuracy and reliability of the glaucoma detection procedure.
4. Experimentation and Result Discussion
This section presents the experimental results obtained to evaluate the effectiveness of the proposed glaucoma detection framework. To assess the robustness and classification capability of the model, experiments were conducted using the ORIGA (Online Retinal Fundus Image Database for Glaucoma Analysis) dataset, a widely used benchmark dataset for glaucoma detection studies [32]. The ORIGA dataset contains 650 retinal fundus images, including 168 glaucomatous images and 482 normal images. The experiments were conducted and analyzed in MATLAB to evaluate the performance of the proposed method.
Glaucoma classification using the ORIGA dataset is challenging due to the presence of various artifacts and structural variations. These present a considerable range in the size, color, position, and texture of the optic disc (OD) and optic cup (OC). Moreover, the dataset has several image distortions, including noise, blur, hue, and intensity variation, which makes it a complicated and realistic test set for glaucoma detecting models. In Figure 4, several sample data points in the dataset are presented.
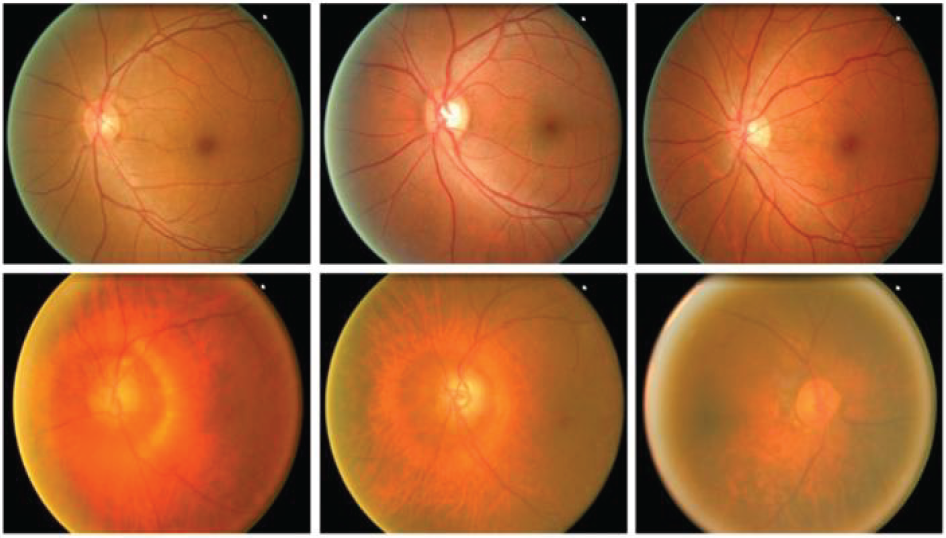
Figure 4.
Sample images from the dataset
To assess the performance of the proposed method on the ORIGA dataset, the dataset was split into training and testing subsets in an 80:20 ratio, respectively.
Figure 5 shows the output of the GAN model when the input images have been fed into the model. After this, it was followed by a segmentation process that was done with the enhanced level set algorithm, which is an effective method of dividing the foreground and background area of glaucomatous fundus images. The findings of this type of segmentation are shown in Figure 6.
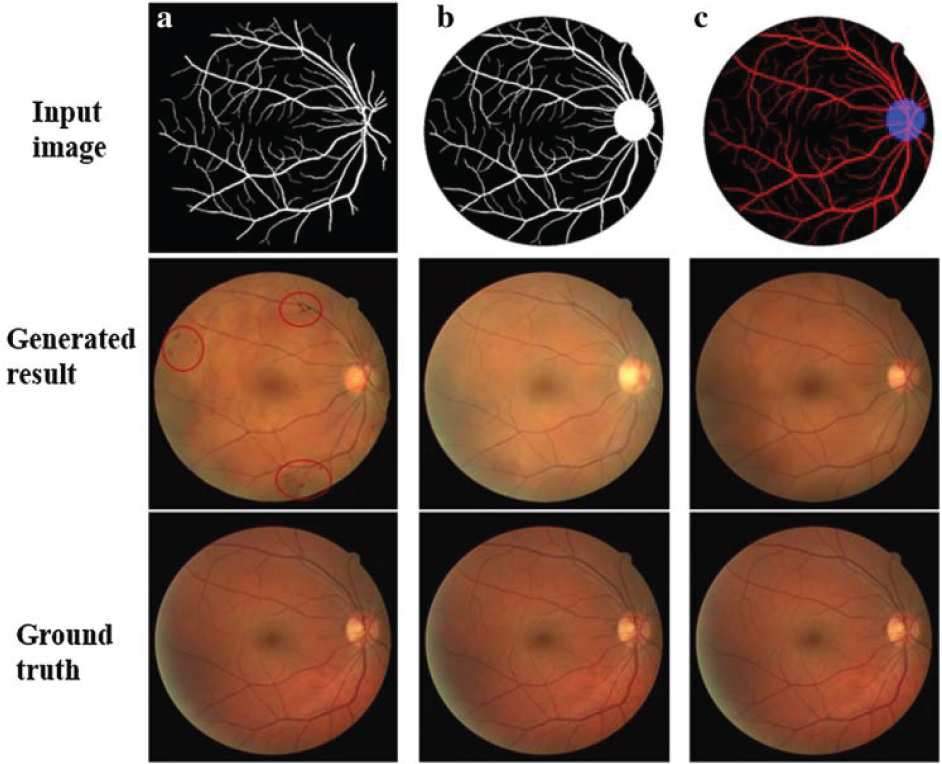
Figure 5.
Synthetic output after GAN applied
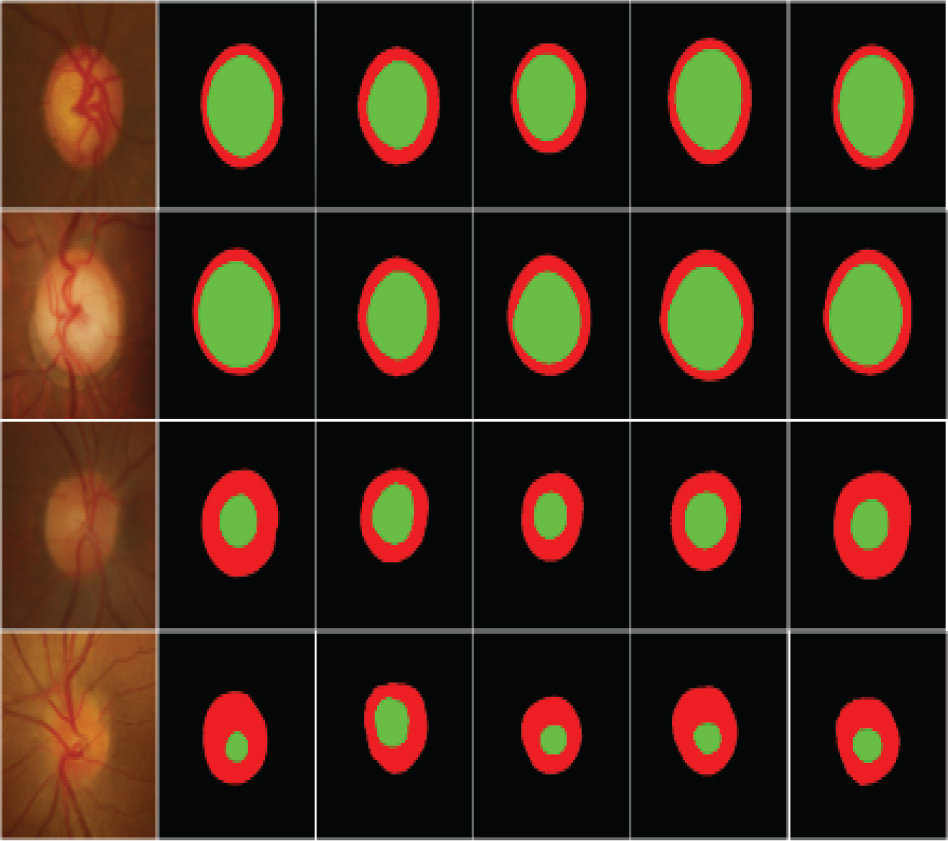
Figure 6.
Segmented output
This study was conducted to demonstrate the effectiveness of the proposed glaucoma diagnosis and classification method through a thorough comparative study with several modern methods, all of which were tested on the same dataset. To achieve this, the work of the proposed method was compared with other contemporary methods to ensure fair and unbiased coverage.
The quantitative data for this comparison are presented in Table 2, which contains performance measures for evaluating the effectiveness and superiority of the various methods. Moreover, the corresponding comparative graphic representations are shown in Figures 7–11 which provide a clearer visualization of the differences in the performance of the investigated approaches.
Table 2.
Performance comparison of the proposed approach over the existing technique
| Methods | Accuracy (%) | Precision (%) | Recall (%) | Specificity (%) | Sensitivity (%) |
|---|---|---|---|---|---|
| Deep CNN [32] | 92.5 | 92.3 | 91.3 | 90.4 | 90.3 |
| Graph CNN [33] | 92.9 | 92.9 | 91.2 | 91.3 | 90.8 |
| Ensembling [34] | 93.1 | 93.2 | 92.3 | 92.3 | 91.1 |
| U-Net+ InceptionV3 [35] | 93.6 | 94.9 | 93.7 | 93.3 | 94.2 |
| ODGNet [31] | 95.2 | 95.1 | 94.6 | 94.5 | 95.3 |
| U-Net+EfficientNet [22] | 96.5 | 95.3 | 95.7 | 95.1 | 96.3 |
| Proposed Model | 98.9 | 98.4 | 96.4 | 97.8 | 97.2 |
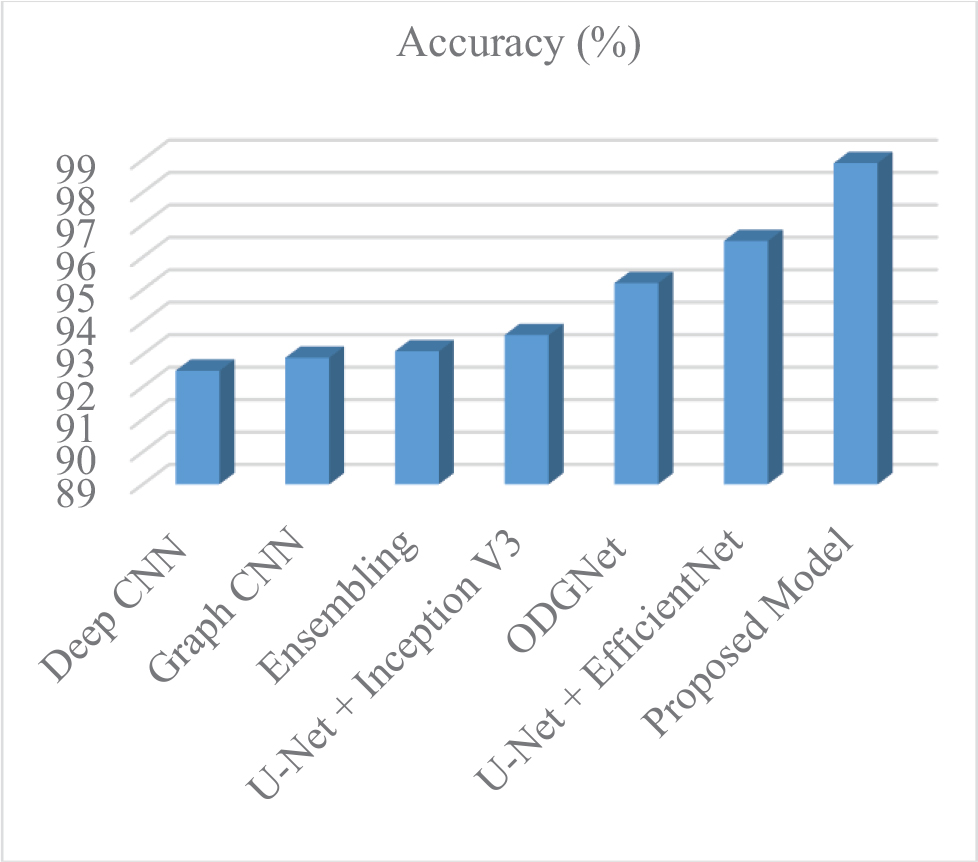
Figure 7.
Accuracy of proposed over existing
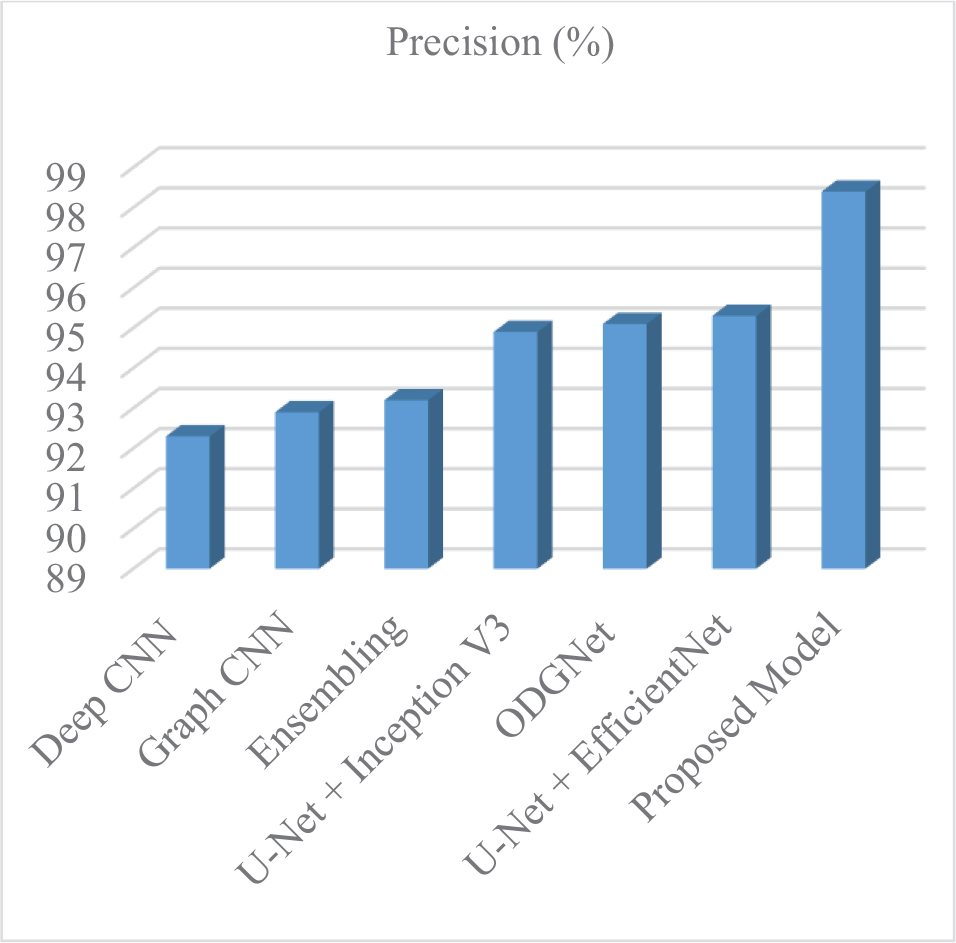
Figure 8.
Precision of proposed over existing
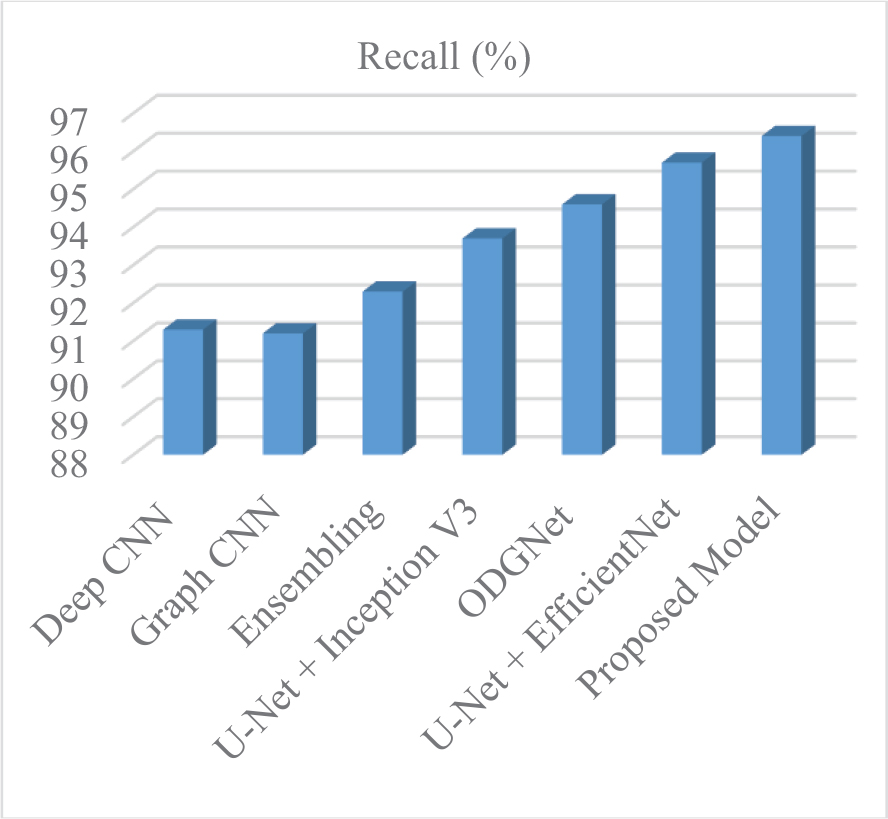
Figure 9.
Recall of proposed over existing
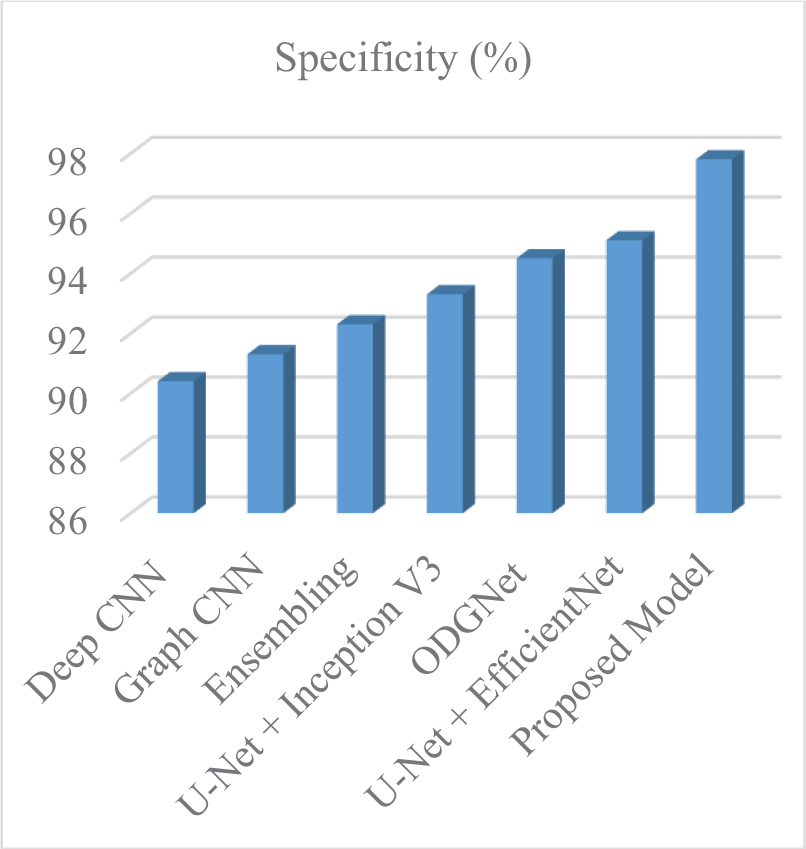
Figure 10.
Specificity of proposed over existing
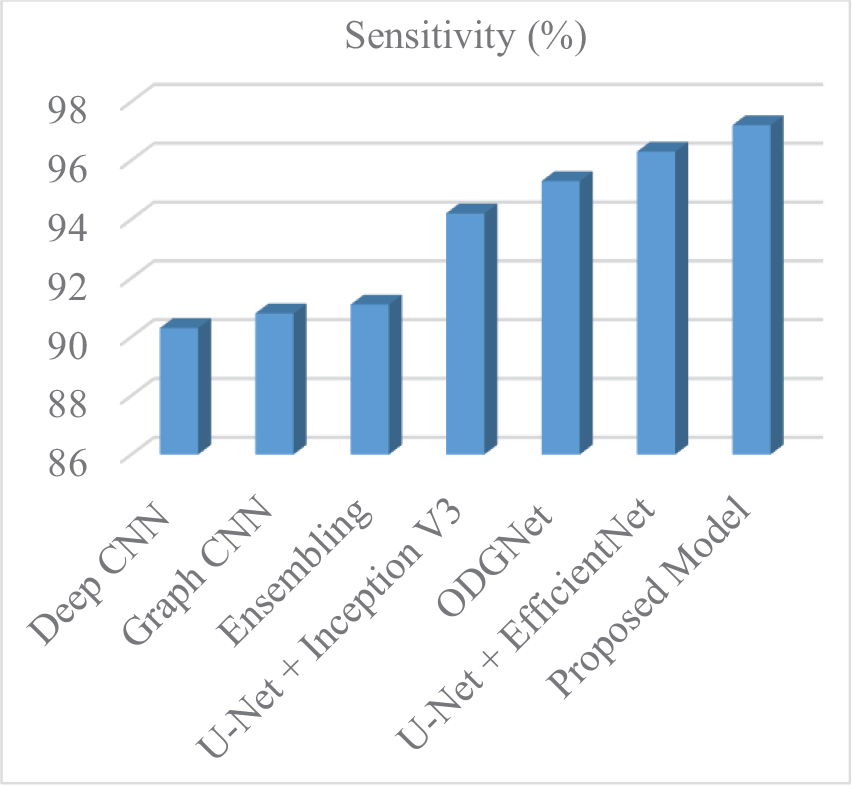
Figure 11.
Sensitivity of proposed over existing
All figures and tables in this study were generated by the authors to illustrate the proposed framework, experimental setup, and obtained results.
5. Conclusion
The results of this research are relevant to the crucial issue of glaucoma being detected early and at the earliest opportunity, as one of the largest causes of permanent blindness on a global scale. The common diagnostic techniques that use routine clinical examination and manual tests are usually poorly accurate and have sluggish processes. To address these shortcomings, this study will introduce a powerful automated glaucoma diagnosis system based on Generative Adversarial Networks (GANs) synthetic image generation, which will overcome the issue of class imbalance that is often found in medical image databases.
The suggested approach involves image-to-image translation methods to obtain synthetic fundus images and vascular structures, the rationale of which is to enhance the quality and the variety of the dataset. The proposed approach can help improve fundus image synthesis for glaucoma analysis by capturing finer structural details and increasing image realism. The raw fundus images are processed at the preprocessing stage, whereby the images are filtered with a Gaussian filter to minimize the noise component and improve the overall image quality. Synthetic data generation using GANs enables the creation of a balanced training dataset that improves the reliability and robustness of subsequent classification. Besides, an Enhanced Level Set Algorithm is used to do proper optic cup segmentation, which is a vital part of glaucoma diagnosis. After segmentation, the MobileNetV2 model with pretrained attributes is used to classify fundus images as normal or glaucomatous.
The results of the experiments demonstrate that the proposed framework outperforms current methods and achieves an accuracy of 98.9%. Such findings underscore the value of the proposed system in automating glaucoma detection, thereby enabling improved diagnostic accuracy and earlier clinical intervention for this vision-threatening disease.
Future Scope
Future work can focus on improving the proposed glaucoma detection framework by incorporating larger, more diverse retinal datasets to enhance the model’s generalization capability. In addition, integrating advanced deep learning architectures such as vision transformers or hybrid CNN-transformer models may further improve feature extraction and classification performance. The proposed framework can also be extended to support multi-class classification for identifying different stages of glaucoma progression [1]. Furthermore, real-time implementation of the system in clinical environments or mobile-based diagnostic platforms could assist ophthalmologists in large-scale glaucoma screening and early diagnosis.