

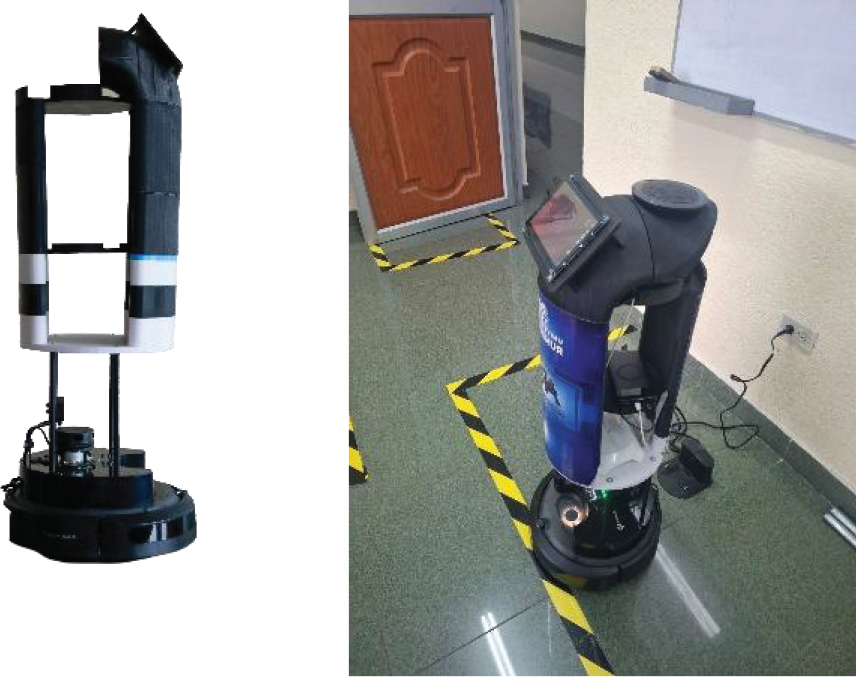
Figure 1.
Structure of ARIS
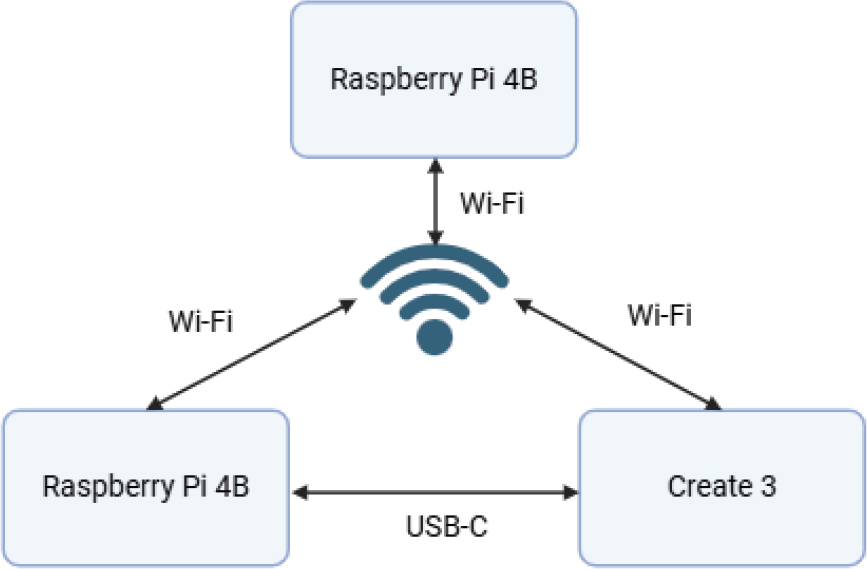
Figure 2.
TurtleBot 4 Simple Discovery configuration for ROS 2 Humble
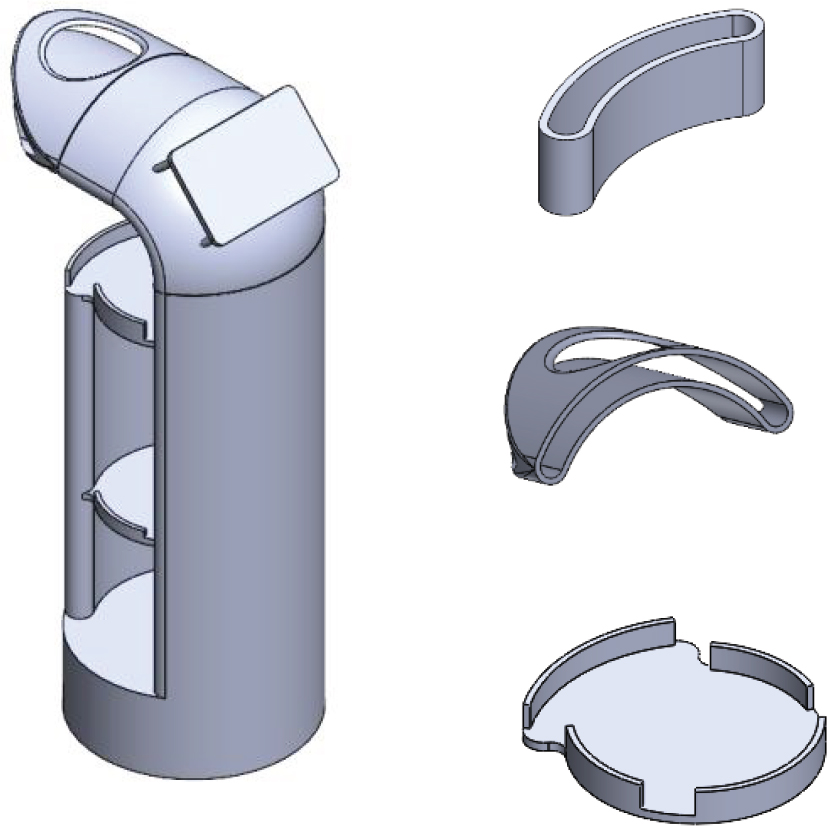
Figure 3.
Design structure of the robot in 3D
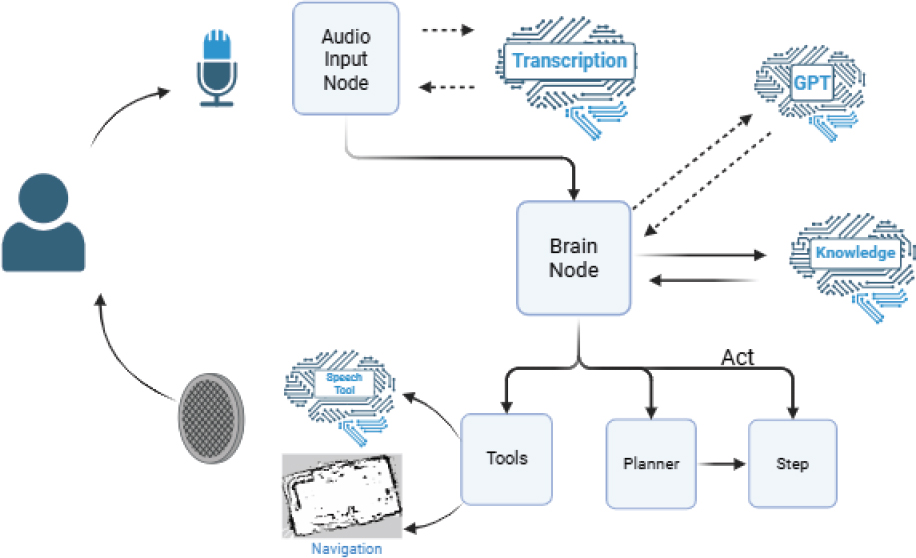
Figure 4.
How ROS Nodes Work
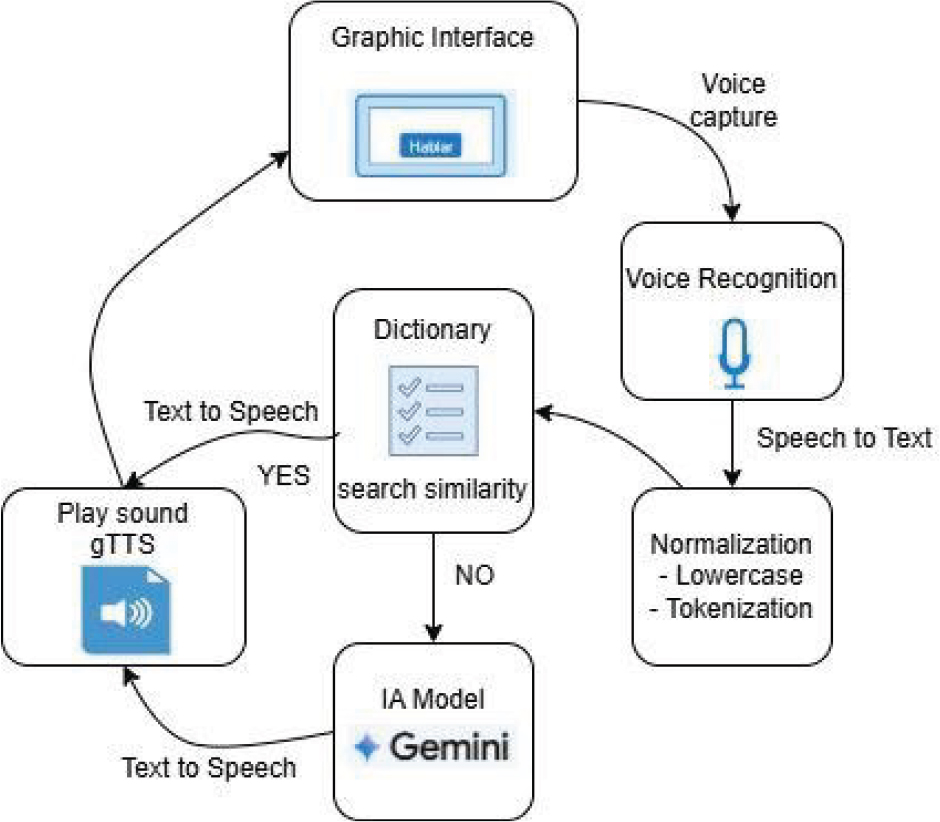
Figure 5.
Block diagram assistant voice
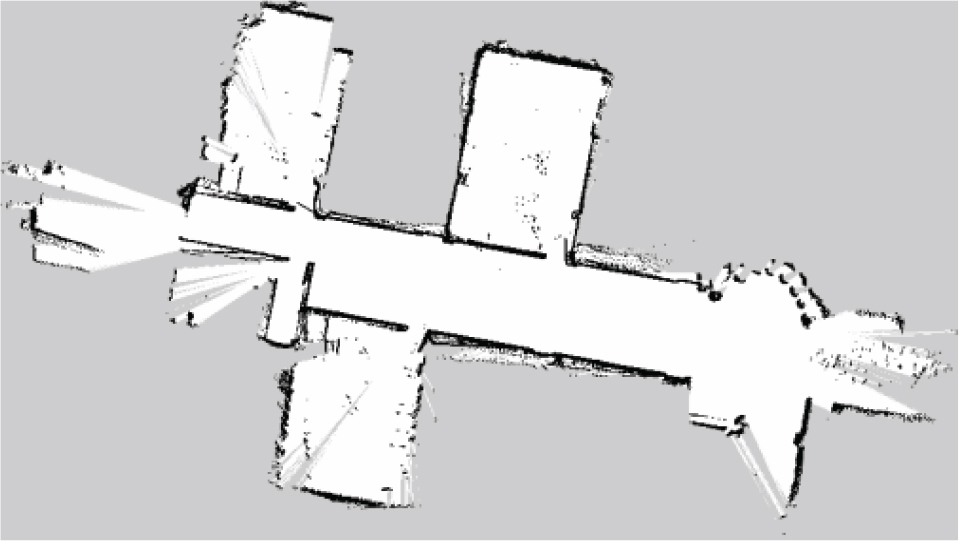
Figure 6.
Local map
Table 1.
Default coordinates of the offices and location of ARIS
| No. | Offices | Coordinate (X) | Coordinate (Y) |
|---|---|---|---|
| 1 | Office 1 | −0.25 | −0.22 |
| 2 | Office 2 | −3.59 | −0.41 |
| 3 | Office 3 | 6.35 | −7.09 |
| 4 | Office 4 | 8.72 | 4.30 |
| 5 | Office 5 | 0.59 | −14.39 |
| 6 | Default place of the ARIS to charge | 0.0 | 0.0 |
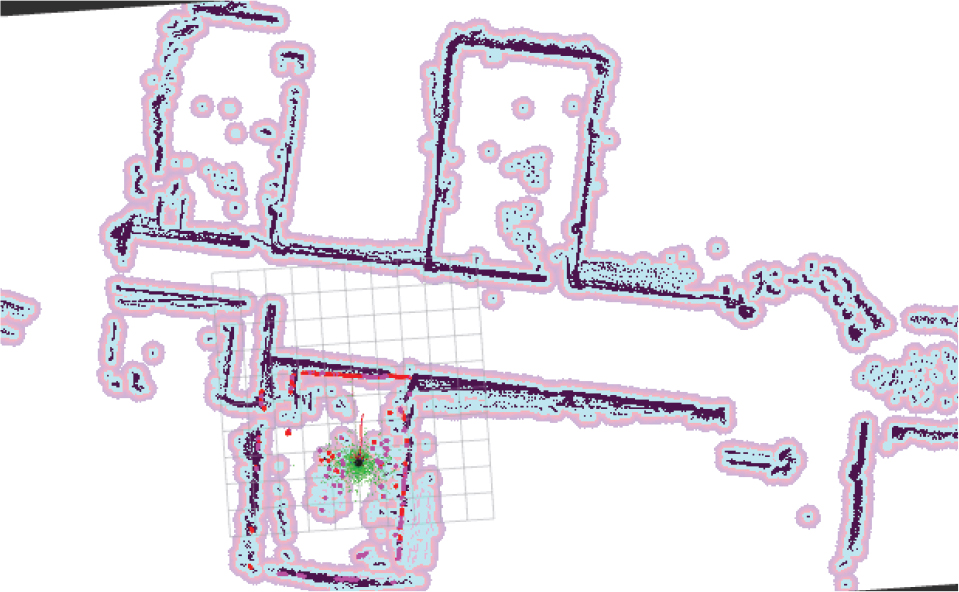
Figure 7.
Aris performance with obstacles
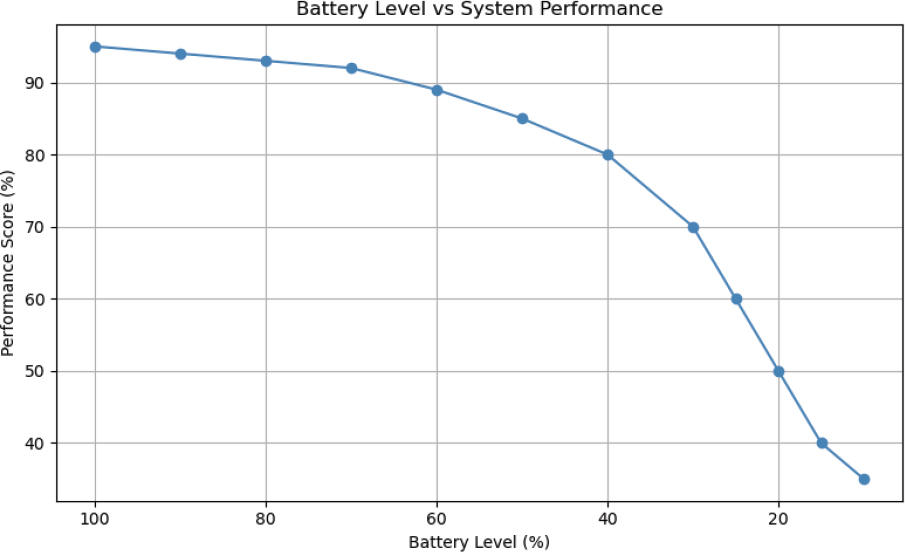
Figure 8.
Battery Level vs System Performance
Table 2.
ARIS Performance of ARIS
| User | Attempts | Questions Answered Correctly | Reached the Correct Coordinates | Avoided Obstacles (Yes/No) | Travel Time (s) | Success Rate |
|---|---|---|---|---|---|---|
| U1 | 2 | Yes | Yes | Yes | 52 | 100% |
| U2 | 2 | Yes | Yes | IF | 60 | 100% |
| U3 | 3 | No | No | No | 78 | 0% |
| U4 | 4 | Yes | Yes | Yes | 49 | 100% |
| U5 | 2 | Yes | Yes | Yes | 55 | 100% |
| U6 | 2 | Yes | Yes | Yes | 63 | 100% |
| U7 | 3 | Yes | Yes | Yes | 50 | 100% |
| U8 | 4 | No | Yes | No | 70 | 33% |
| U9 | 3 | Yes | Yes | Yes | 62 | 100% |
| U10 | 4 | No | Yes | No | 43 | 33% |
Table 3.
Performance of ARIS with inflation radius 0.5 m
| User | Attempts | Questions Answered Correctly | Reached the Correct Coordinates | Avoided Obstacles (Yes/No) | Travel Time (s) | Success Rate |
|---|---|---|---|---|---|---|
| U1 | 2 | Yes | Yes | Yes | 52 | 100% |
| U2 | 2 | Yes | Yes | Yes | 59 | 100% |
| U3 | 3 | No | No | Yes | 63 | 66% |
| U4 | 4 | Yes | Yes | Yes | 49 | 100% |
| U5 | 2 | Yes | Yes | Yes | 55 | 100% |
| U6 | 2 | Yes | Yes | Yes | 61 | 100% |
| U7 | 3 | Yes | Yes | Yes | 50 | 100% |
| U8 | 4 | No | Yes | Yes | 64 | 66% |
| U9 | 3 | Yes | Yes | Yes | 60 | 100% |
| U10 | 4 | No | Yes | Yes | 53 | 66% |
Table 4.
Average latency
| Stage | Component | Average Latency (ms) | Descriptions |
|---|---|---|---|
| A | ASR (Google Speech-to-Text) | 480–650 | Varies with noise and internet conditions |
| B | NLP (Gemini-l.5-pro) | 600–900 | Depends on prompt complexity and server load |
| C | TTS (gTTS) | 300–450 | Measured for responses < 50 words |
| Total Interaction | End-to-end delay | 1500–2200 | End-to-end delay per user query-response c |
Table 5.
Comparison of interaction latency between standard processing pipeline and FAQ dictionary-based optimization for common queries
| Stage | Component | Standard Pipeline Latency (ms) | FAQ Dictionary Pipeline Latency (ms) |
|---|---|---|---|
| A | ASR (Google Speech-to-Text) | 480–650 | 120–180 |
| B | NLP (Gemini-l.5-pro) | 600–900 | 240–360 |
| C | TTS (gTTS) | 300–450 | 180–270 |
| Total Interaction | End-to-end delay | 1500–2200 | 600–910 |
Table 6.
Position error
| Default Inflation Radius | Inflation Radius 0.5 m | |||||
|---|---|---|---|---|---|---|
| User | Attempts | Reached the Correct Coordinates | Error Position (m) | Reached the Correct Coordinates | Reached the Correct Coordinates | Error Position (m) |
| U1 | 2 | Yes | 0.08 | Yes | Yes | 0.06 |
| U2 | 2 | Yes | 0.09 | Yes | Yes | 0.07 |
| U3 | 3 | No | 0.50 | No | No | 0.40 |
| U4 | 4 | Yes | 0.07 | Yes | Yes | 0.05 |
| U5 | 2 | Yes | 0.08 | Yes | Yes | 0.06 |
| U6 | 2 | Yes | 0.09 | Yes | Yes | 0.07 |
| U7 | 3 | Yes | 0.08 | Yes | Yes | 0.06 |
| U8 | 4 | Yes | 0.10 | Yes | Yes | 0.08 |
| U9 | 3 | Yes | 0.09 | Yes | Yes | 0.07 |
| U10 | 4 | Yes | 0.10 | Yes | Yes | 0.08 |