

Over the past decade, the role of e-commerce markets are exceedingly crucial in the rapidly growing online economy [1, 2]. The availability of 24/7 shopping platforms without limitations has empowered consumers to purchase a wide array of goods anytime from online marketplaces. According to reports from the India Brand Equity Foundation (IBEF), India stands out as a country experiencing higher growth in e-commerce sales [3–5]. The projections indicate that revenues from this sector were expected to surge from USD 39 billion to USD 120 billion through 2021, marking the world’s wildest growth rate at an annual increase of 51% in income. Various aspects of online markets, such as customer preferences, usage behaviors, product evaluations, ratings, and shopping cart abandonment, have been thoroughly examined due to the extensive demand in the digital market. Furthermore, with the evolution of the Internet paving the way for new approaches in online commerce, customer lifestyles have undergone a digital transformation [6]. Now, when customers visit physical stores, it’s become a habit for them to compare prices between physical and virtual offerings. This habit increasingly leads customers toward digital shopping. A comprehensive survey involving approximately 23,000 consumers global revealed 54% of them create weekly/monthly purchases online, with 60% emphasizing price as the most crucial factor influencing their product choices [7].
It’s recognized that the experience of buying a product online differs significantly from traditional brick-mortar shopping. Despite the ease of accessing information, customers are reluctant to pay more. Pricing isn’t solely a means to boost sales but is also a pivotal factor impacting a business’s most crucial Key Performance Indicators (KPIs) [8, 9]. Conversely, when a potential customer initiates an online checkout but abandons process afore completing transaction, it results in online ordering drop-off [10]. Items added to a shopping cart may/may not eventually be bought and categorized as items consumer ‘abandoned.’ Online product ratings play a crucial role in shaping purchasing decisions, with lowerrated products experiencing decreased likelihood of being bought [11]. Elements like perceived value, pricing, experiential attributes, symbolic value, and purchase frequency indirectly influence cart abandonment rates [12, 13]. These elements encompass an understanding of reduction magnitude, distribution expenses and sales promotion. Apparent costs are determined based on online feedback and specific metrics [14]. This act of cart abandonment resembles adding products to cart during an online shopping session without completing the purchase [15].
In this paper, by integrating novel DTRSN with segmentation using GIFCMC, the proposed method aims to enhance the accuracy and effectiveness of segmenting e-commerce users. The proposed approach focuses on the novel deep learning method to enhance recommendation systems in E-commerce platforms, leading to more effective and personalized product recommendations for users.
The major contribution of this work is
- -
In this manuscript, the segmentation of e-commerce users on Cart Abandonment and Product Recommendation (CAPR) using DTRSN is proposed.
- -
Here, Fairness-aware Collaborative Filtering (FACF) is proposed to suggest personalized items or content to users based on their preferences and behavior.
- -
GIFCMC is introduced to segment preprocessed data to target-based customer groups. This segmentation facilitates personalized recommendations based on the identified customer groups.
- -
For product recommendations, novel DTRSN enhances cart transactions and overall user satisfaction during e-commerce transactions.
- -
To improve product recommendations, PCBESA is proposed to enhance DTRSN weight parameters.
The organization of this study reviews the related work in Part 2, proposed methodology in Part 3, Part 4 proves outcomes and discussion, and Part 5 conveys the conclusions.
Here, we reviewed some papers based on E-Commerce Users (ECUs) on CAPR using deep learning as follows:
Rifat et al. [16] have introduced a ML system designed to help merchants reduce the checkout abandonment rate through informed decision-making and strategic planning. As a key component of this system, they have constructed a robust ML model capable of predicting whether a customer will proceed to checkout after adding products to their cart, based on their activity. Additionally, system offers merchants the ability to delve into the underlying factors driving each prediction output, providing valuable insights for optimization. It has a low mean square error but has a high standard deviation.
Kaya and Kaleli, [17] have explained top-n recommendations in multi-criteria collaborative filtering (MCCF). This revolves around two key aspects, how likes establishing relational structure among products and through examining user inclinations alongside their unique patterns with rating deliveries. To discern rating delivery, product relationships, relation rule mining, and entropy measures were employed, and users’ attitudes, tendencies through evaluations were scrutinized using intuitionistic fuzzy sets. This has a high mean reciprocal rank but (MRR) has less accuracy.
Kumar et al. [18] have developed the multivariate pruning technique of web index searching on e-commerce websites using the Knuth Morris Pratt (KMP) algorithm, and they use a variety of web analytics methods in conjunction with machine learning (ML) classifiers to extract patterns from transactional data. Additionally, using log-based transactional data, an evaluation technique based on ML was used to determine how usable e-commerce websites are. The presented method seeks to determine the underlying relationship between the predictor elements and the overall usability of the e-commerce system by utilizing three ML approaches and multiple linear regressions. The presented method was expected to contribute to the economic profitability of the e-commerce industry.
Khan et al. [19] have presented Fuzzy sets/Qualitative Comparative Analysis to explore the relationship between these factors and shopping cart abandonment. Results suggest ad avoidance might serve as a learning device for consumers when they encounter ineffective messages or content, potentially impacting their perception of shopping cart abandonment for a specific brand. It has low root mean square error and low accuracy.
Wang et al. [20] have presented a stimulusorganism-response method to investigate elements impacting customers’ inclination towards online-store channel adoption (OSCA) and their choice to purchase from a physical seller. Dual studies were conducted to validate theories posited, focusing on Generation Y consumers in Mainland China. Data were gathered concerning two product categories across distinct timeframes. This has a low square root error but also has a low MRR.
Chawla and Kumar, [21] have presented the existing legal structure in India aimed at safeguarding the interests of online consumers. The freshly introduced regulations appear robust and capable of fortifying the rights of online consumers, thereby potentially fostering the growth of India’s e-commerce sector. With a sturdy legal framework and protective measures for consumers in place, the trajectory of e-commerce appears promising. The outcomes of add valuable insights to the realm of e-commerce, and customer rights protection through shedding light on pivotal factors influencing customer trust and loyalty. This has a low mean and has high root square error.
The proposed manuscript introduces a methodology named SEC-CAPR-DTRSRN. Proposed methodology diagram is displayed in Figure 1. The detailed procedure of the proposed methodology is shown below;
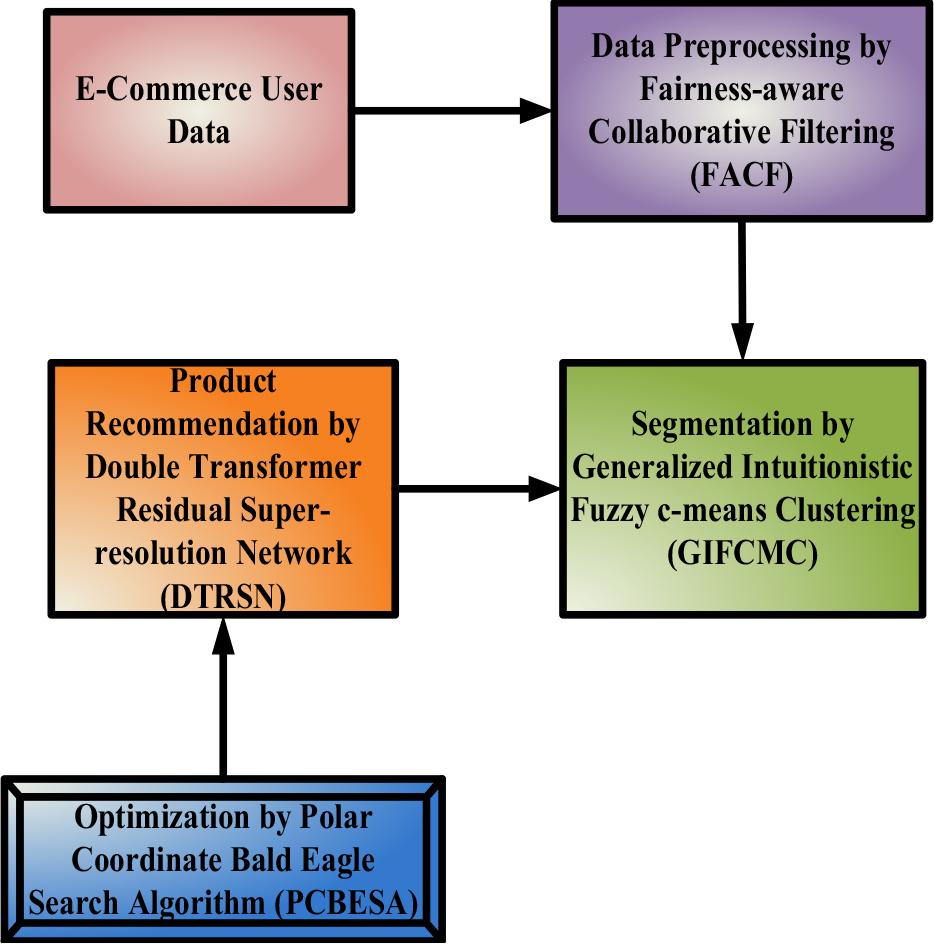
Proposed Methodology diagram SEC-CAPR-DTRSRN
Initially,the e-commerce data gathered from a multicategory store [22]. Then, the data are provided to the pre-processing phase.
The pre-processing stage involves the application of FACF [23] to provide personalized items or content to users based on their preferences and behavior. Fair user embedding’s reached by attaching classifier f1 to infer sensitive from user embedding’s. Likewise, item classifier f2 to forecasts sensitive information hidden in items’ embedding. Assuming each items sensitive labels d, present FACF. Filter module is put in to user-items’ embedding utilizing classical CF method N. The filtered embedding space, forecasts that rating
Pseudo item labels are allocated, deliberate design of loss function CF2(Ho, D). The FACF identifies and groups users based on their preferences and behaviours. This step helps in creating user segments that can be utilized in subsequent stages of the methodology.
The GIFCMC extends traditional Fuzzy c-means [24] clustering by introducing conception of an intuitionistic fuzzy set. Intuitionistic fuzzy sets accommodate not only degree of membership but also the degree of non-membership, a hesitation degree for each data point, offering a more comprehensive representation of uncertainty in the data. The pre-processed data undergo segmentation utilizing GIFCMC to create target-based customer groups. First, the numerical value is transformed into discrete values, then the values are calculated in Equation (5).
The final output is a set of clusters, each containing data points assigned to it based on their membership degrees. In the context of the SEC-CAPR-DTRSRN methodology, GIFCMC is applied to segment the preprocessed e-commerce data into customer groups, helping to identify patterns and preferences that can be used for targeted product recommendations using the subsequent DTRSN.
The DTRSN [25] is employed to enhance cart transactions by recommending products. Cart abandonment may stem from discrepancies between consumer perceptions and digital site experiences, leading to frustration and cart abandonment. The DTRSN takes as input the segmented and pre-processed e-commerce data, which includes information about user behaviors, preferences, and historical interactions with the platform. The input data is passed through an embedding layer to convert categorical variables and user_item interactions into a continuous vector representation suitable for deep learning. The core of the DTRSN lies in its Double Transformer architecture. The Transformer model is a powerful Neural Network (NN) architecture originally intended for Natural Language Processing (NLP) but adaptable to various sequence-based tasks. Remaining connections are engaged to solve vanishing gradient issue, aid training of deep networks. Such connections permit method to learn remaining mappings, making it easier to optimize and improve the flow of information through the network. The DTRSN is trained using a suitable loss function that calculates the dissimilarity among the predicted recommendations and the actual user behavior (e.g., purchase history). The optimization algorithm is employed to optimize the model’s parameters during training. The mathematical representation is as follows;
The module can extract concealed weight information in the spatial area. Recombine spatial features create feature vectors through spatial similarity in accordance with the correlation of the features. Thus, it is given by the Equation (11)
The utilization of DTRSN in this context aims to provide a sophisticated and personalized approach to product recommendations, with the ultimate goal of reducing cart abandonment and enhancing overall user satisfaction during e-commerce transactions.
The PCBESA [26] is an optimization method for fine-tuning the parameters of the DTRSN to enhance its effectiveness in making precise product recommendations. PCBESA method is used to enhance weights parameters [α and β] of proposed DTRSN. Below is a general description of the PCBESA and its steps:
- Step 1:
Initialization
The initial population of PCBESA is, initially generated by randomness. Then, the initialization is derived as Equation (15)
15 where, ρ is the poplar’s diameter of the jth initialization position.\rho = \left\{ {\matrix{ {{\rho _{1,1}}} \hfill & {{\rho _{1,2}}} \hfill & \ldots \hfill & {{\rho _{1,u}}} \hfill \cr {{\rho _{2,q}}} \hfill & {{\rho _{2,2}}} \hfill & \ldots \hfill & {{\rho _{2,u}}} \hfill \cr {{\rho _{n,1}}} \hfill & {{\rho _{n,2}}} \hfill & \ldots \hfill & {{\rho _{n,u}}} \hfill \cr } } \right\} - Step 2:
Random generation
The input weight parameter [α and β] is produced at random using PCBESA metho.
- Step 3:
Fitness function
It creates a random solution from initialized assestments. It is assesssed utilizing the optimizing parameter. This is calculated using Equation (16):
16 {\rm{Fitness Function }} = {\rm{ optimizing }}[\alpha {\rm{ and }}\beta ] - Step 4:
Exploration Phase:
In the initialization phase, the PBES algorithm must also regulate the border, and each individual can be dispersed throughout the entire search space. Thus, the polar angle F has a value range of (0, 2π). In addition, boundaries must be defined for the polar diameter in order to prevent the PBES algorithm from exceeding them during the optimization process. Then the exploration is given as Equations (17), (18), and (19):
17 where, ρBest denotes the area that was found to be the greatest choice for the bald eagles to choose during the prior search; ρj indicates where the bald eagles are located; ρj,New is where the bald eagles have relocated; ρMean denotes position of bald eagles’ average distribution following previous exploration; n1 and w1 symbolize arithmetic normalization of η, and ρj+1 is the jth bald eagles’ most recent revised position.{\rho _{j,New}} = {\rho _j} + {W_1}*\left( {{\rho _j} - {\rho _{Mean}}} \right) + {N_1}*\left( {{\rho _j} - {\rho _{j + 1}}} \right) 18 where, n1 symbolize the arithmetic normalization of η; η1 denoted as every bald eagles location is updated.{n_1} = {{{\eta _1}} \over {\max \left( {\left| {{\eta _1}} \right|} \right)}} 19 where, θ by renewing, the specific position is update; η2 denoted as every bald eagles location is updated and Rand is a random integer between 0 and 1.{\eta _2} = {\rm{ rand }}*\cos (\theta ). - Step 5:
Exploitation phase for optimizing [α and β]:
Retention and replacement are the two scenarios that exist. Proceed with the first operation if novel fitness value is determined to be better than present fitness value; if not, proceed with the second operation. Instead of using the Cartesian coordinate system, the PBES updates individual positions in the polar coordinate system. The location of person is derived through updates. Individuals’ update speeds will increase significantly as a result, and convergence efficiency will rise by Equations (20), (21), and (22):
20 where, ρj,new is where the bald eagles have relocated; ρmean denotes position of bald eagles’ average distribution following previous exploration; ρbest denotes area that was found to be the greatest choice for the bald eagles to choose during the prior search; pj indicates where the bald eagles are located; rand is a random integer between 0 and 1; n2 and n2 needs to be compared to one another’s bald eagle and z1 and z2 are the enhancement coefficient, which is taken by all of them to be 2.{\rho _{j,{\rm{ }}new{\rm{ }}}} = {\mathop{\rm rand}\nolimits} *{\rho _{best{\rm{ }}}} + {w_2}*\left( {{\rho _j} - {z_1}*{\rho _{mean }}} \right) + {n_2}*\left( {{\rho _j} - {z_2}*{\rho _{best }}} \right) 21 where, n2 needs to be compared to one another’s bald eagle and η2 is denoted as every bald eagles, location is updated.{n_2} = {{{\eta _2}} \over {\max \left( {\left| {{\eta _2}} \right|} \right)}} 22 where, r1 is a random integer between AU 0; η2 is denoted as every bald eagles’ location is updated and Cosg is denoted by renewing, the specific position is updated. Then the specific position is updated is given as Equation (23):{\eta _2} = {r_1}*\cos g(\theta ){\eta _2} 23 here,β denotes coefficient of disturbance, with values among 0, 2; Rand is a random integer between 0; θj+1 the new role for each individual is established and θj needs to be compared to one another.{\theta _{j + 1}} = \beta *{\theta _j} \pm 2*{\cos ^{ - 1}}(2*rand - 1)
The PCBESA aims to efficiently explore the solution space and find optimal parameters for the DTRSN, enhancing its performance in the specific task of product recommendation in e-commerce. The algorithm draws inspiration from the bald eagles’ hunting behavior and their ability to navigate and search effectively in their environment.
The experimental outcome of the suggested technique is discussed in the section. The simulations were carried out on Windows 7, an Intel Core i5, and 8GB of RAM. The suggested method was tested using performance metrics in MATLAB. The proposed SEC-CAPR-DTRSRN method is implemented, and their performance is evaluated utilizing metrics likes MSE, standard deviation, and MRR. The obtained outcome of suggested SEC-CAPR-DTRSRN analyzed with existing ML-MCA-EC [16], PR-MCCF-EC [17], and ML-ARM-EC [18] methods, respectively.
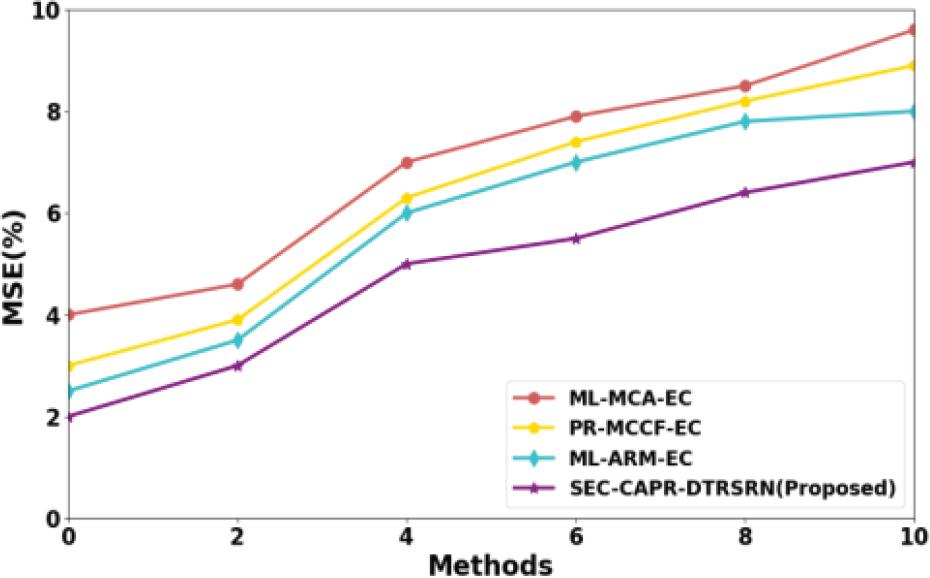
It measures average squared difference among forecasted and actual values. In context of the proposed method, MSE can be utilized to assess accurateness of product recommendations. This is calculated in Equation (24),
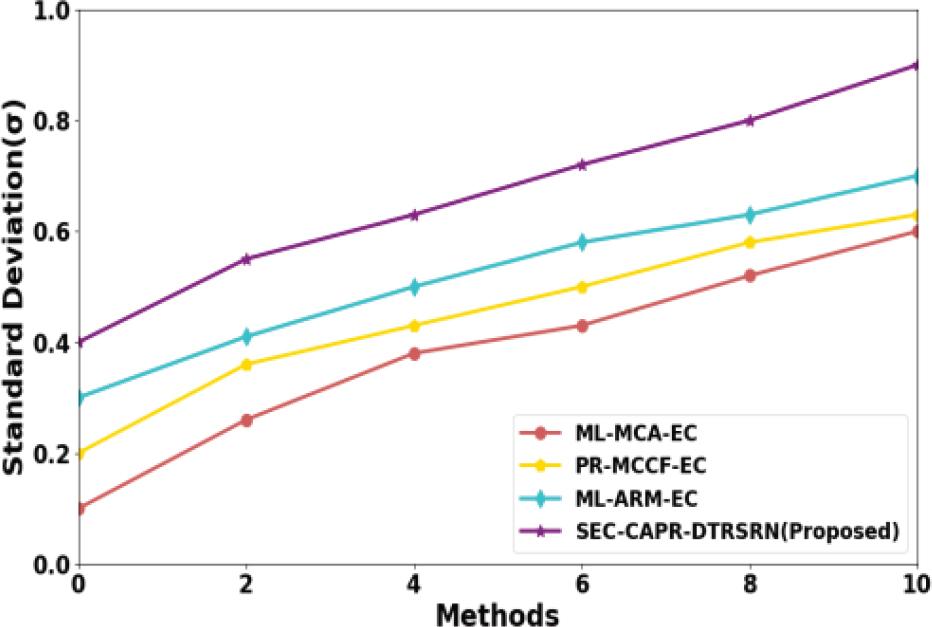
It is a scale of amount of variation in a set of values. In context of performance evaluation, it provides insights into the consistency of the recommendations. It is calculated by Equation (25),
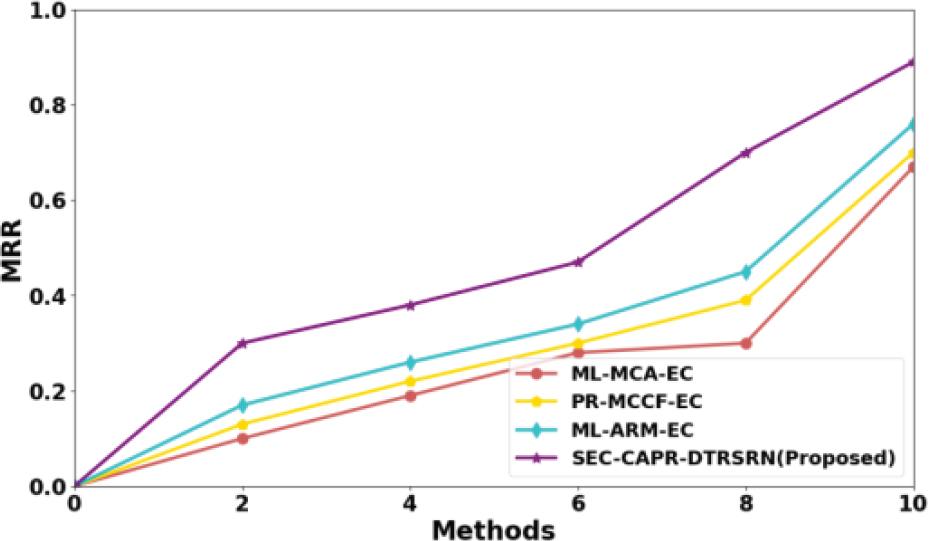
MRR is a metric commonly used to evaluate the effectiveness of recommendation systems in ranking items. It measures how well the system ranks the relevant items higher in the list. It is given in Equation (26),
Figure 2 shows MSE analysis. The SEC-CAPR-DTRSRN gives a low mean square of 20.78%, 19.67% and 27.80% with existing ML-MCA-EC, PR-MCCF-EC, and ML-ARM-EC methods, respectively. Lower values are better, as they signify higher accuracy and consistency in the recommendations.
MSE analysis
Figure 3 shows standard deviation analysis. The SEC-CAPR-DTRSRN gives low standard deviations of 30.78%, 25.67% and 17.80% with existing ML-MCA-EC, PR-MCCF-EC, and ML-ARM-EC methods, respectively.
Standard deviation analysis
Figure 4 displays MRR analysis. The SEC-CAPR-DTRSRN gives high MRR of 20.48%, 23.57% and 19.80% with existing ML-MCA-EC, PR-MCCF-EC, and ML-ARM-EC methods, respectively.
MRR analysis
The SECU-CAPR-DTRSRN introduces a unique and advanced approach to enhance user experience and transaction success. Segmentation is a critical stage in understanding, and catering to diverse necessities, and behavior of ECU. By focusing on cart abandonment patterns, the segmentation process aims to detect distinct user groups with common characteristics. The integration of DTRSRN in the proposed system signifies a sophisticated and state-of-the-art approach. The model’s ability to capture intricate patterns and features in user behavior enhances the precision of product recommendations. By focusing on cart abandonment, the methodology acknowledges the importance of identifying and addressing the root causes behind this behavior. Understanding the reasons for abandonment is crucial for implementing operative approaches to reduce it. The ultimate goal of the proposed methodology is to positively impact conversion rates by reducing cart abandonment. A more personalized and dynamic approach, facilitated by DTRSRN and reinforcement learning, holds the potential to create a more seamless and satisfying shopping experience.
The SECU-CAPR-DTRSRN is proposed. Through GIFCMC, the user base is effectively segmented into target-specific groups. This user-centric approach enables more personalized and targeted interventions. The utilization of the DTRSRN for product recommendations demonstrates a commitment to employing advanced deep learning techniques. This enhances the system’s ability to understand user preferences and deliver more accurate and relevant product suggestions. Implementation and evaluation of the proposed method utilizing metrics likes mean, MSE, standard deviation, and MRR provide a quantitative assessment of its effectiveness. Such metrics enable complete understanding of system’s accurateness, consistency, and ranking quality.