

Figure 1.
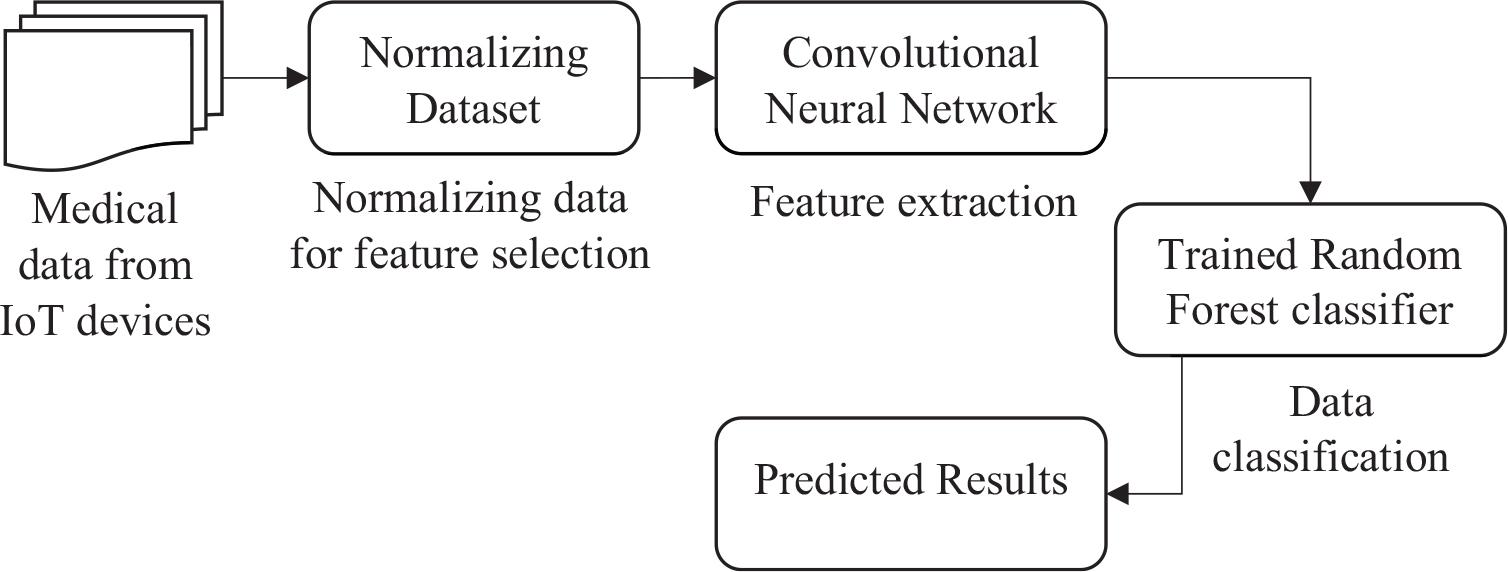
Figure 2.
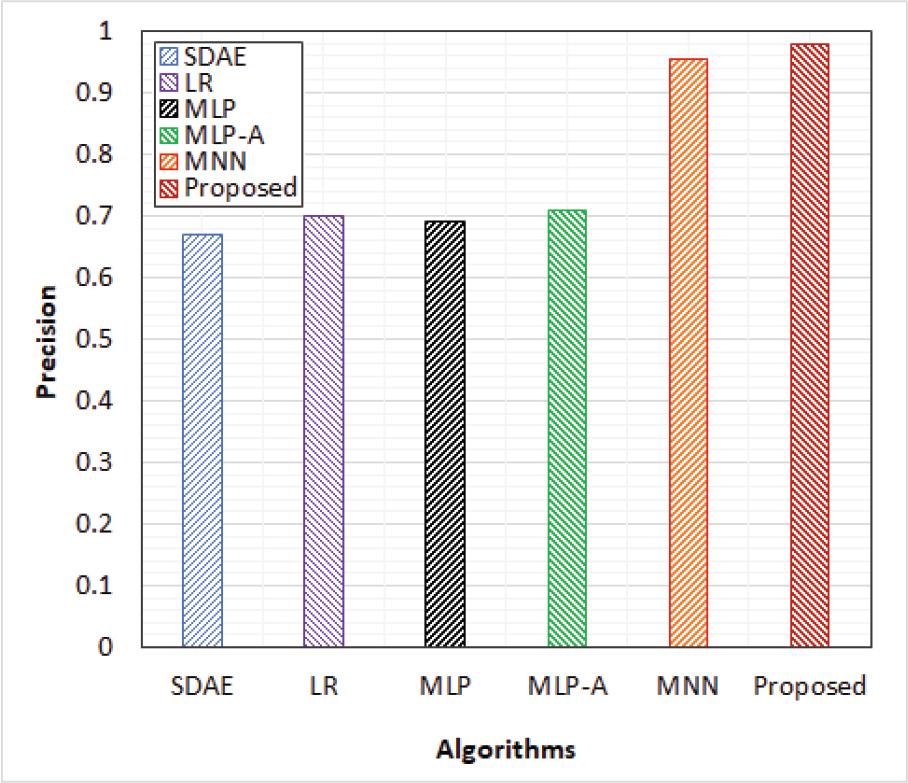
Figure 3.
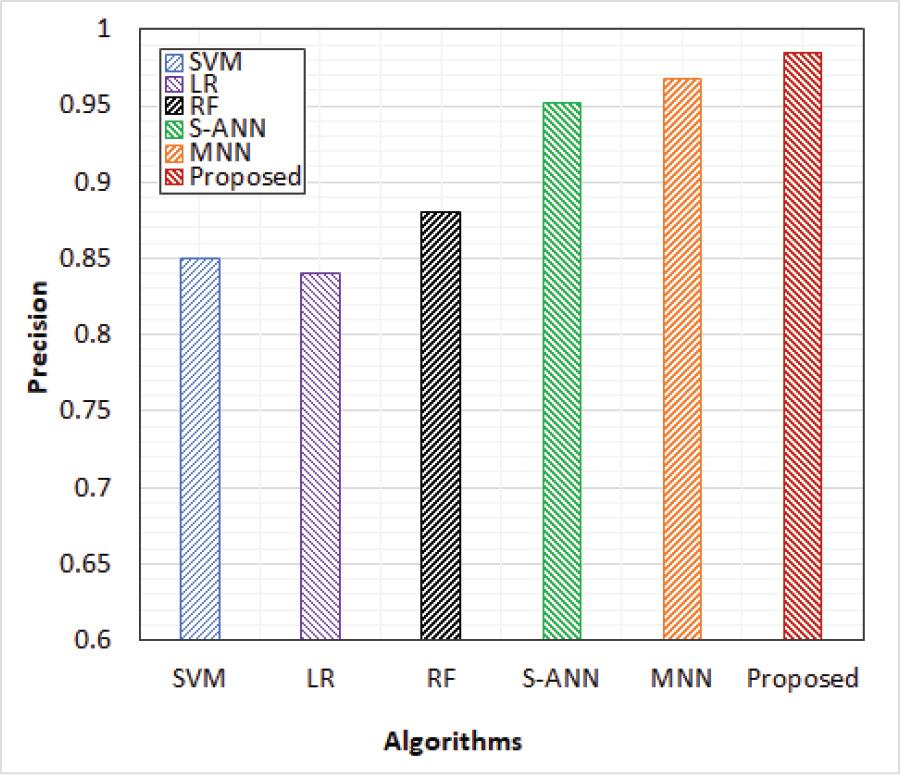
Figure 4.
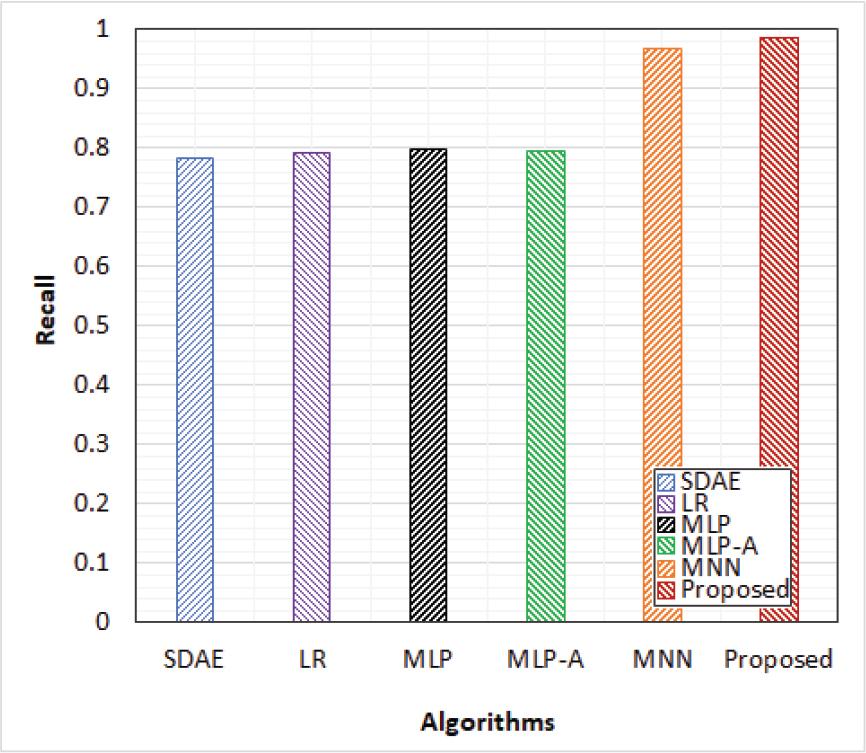
Figure 5.
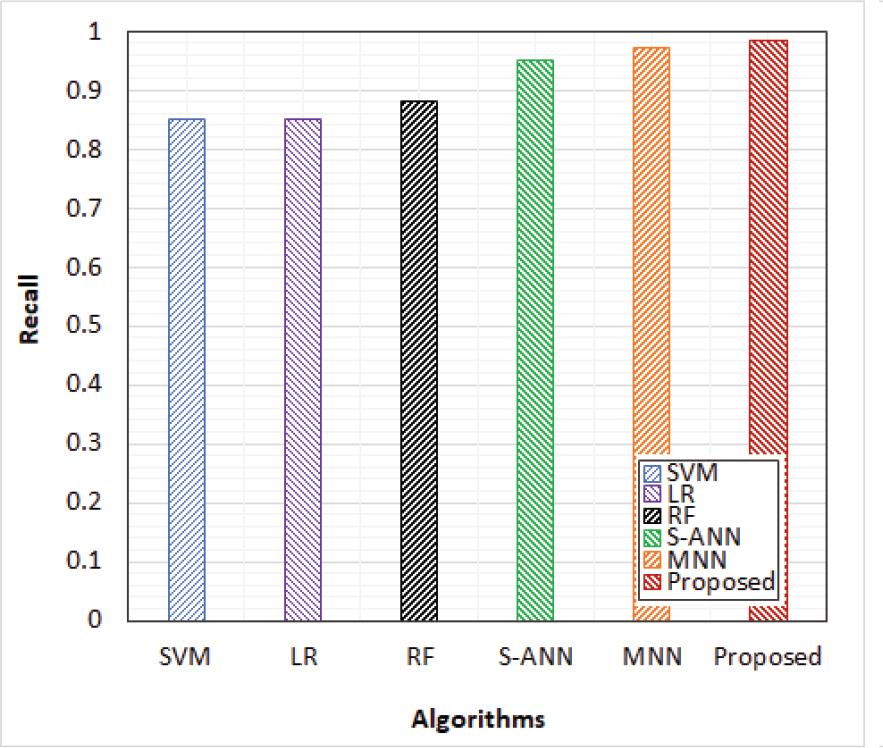
Figure 6.
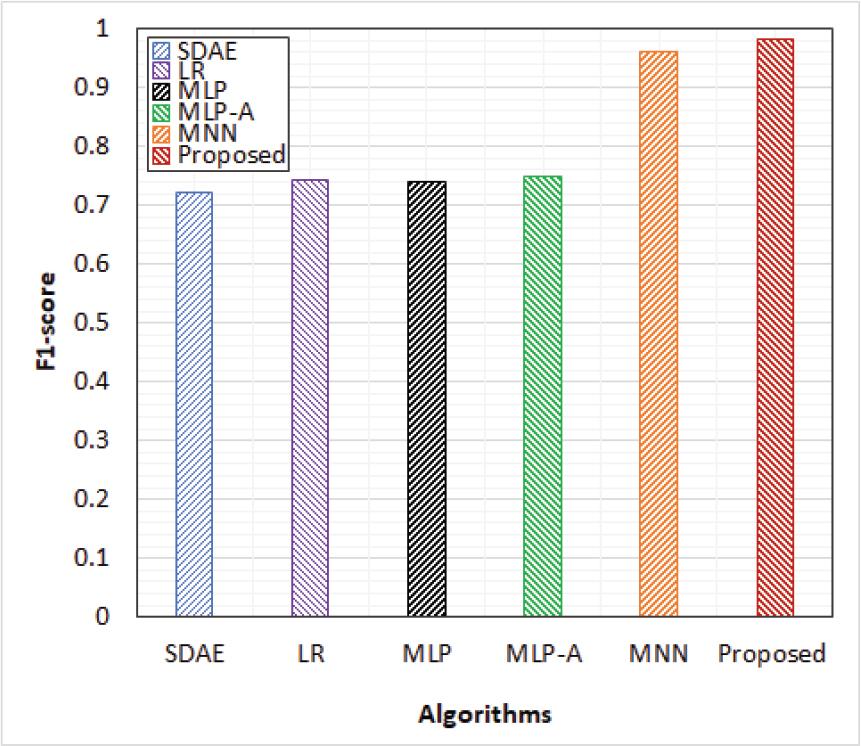
Figure 7.
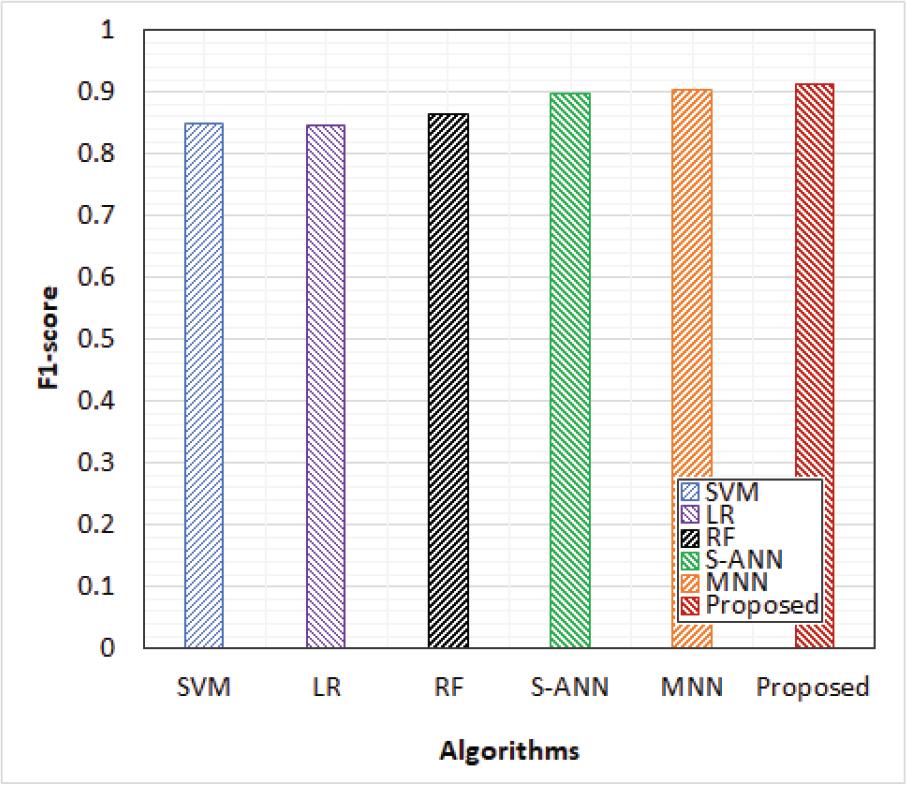
Figure 8.
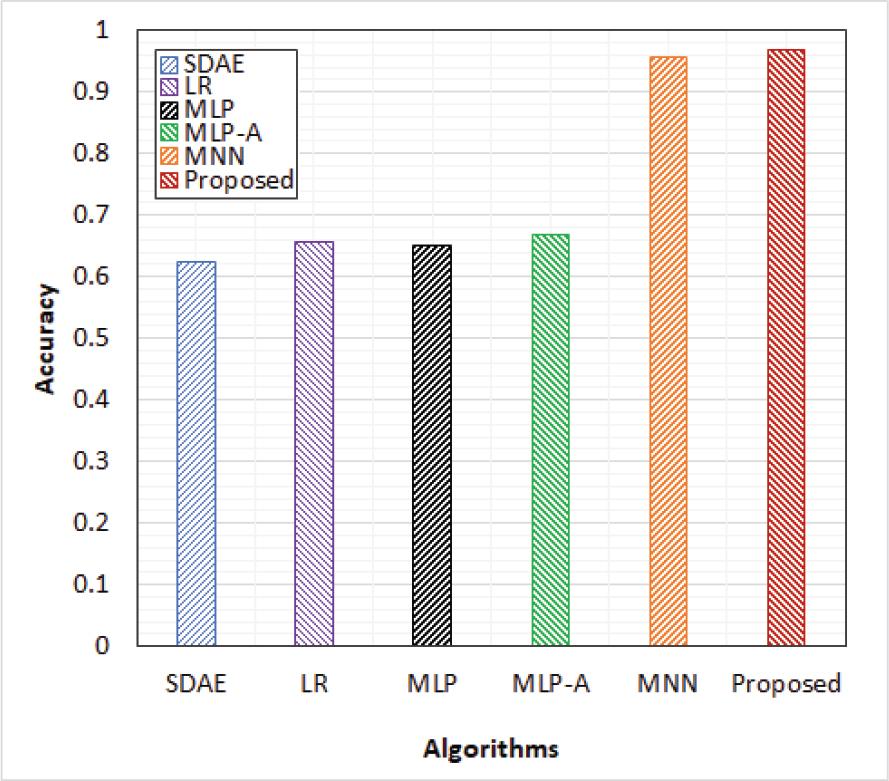
Figure 9.
j_jamris-2025-019_utab_001
| Pseudocode for the proposed hybrid deep learning algorithm |
|---|
| Input: Normalized Medical data (A) |
| Output: Predicted Result(P) |
| Start |
| Determine the convolution process by |
| Gi = f(Gi−1⊗Vi + Bi) |
| Obtain the feature extraction of input medical data by |
| pooling layer as Q(i) |
| Reduce the dimension of feature map by FC layer in the form |
| of fixed vector length |
| FC output Q(i) is given as input to RF classifier. |
| Retrieve the training dataset S from the input dataset of RF |
| classifier by bootstrap method |
| Obtain S sub classifier(or) decision tree for S dataset |
| Calculate the values of TP, FP, FN, TN, CPR, CPV for all sub |
| classifiers. |
| Obtain the values of CAE, CSRE and R2Measure. |
| Obtain the weight of the classifier as Wi |
| Feed the system with test dataset to estimate the performance. |
| Feed the unclassified sample and classify them according to F-rank weighted RF |
| Determine the final classification result of sub classifier j as |
| zj(x) |
| Calculate the rank of Z(x) from the output variable value P |
| If P is in the positive class, add one rank in positive class of Z(x) |
| Else add one rank in negative class of Z(x) |
| Compare two ranks and predict the majority vote as final result |
| If majority voting of Z(x) is in the positive class, then predict the result as Abnormal |
| Else predict the result as Normal |
| End |
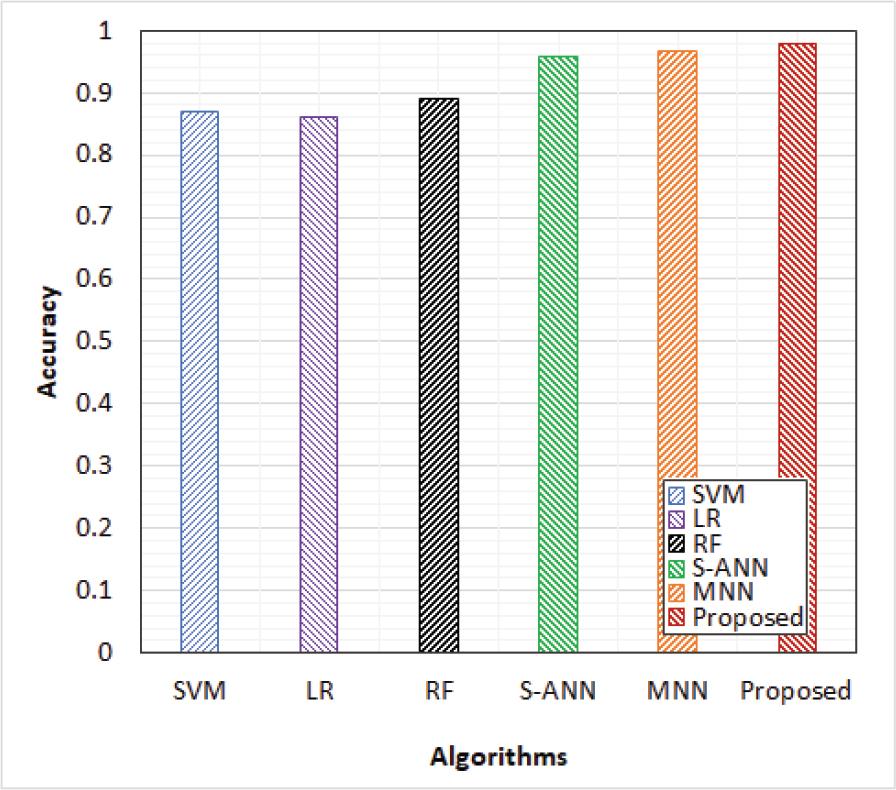
Performance comparative analysis
| S.No | Method | Accuracy | Precision | Recall |
|---|---|---|---|---|
| 1 | Stacked denoising auto-encoder (SDAE) | 0.623 | 0.670 | 0.782 |
| 2 | Logistic regression (LR) | 0.655 | 0.700 | 0.792 |
| 3 | MLP | 0.651 | 0.692 | 0.799 |
| 4 | MLP with attention mechanism | 0.667 | 0.710 | 0.795 |
| 5 | SVM | 0.87 | 0.85 | 0.85 |
| 6 | Logistic regression (LR) | 0.86 | 0.84 | 0.85 |
| 7 | Random forest (RF) | 0.89 | 0.88 | 0.88 |
| 8 | Swarm-ANN | 0.957 | 0.952 | 0.952 |
| 9 | MNN | 0.966 | 0.962 | 0.97 |
| 10 | Proposed CNN-RF | 0.973 | 0.982 | 0.987 |
Performance metrics of proposed model
| S.No | Performance metrics | Dataset 1 | Dataset 2 |
|---|---|---|---|
| 1. | Recall | 0.987 | 0.986 |
| 2. | False positive rate (FPR) | 0.02 | 0.03 |
| 3. | Precision | 0.979 | 0.984 |
| 4. | F1-score | 0.983 | 0.912 |
| 5. | CAE | 0.04 | 0.05 |
| 6. | CSRE | 0.02 | 0.018 |
| 7. | R2 measure | 0.98 | 0.975 |
| 8. | Data Training Time | 7.8 | 6.4 |
| 9. | Accuracy | 0.968 | 0.978 |
Confusion matrix
| Actual | Prediction | |
|---|---|---|
| Diseased | Non-Diseased | |
| Diseased | TP | FN |
| Non-Diseased | FP | TN |