

Figure 1.
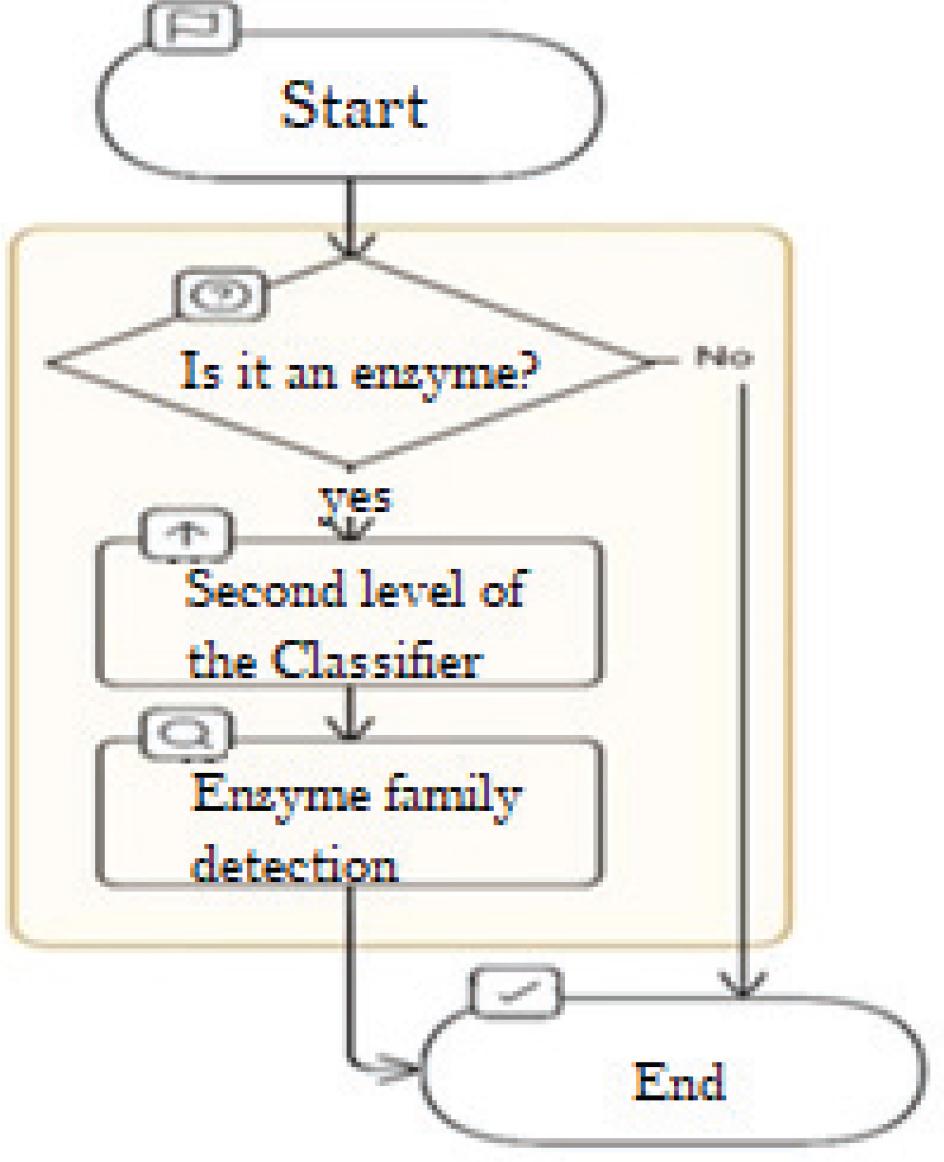
Figure 2.
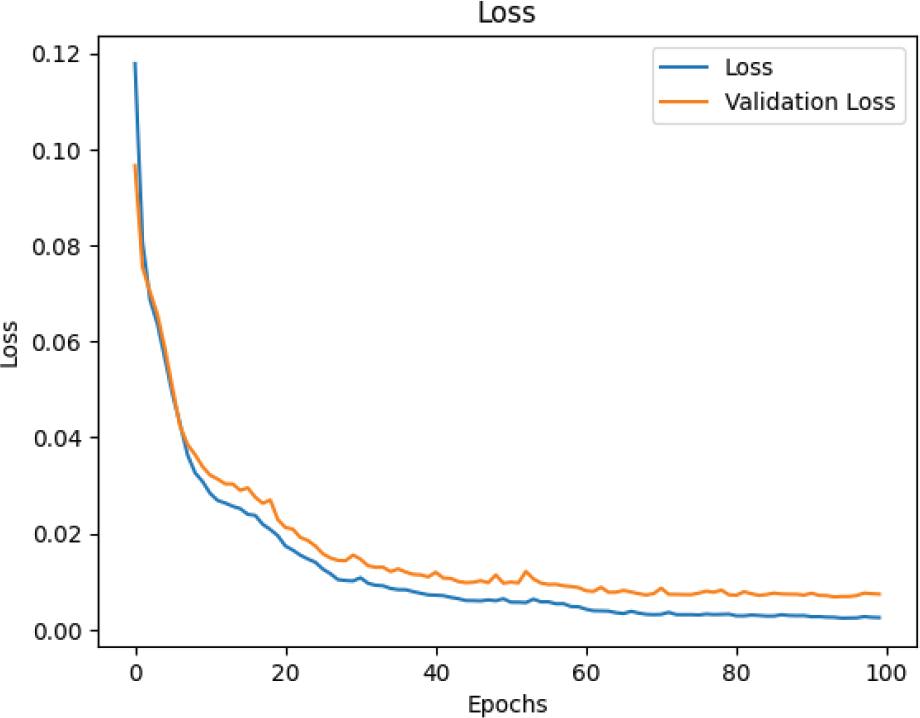
Figure 3.
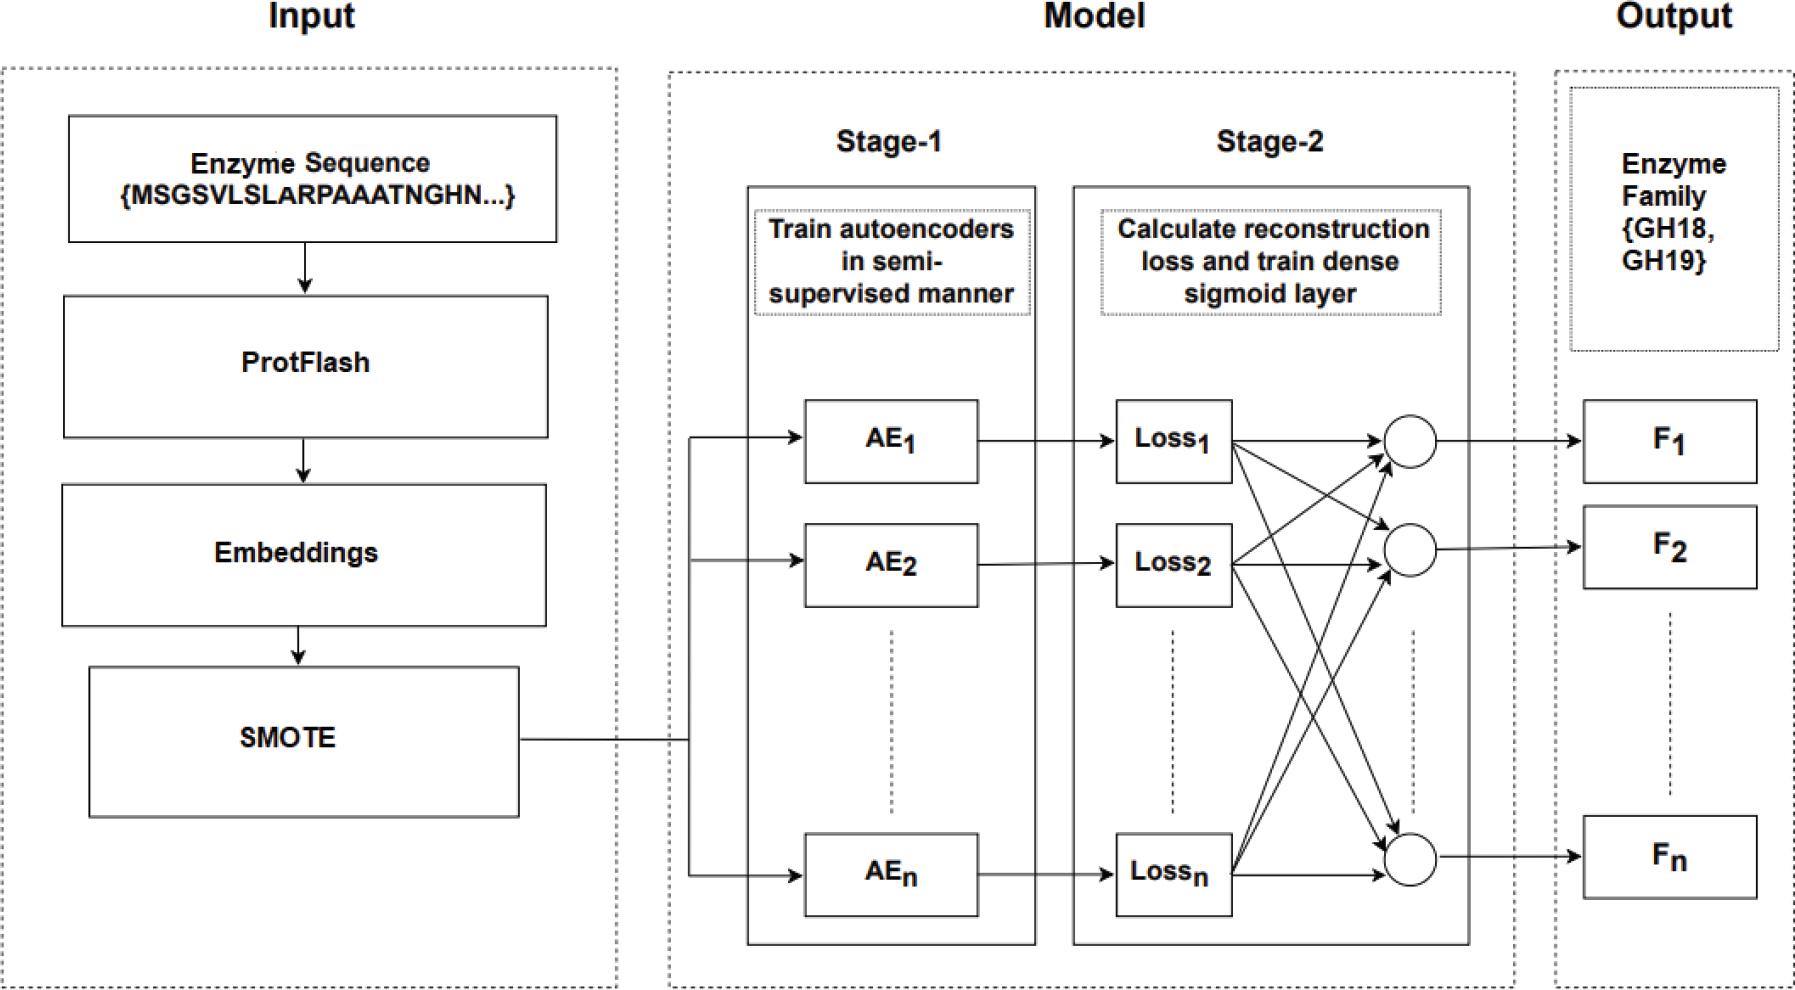
Figure 4.
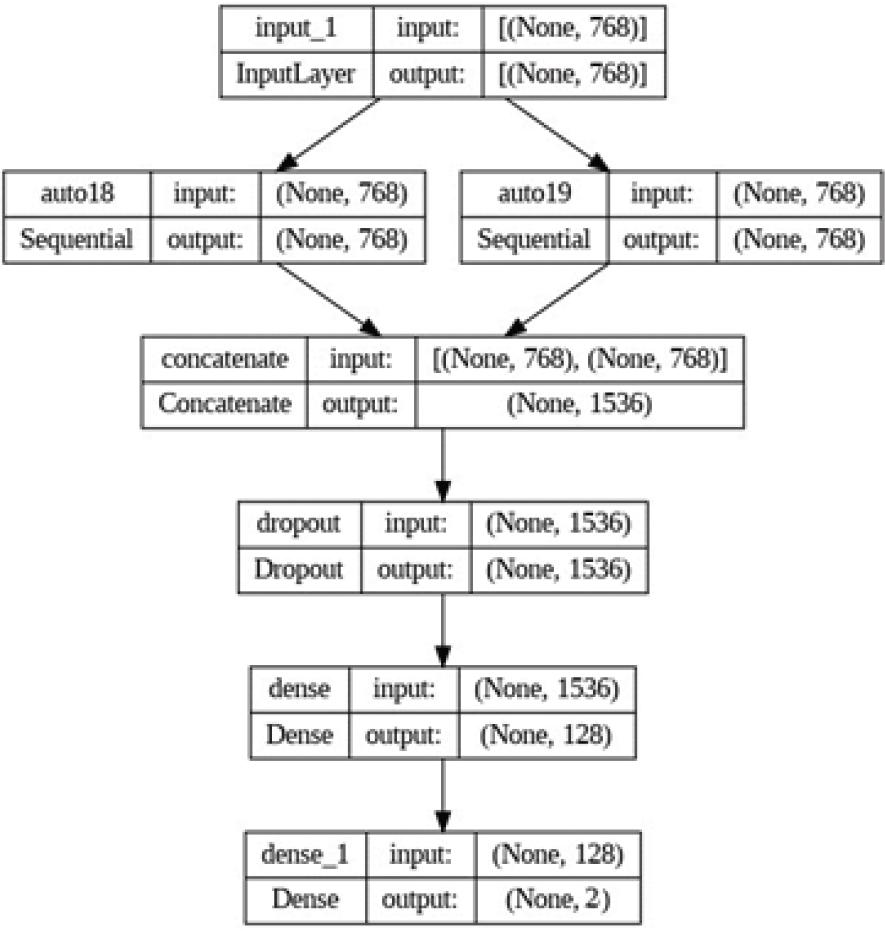
Figure 5.
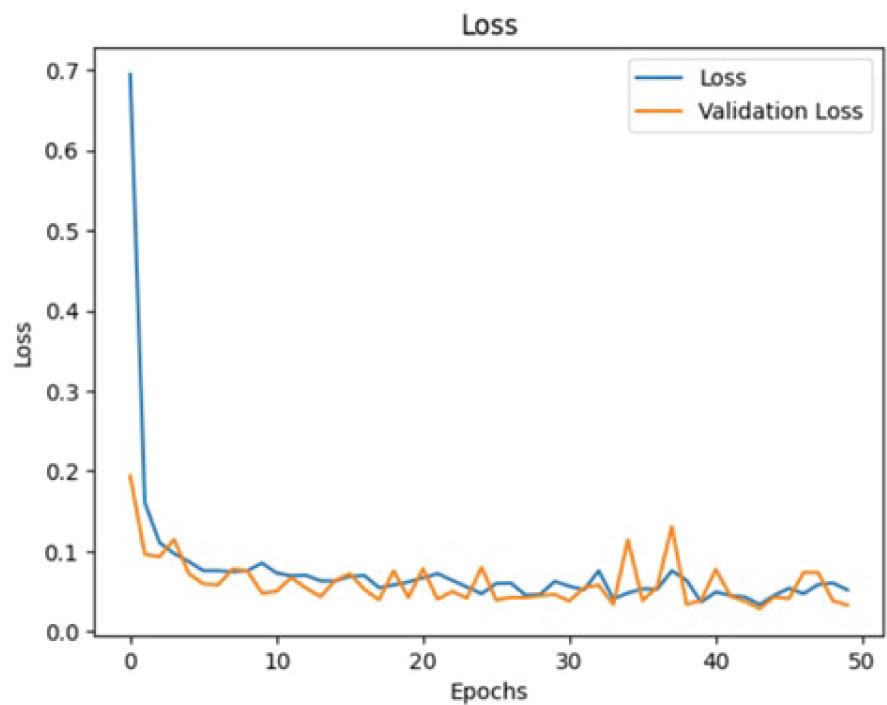
Figure 6.
Results of the family classification
| Precision | Recall | F1-Score | |
|---|---|---|---|
| GH18 | 0.90 | 0.90 | 0.90 |
| GH19 | 0.91 | 1.00 | 0.95 |
| No Enzyme | 0.89 | 0.80 | 0.84 |
| accuracy | 0.90 | ||
| macro avg | 0.90 | 0.90 | 0.90 |
| weighted avg | 0.90 | 0.90 | 0.90 |
Number of enzymes per family
| Family | Number of enzymes |
|---|---|
| GH18 | 356 |
| GH19 | 83 |
Comparison of the trainings of the First Level
| Loss Function | Loss Function (Validation) | |
|---|---|---|
| Without SMOTE | 0.0202 | 0.0223 |
| SMOTE | 0.0127 | 0.0162 |
| Hyperparameter optimization. (SMOTE) |
Comparison of the training of the Second Level
| Loss Function | Loss Function (Validation) | |
|---|---|---|
| Without SMOTE | 0.1163 | |
| SMOTE | 0.0518 | |
| Hyperparameter optimization. (SMOTE) | 0.0392 | 0.0350 |
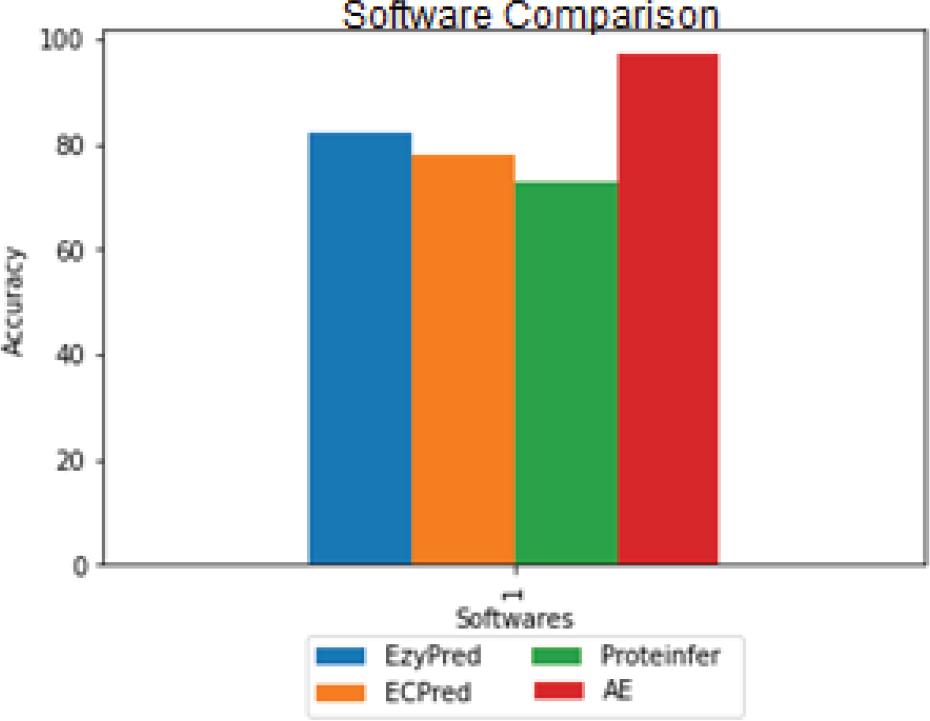
Comparison of different softwares for the classification of sequences into enzymes or non-enzymes (precision)
| EzyPred | ECPred | Proteinfer | AE | |
|---|---|---|---|---|
| Not Enzyme | 0.59 | 0.57 | 0.47 | 0.91 |
| Enzyme | 1.00 | 0.82 | 0.95 | 1.00 |
Comparison of different softwares for the classification of sequences into enzymes or non-enzymes (F1-score)
| EzyPred | ECPred | Proteinfer | AE | |
|---|---|---|---|---|
| Not Enzyme | 0.74 | 0.47 | 0.62 | 0.95 |
| Enzyme | 0.87 | 0.86 | 0.78 | 0.98 |
Comparison of different softwares for the classification of sequences into enzymes or non-enzymes (recall)
| EzyPred | ECPred | Proteinfer | AE | |
|---|---|---|---|---|
| Not Enzyme | 1.00 | 0.40 | 0.90 | 1.00 |
| Enzyme | 0.77 | 0.90 | 0.67 | 0.97 |