
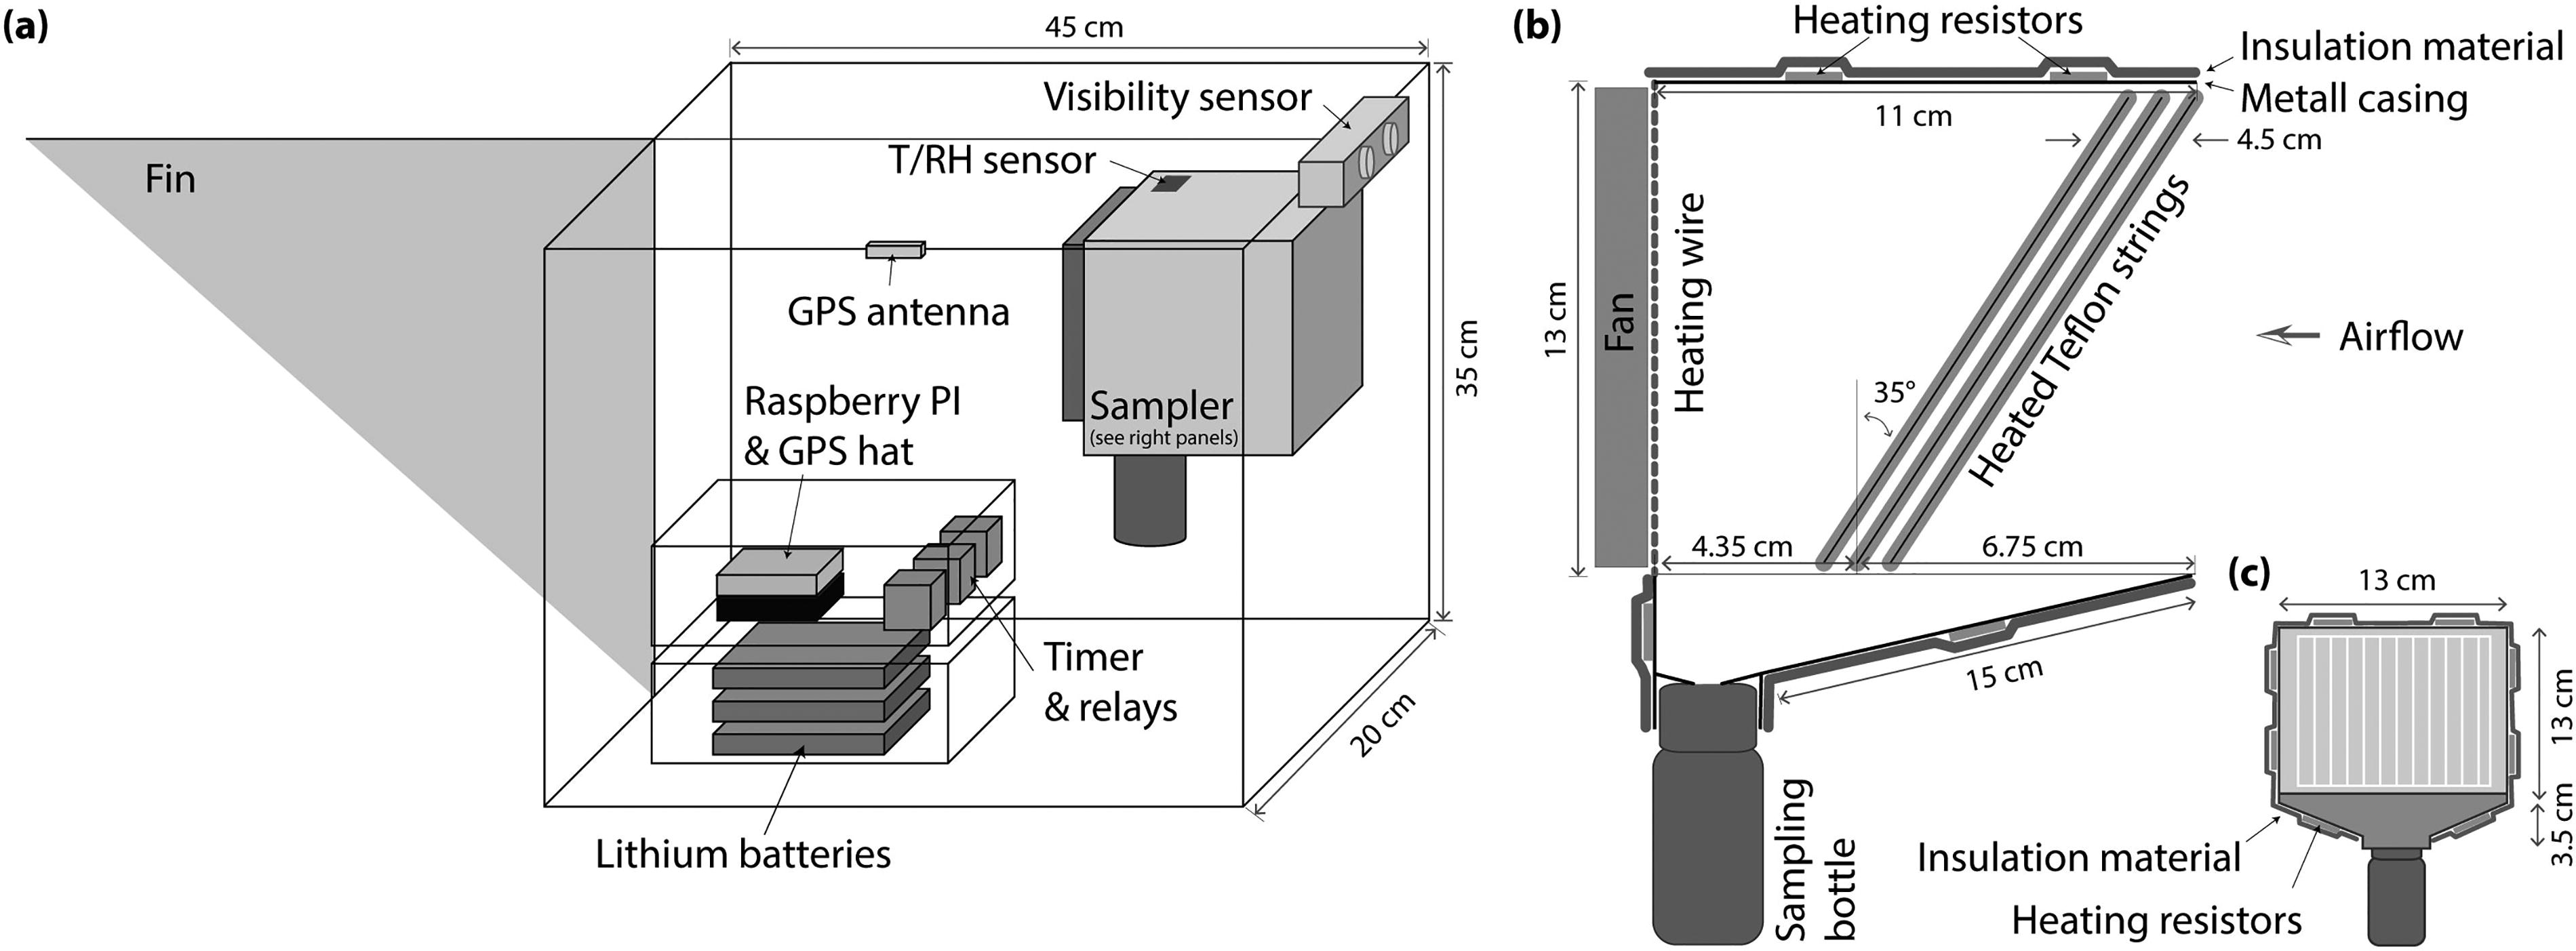
Fig. 1.
Setup of the miniaturised cloud water sampler (mini-CWS). (a) Schematic of the mini-CWS which consists of the cloud water sampler unit, batteries, a data acquisition device, a timer with relays and sensors to measure temperature, humidity, visibility and GPS position. (b) Side view of sampler unit. (c) Front view of sampler unit. The Teflon strings are mounted in three sections with 6 rows in total.
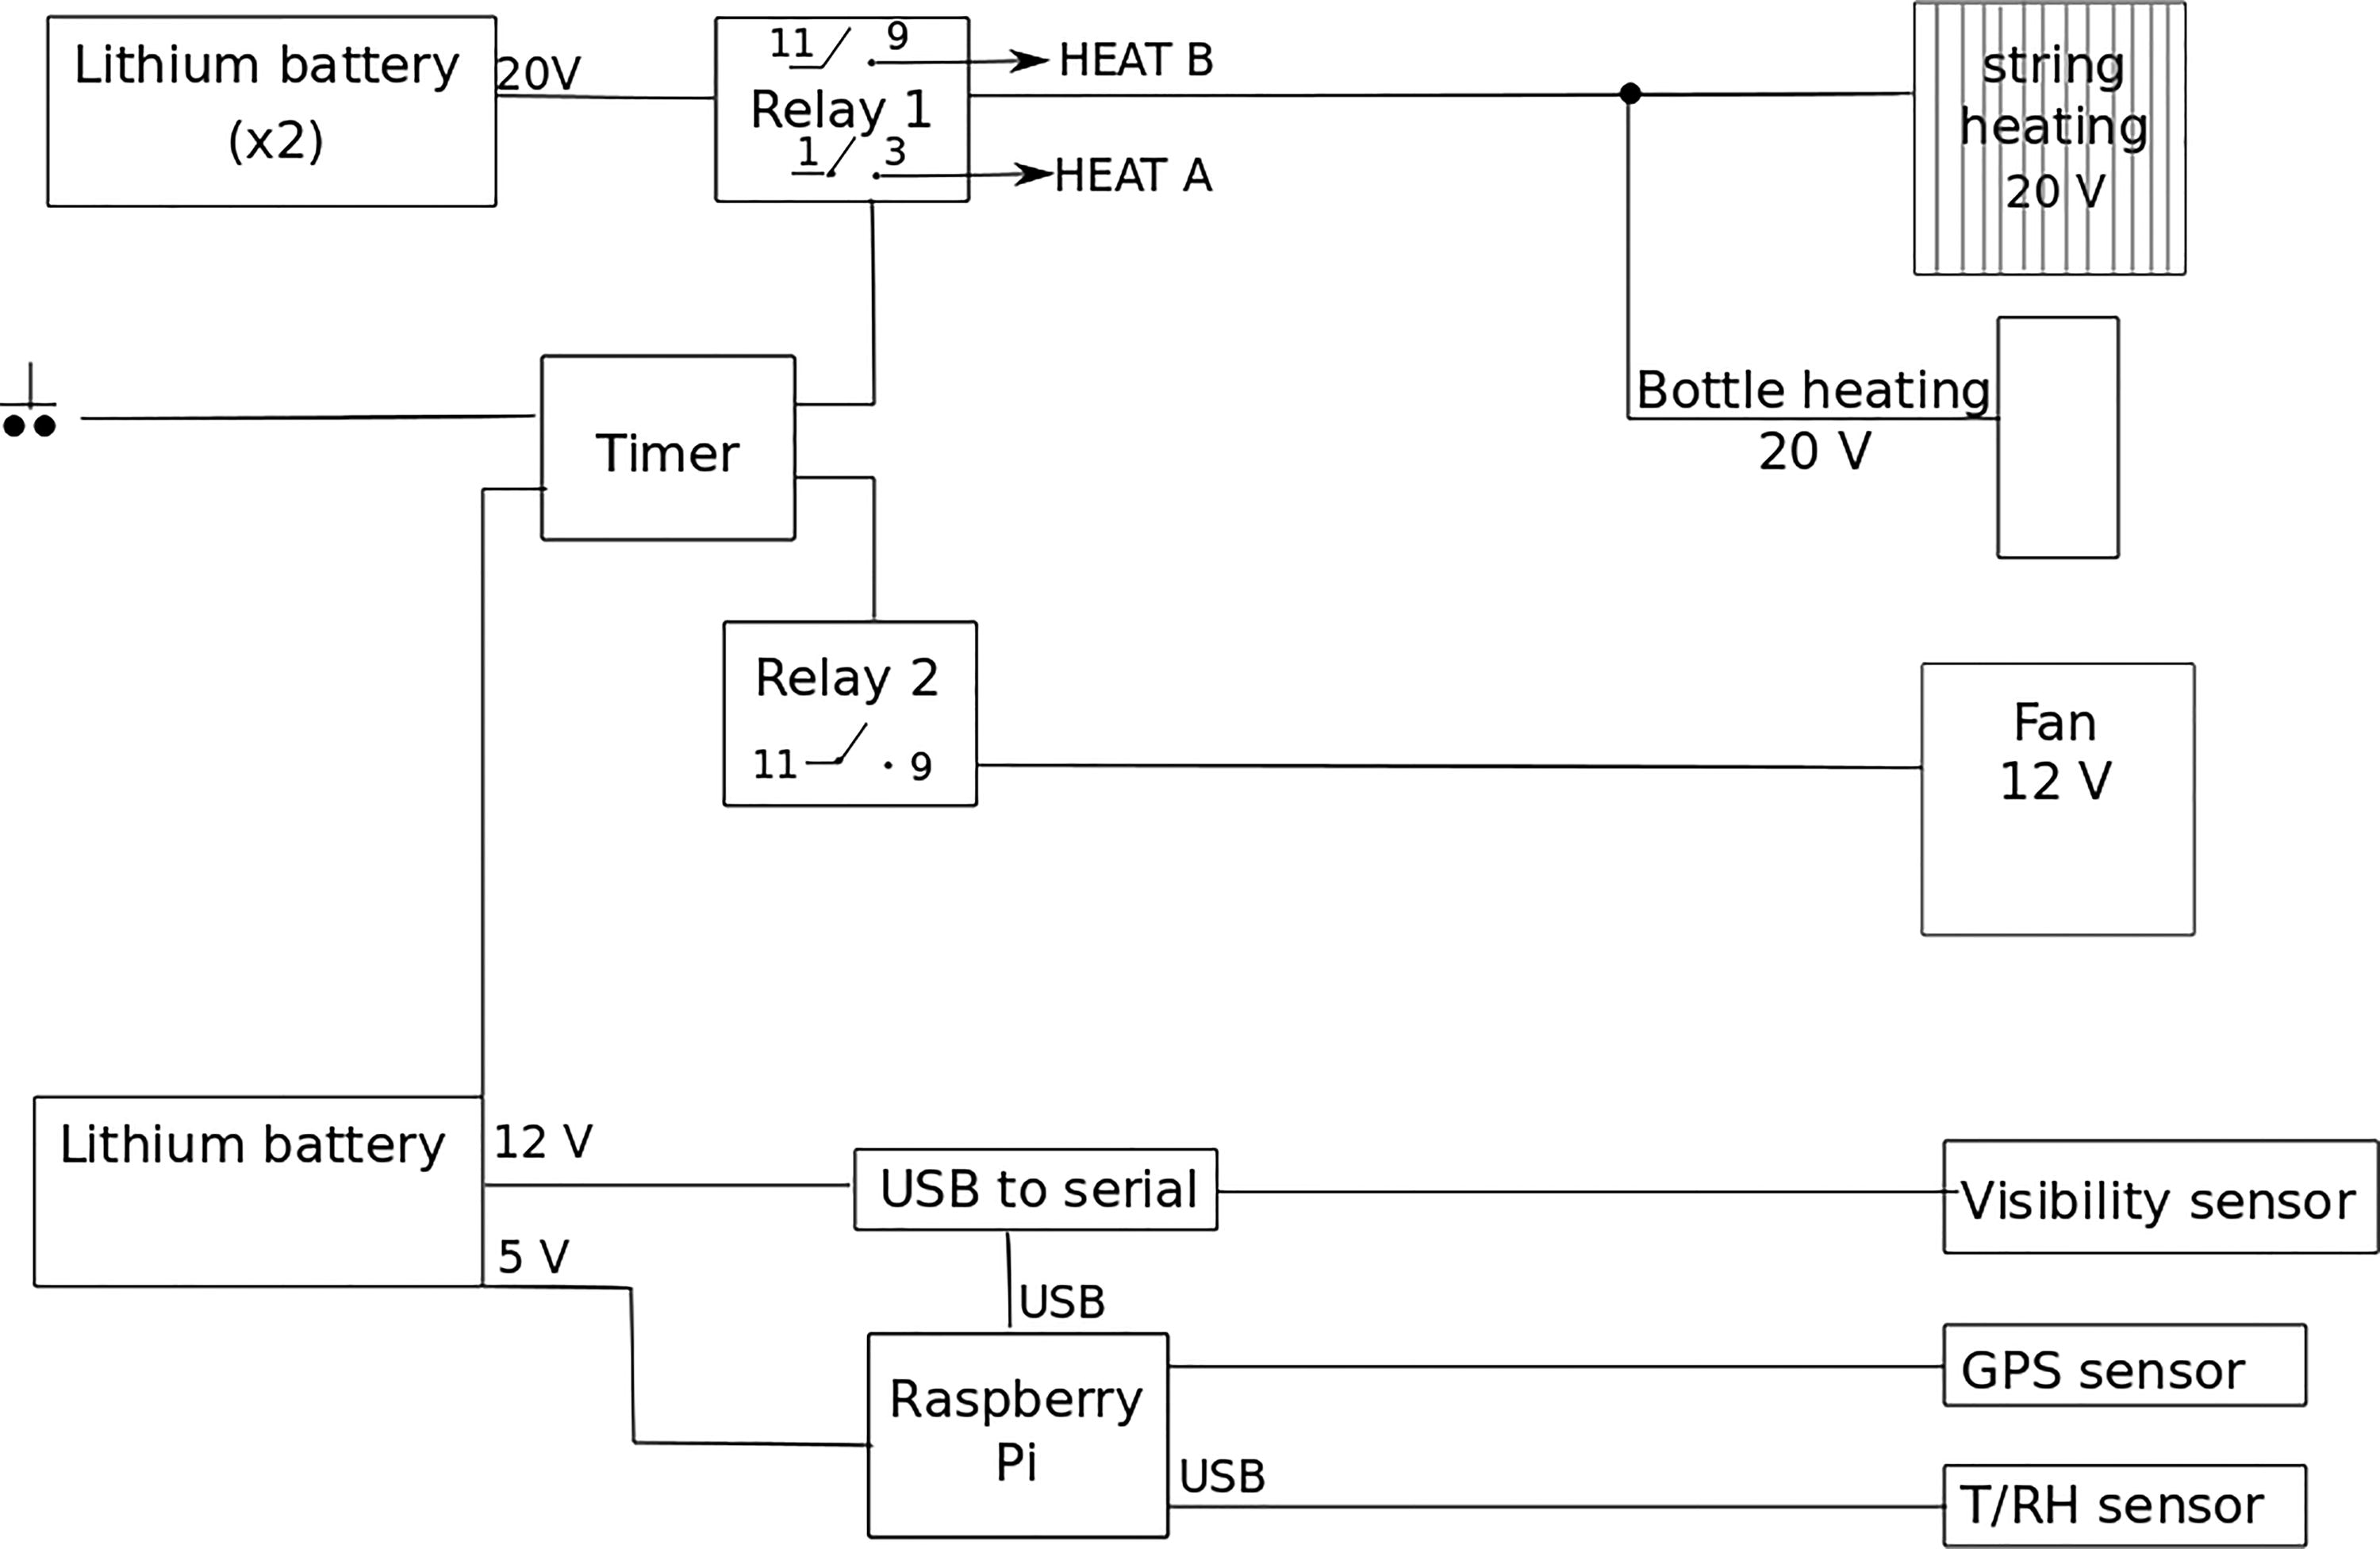
Fig. 2.
Schematic circuit diagram of the mini-CWS.
Table 1.
The operating and technical parameters of the miniaturised cloud water sampler (mini-CWS) compared to those of the CASCC2 and the CHRCC.
Table 2.
Cleaning procedures for mini-CWS and corresponding handling blanks.
strings irradiated under UV (20 min each side); strings and funnel in ultrasonic bath of MQ water;
MQ water sampled from spray bottleRespective procedure for sample collected on 11 September
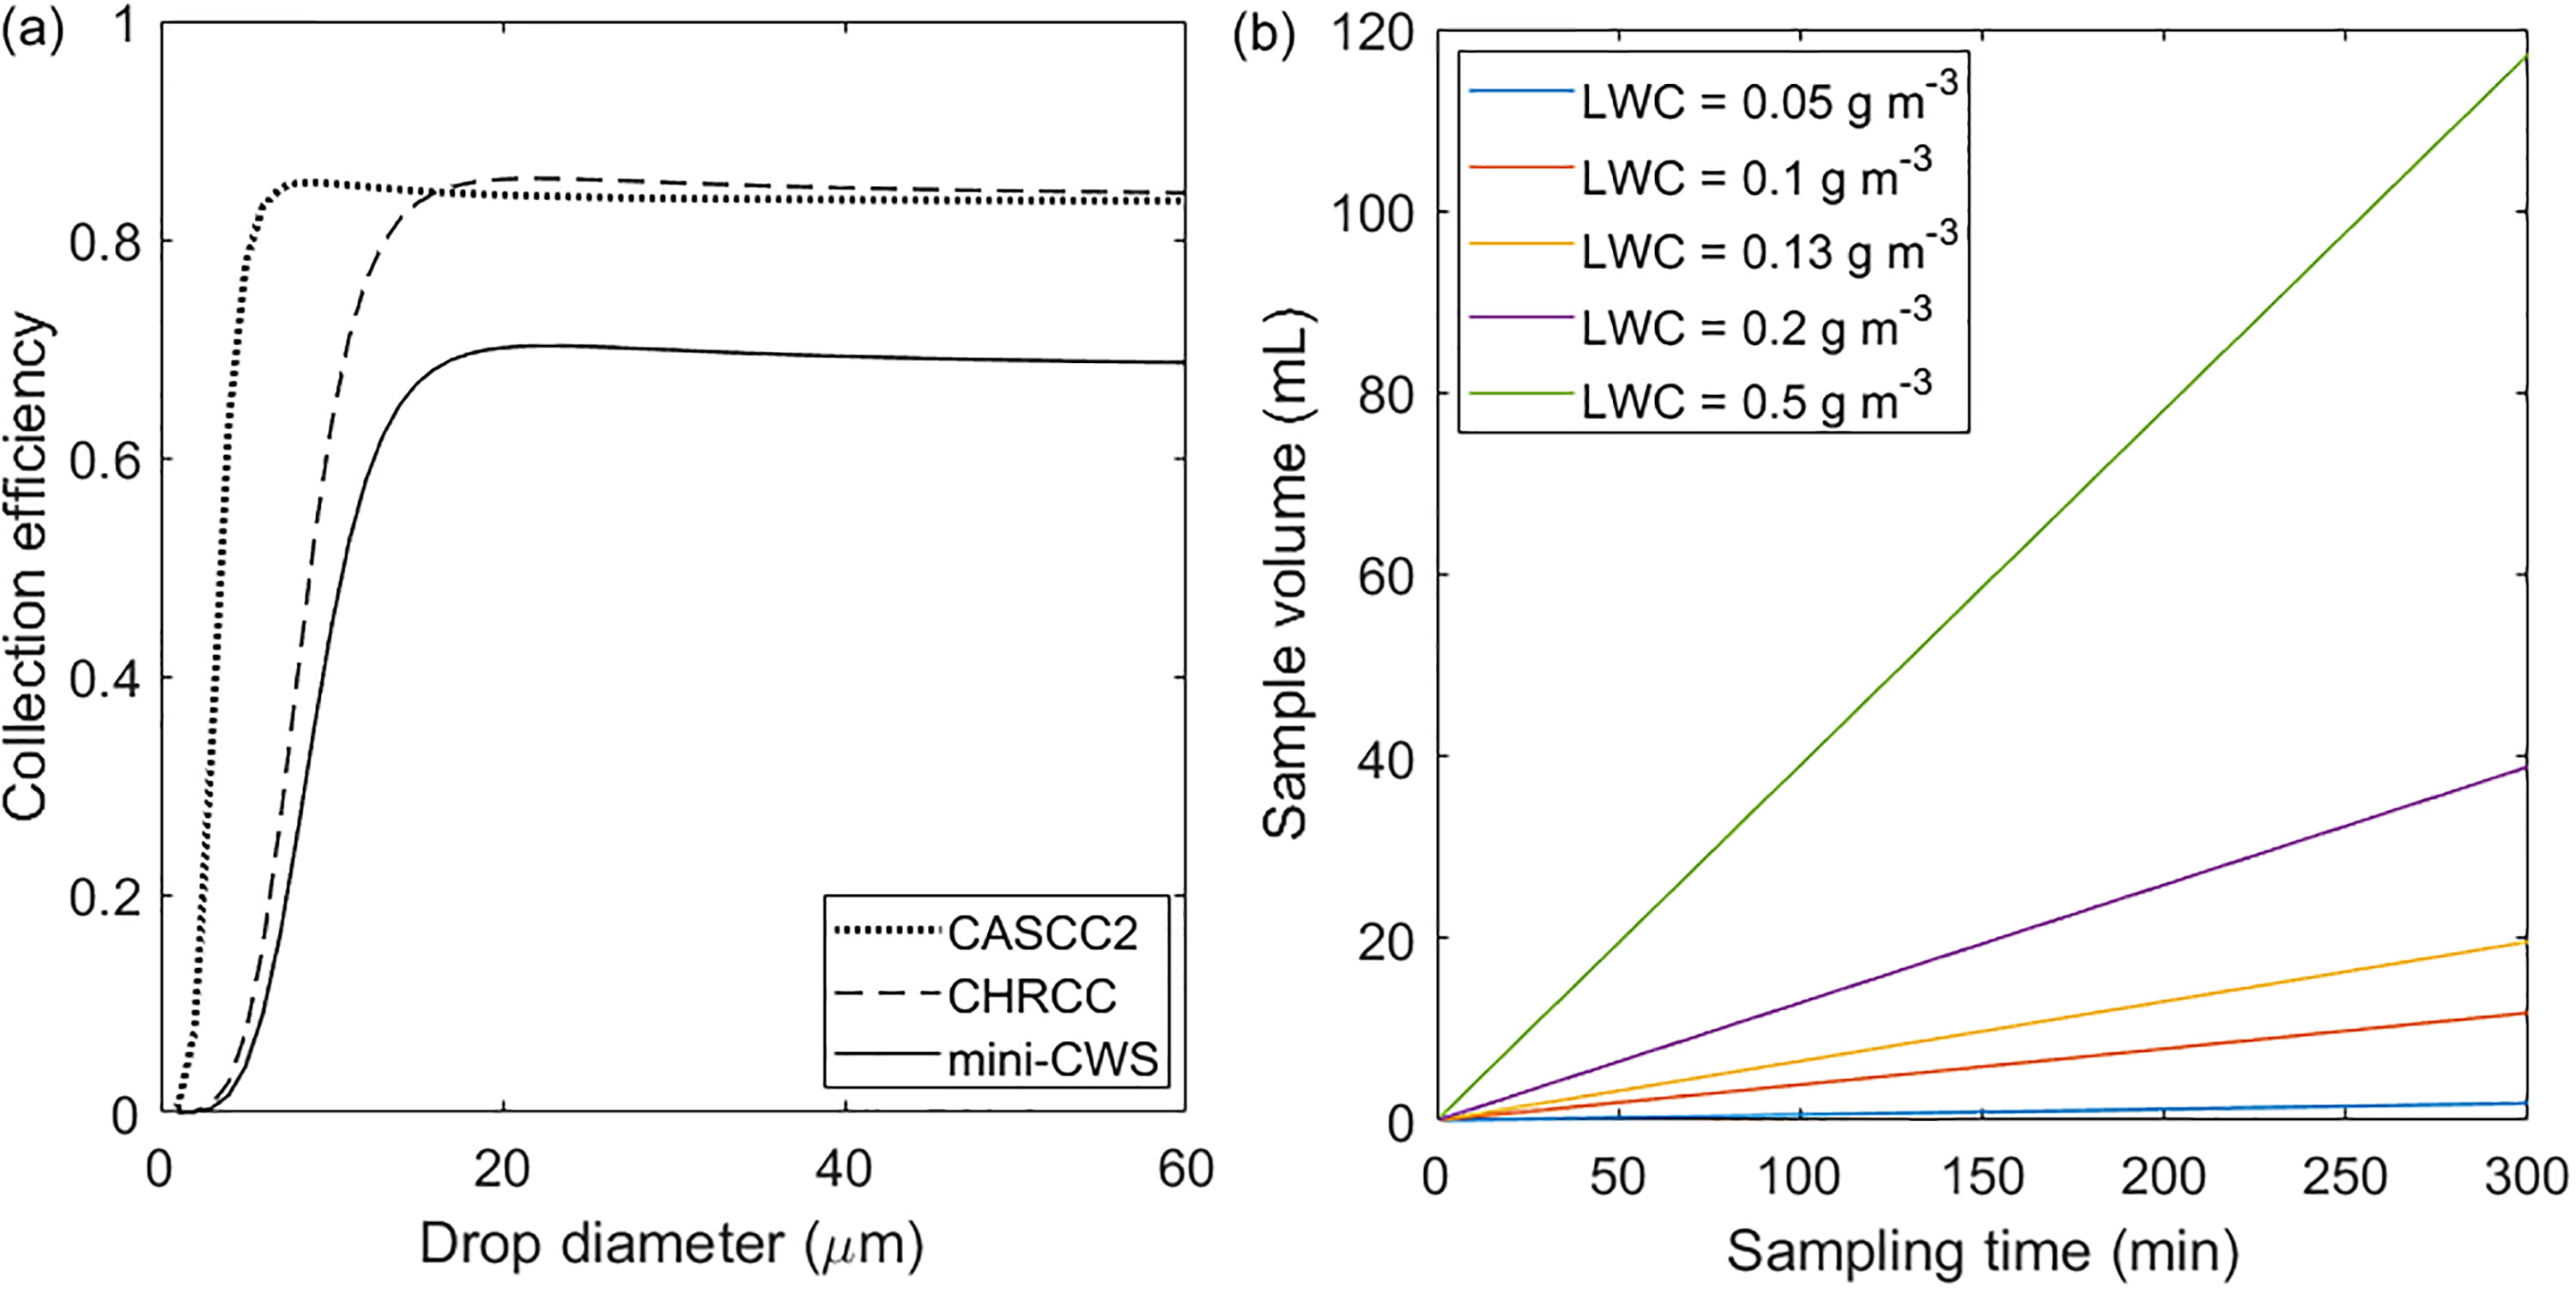
Fig. 3.
(a) Theoretical collection efficiency of the mini-CWS compared to the CASCC2 and CHRCC (Demoz et al., 1996) based on their respective sampling velocities (1.4 m s−1 for the mini-CWS and 8.6 m s−1 for the CASCC2 and CHRCC) and (b) estimated sample volume for the mini-CWS for different LWCs.
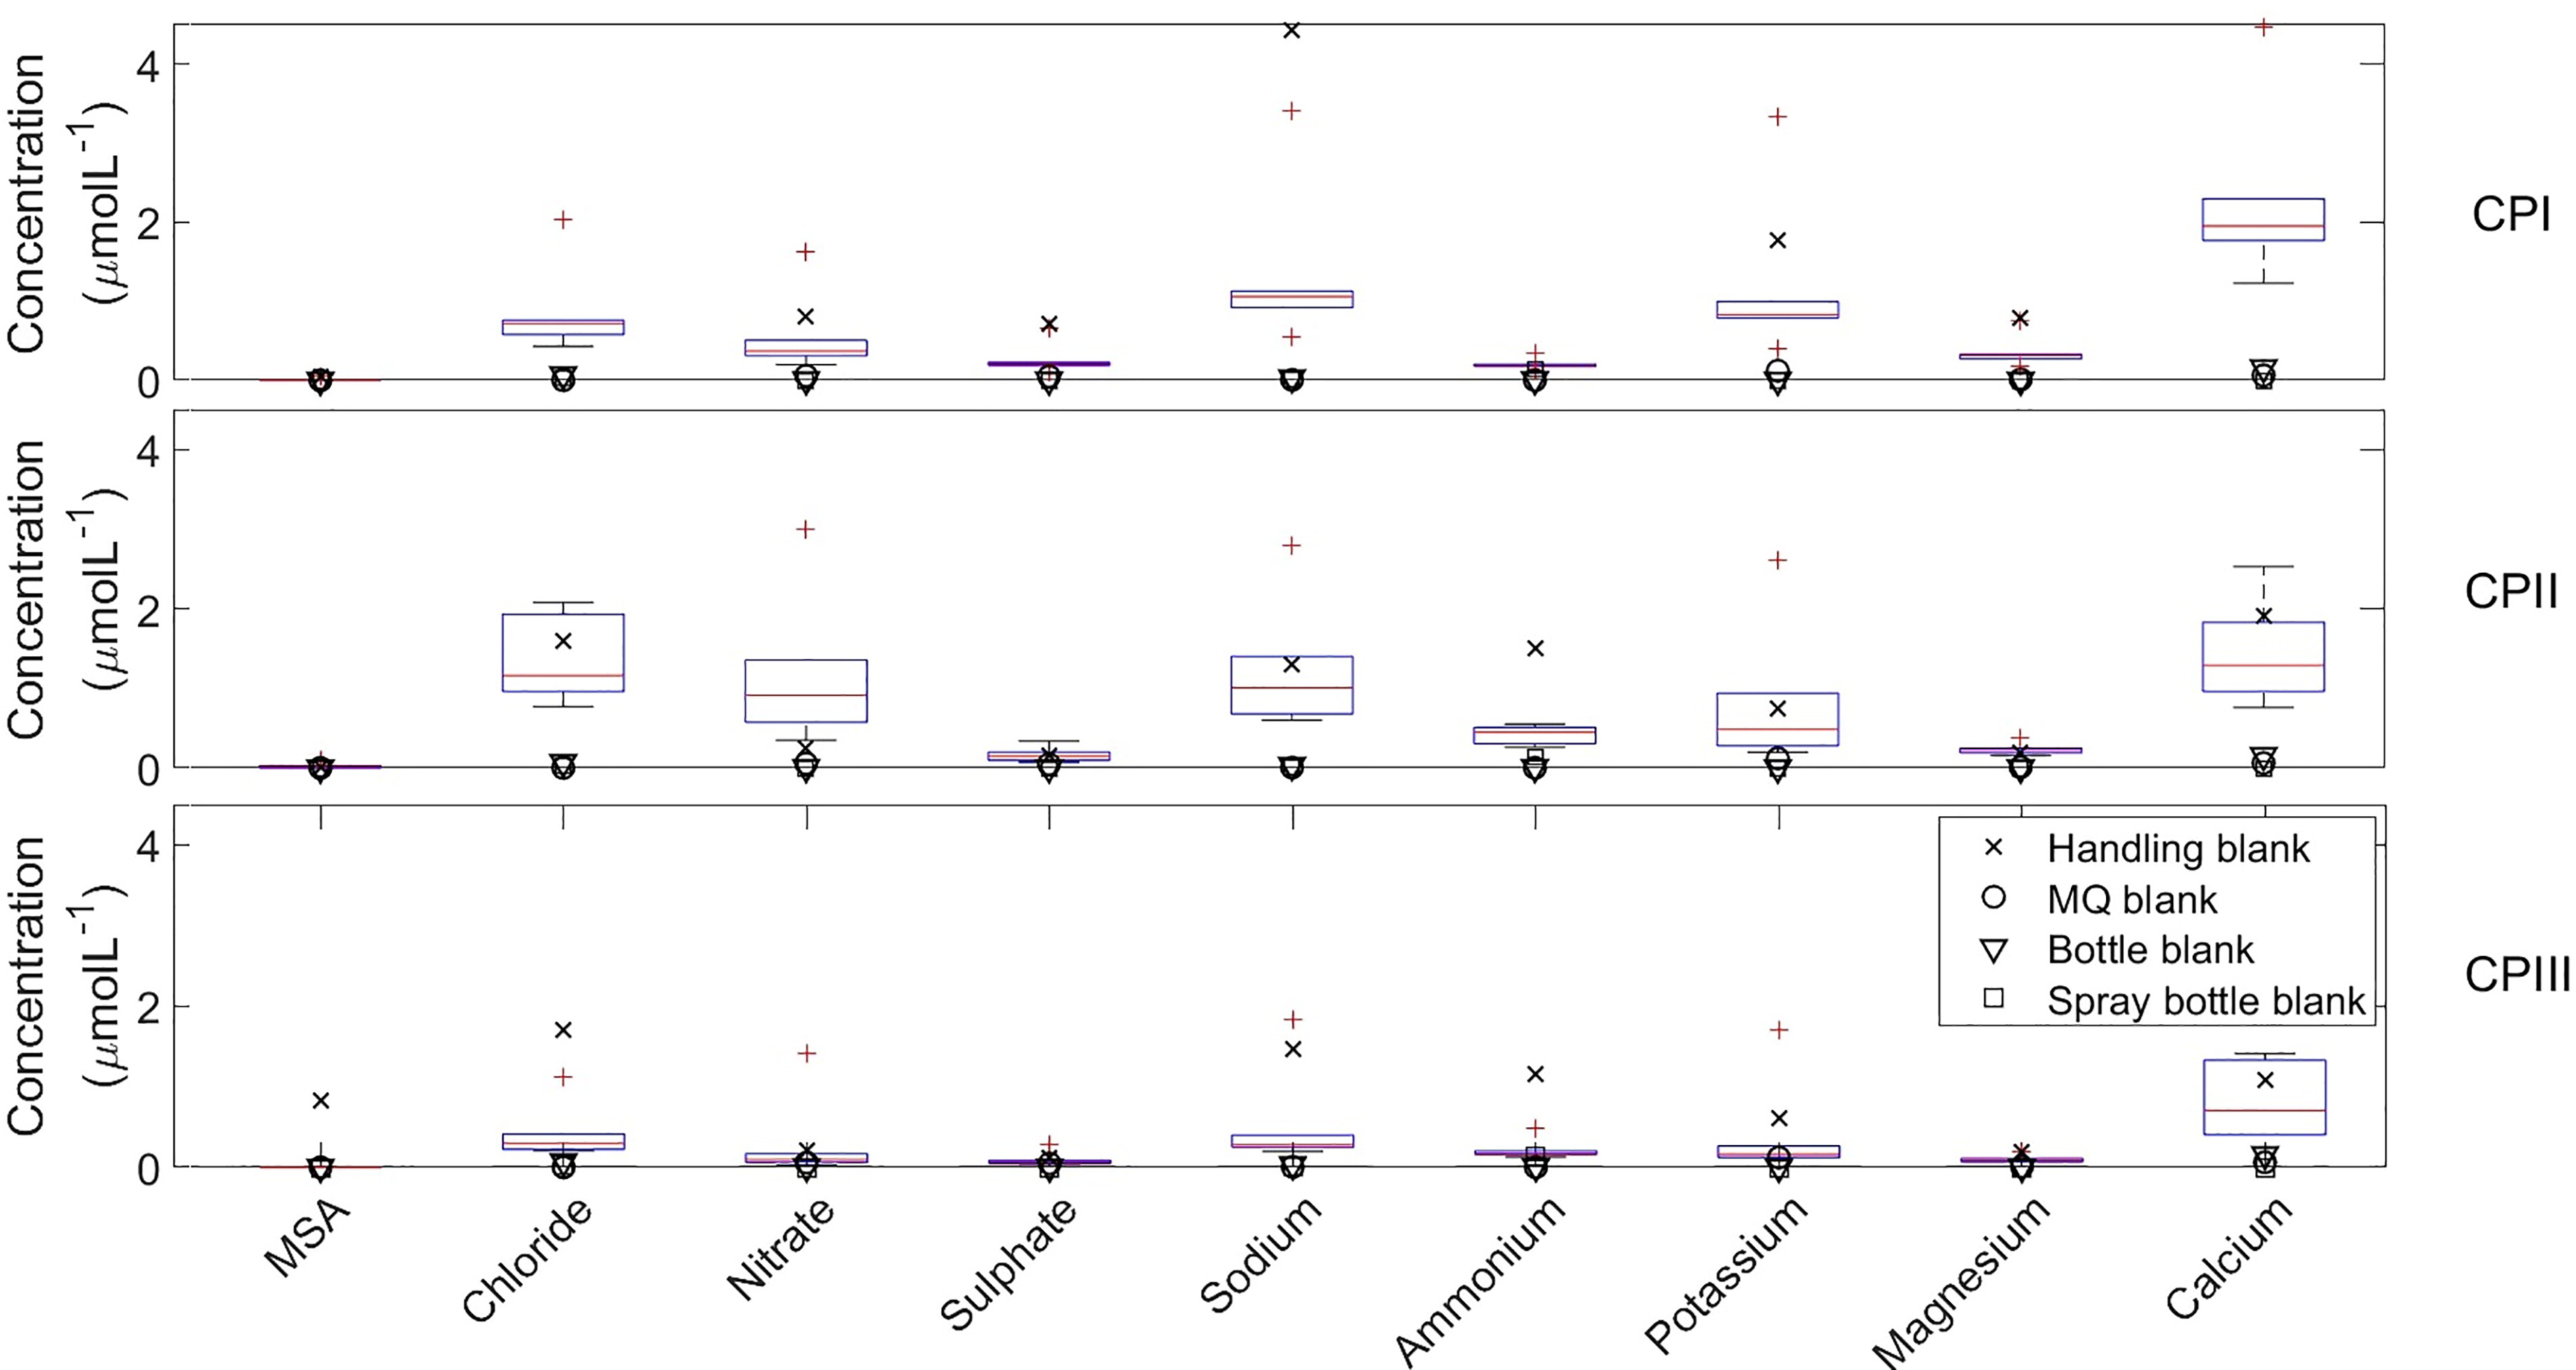
Fig. 4.
Comparison of instrumental and handling blanks. Boxplot of instrumental blanks for the different cleaning procedures compared to the concentrations in the handling blanks (black crosses). Red crosses are outliers of the instrumental blanks.
Table 3.
Concentrations of inorganic ions in the collected cloud water samples, handling blanks for different cleaning procedures (CP) that were taken during the expedition as well as mean concentrations in the reproduced (instrumental) blanks that were taken after the campaign, sampling bottle blanks, MQ blanks and a spray bottle blank. Furthermore, sample concentrations are compared to their respective handling blanks. N denotes the number of samples analysed.
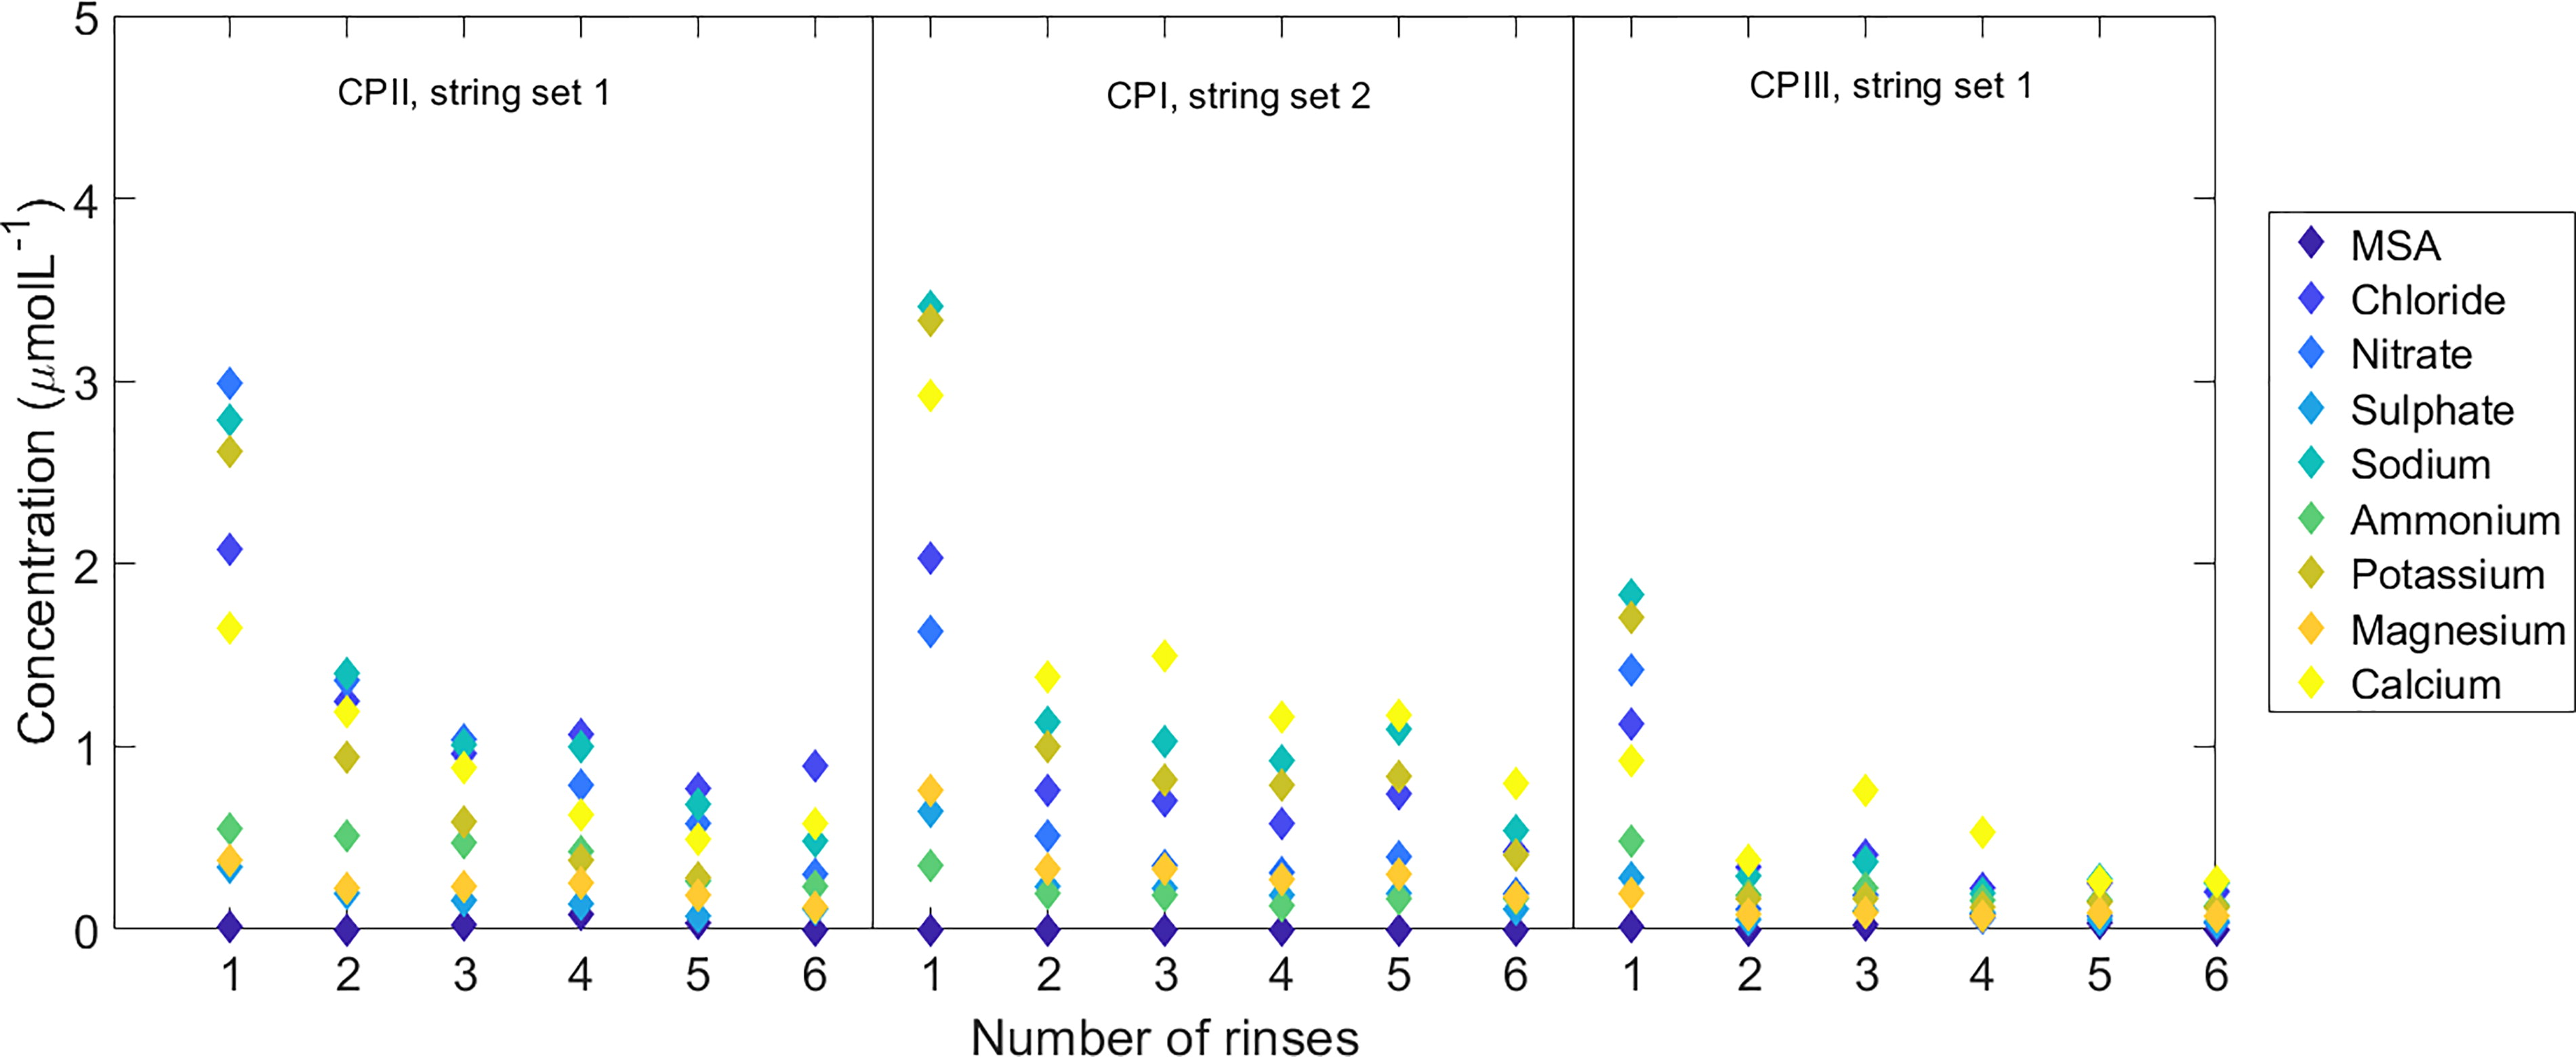
Fig. 5.
Concentrations in post-cruise instrumental blanks for all cleaning procedures (CP) in dependence on the number of rinses.
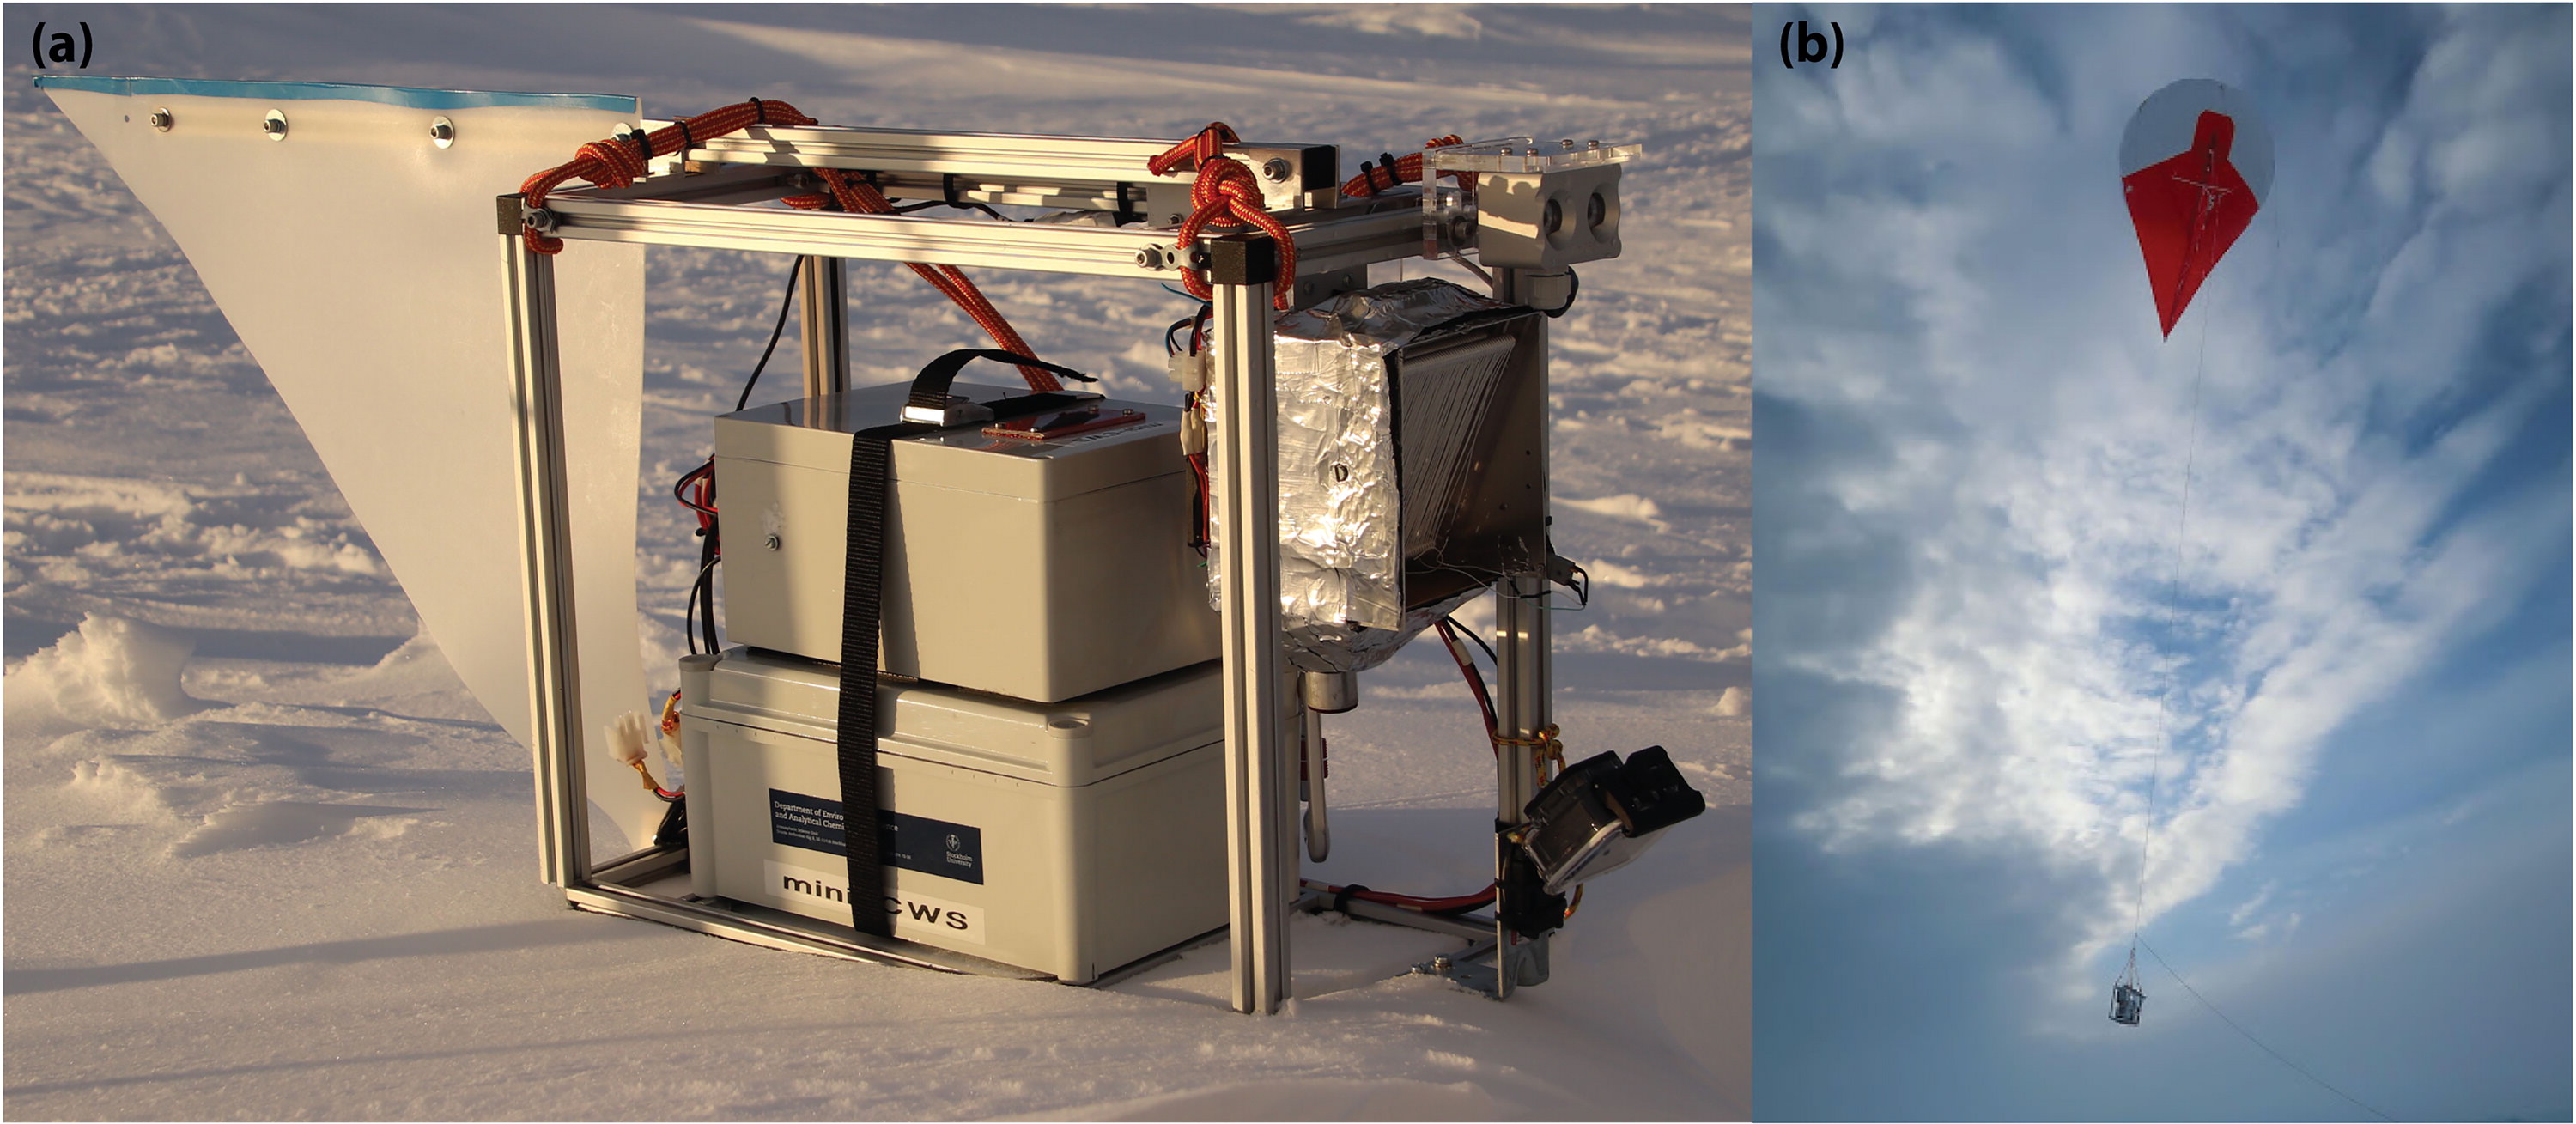
Fig. 6.
Photo of (a) the instrument and (b) during the deployment on a tethered balloon in the high Arctic during the MOCCHA campaign.
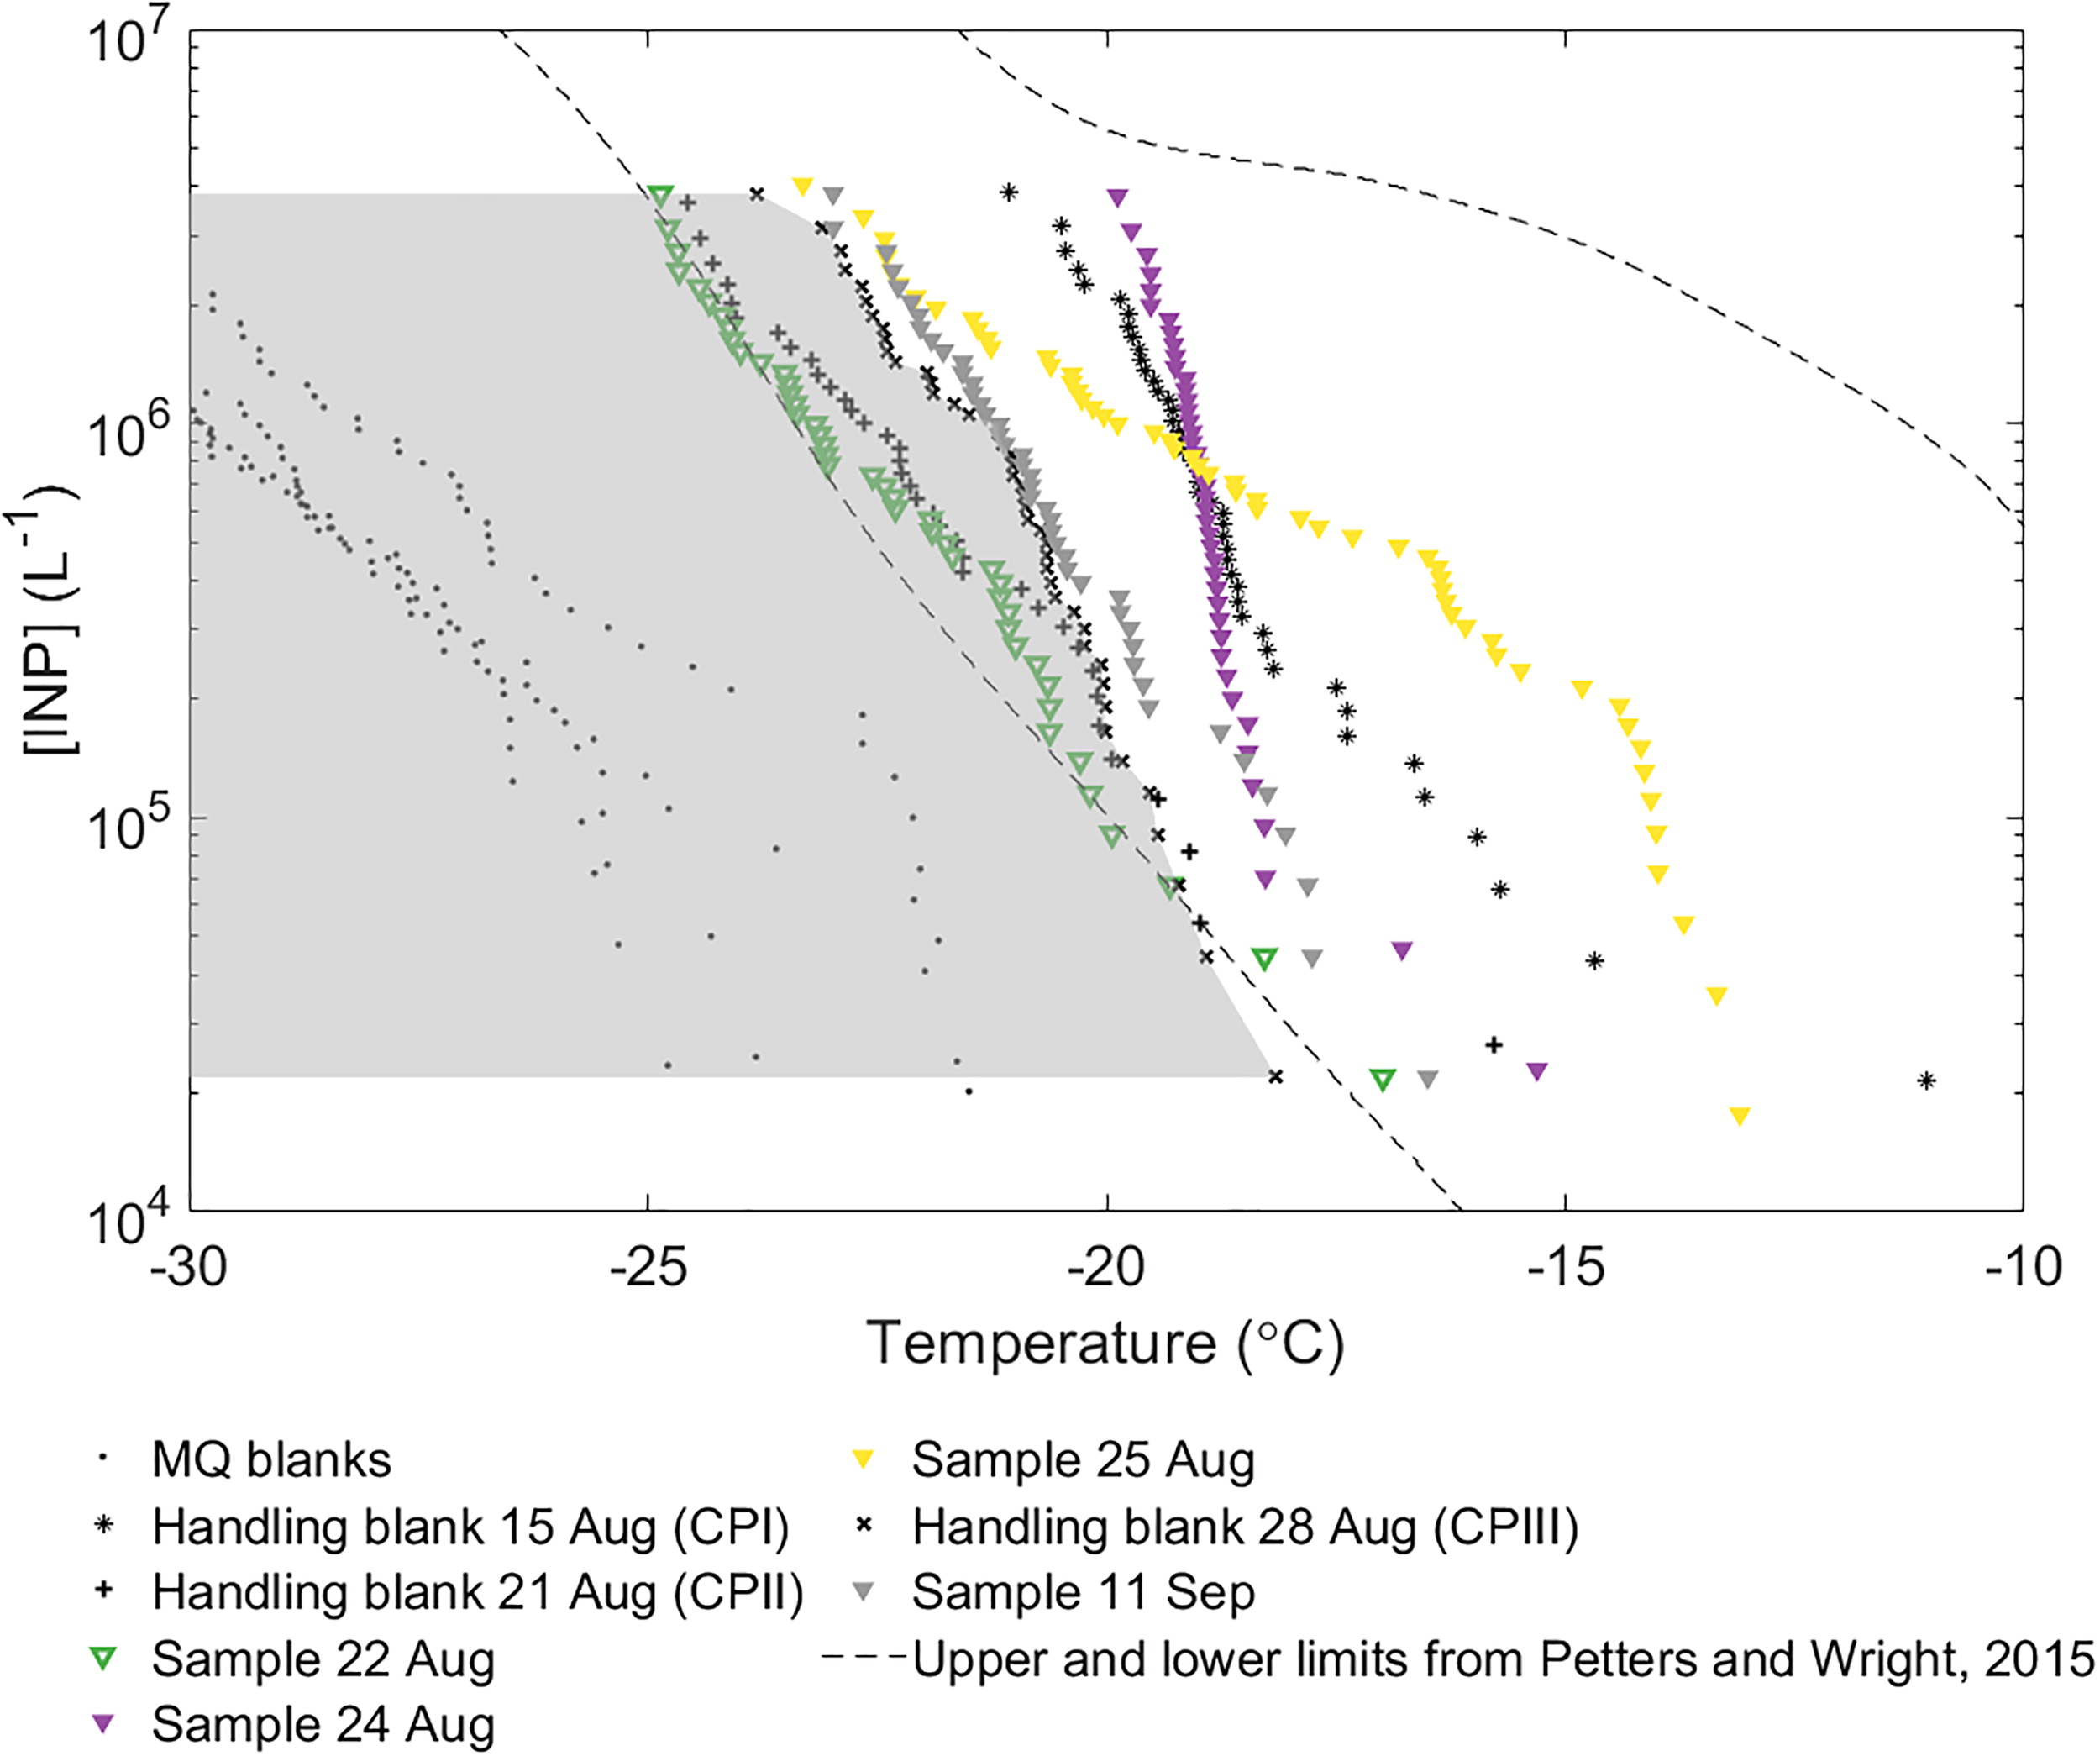
Fig. 7.
Ice nucleating particle (INP) concentrations per litre of cloud water for collected samples, MQ blanks and handling blanks. The temperature denotes the freezing temperature of the individual droplets in the array of the INP analysis. The shaded area marks samples that fall below the baseline as set by the handling blanks, while the dashed lines show the upper and lower limits by Petters and Wright (2015). These samples are displayed with non-filled symbols and should be regarded as limiting values since they can not be discerned from the baseline.