
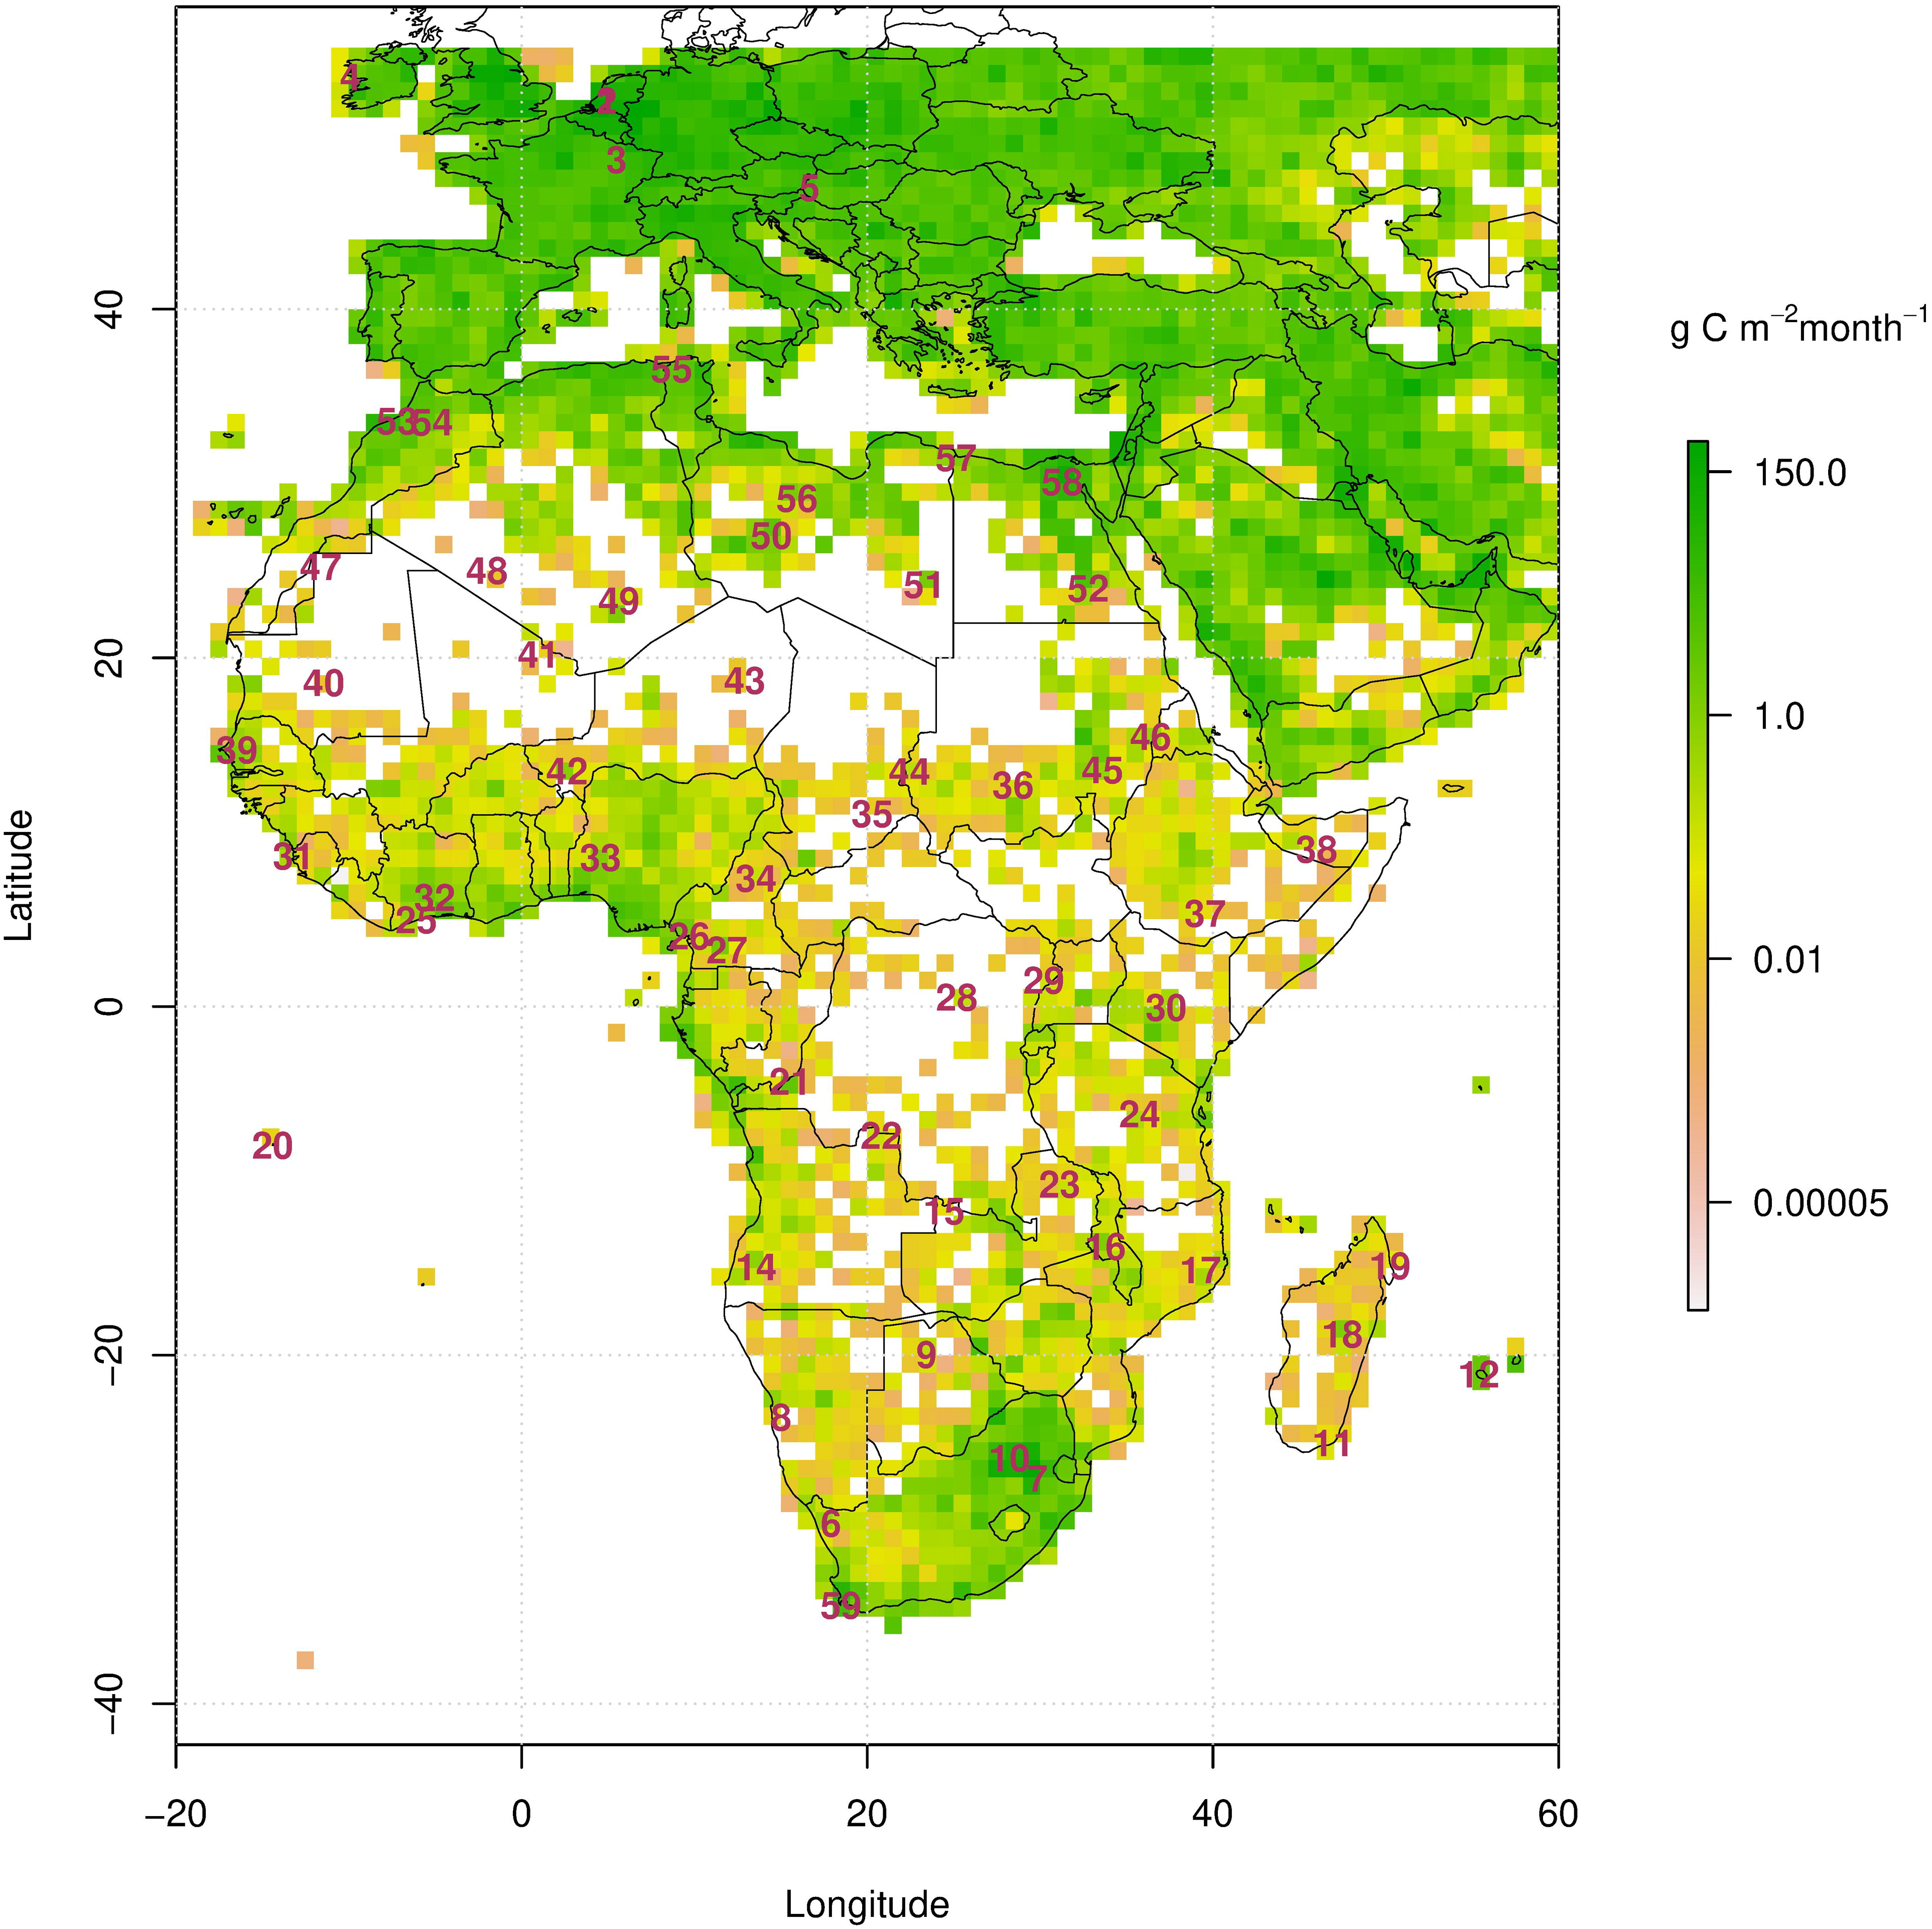
Fig. 1.
The 51 potential locations of the new stations in the optimal network design and the mean fossil fuel emissions from the ODIAC product regridded onto the in g C m−2 month−1 for the year 2012. Uncertainty estimates were set at 100% of the estimated net primary productivity flux estimates. The candidate site locations were based on existing infrastructure where possible. The existing Cape Point (South Africa), Cabauw20 (The Netherlands), Cabauw200, Mace Head (Ireland), OPE (France), Hungary, Lamto (Ivory Coast) and Ifrane (Morocco) stations are listed as 59, 1, 2, 3, 4, 5, 32, and 54. These were included in the base network.
Table 1.
A table of 51 candidate sites selected from existing observation networks and 8 established European (*) or African sites (**), making up the base network to which new sites will be added. Two imaginary sites were created in grid cells where no candidate sites were available (sites 38 (Algeria) and 48 (Somalia)).
Table 2.
Ranking of the new stations added to the base network for 4 three-month periods. The station with rank 1 achieved the highest uncertainty reduction in the total CO2 flux for Africa. The cumulative reduction in uncertainty relative to the base uncertainty is provided in brackets.
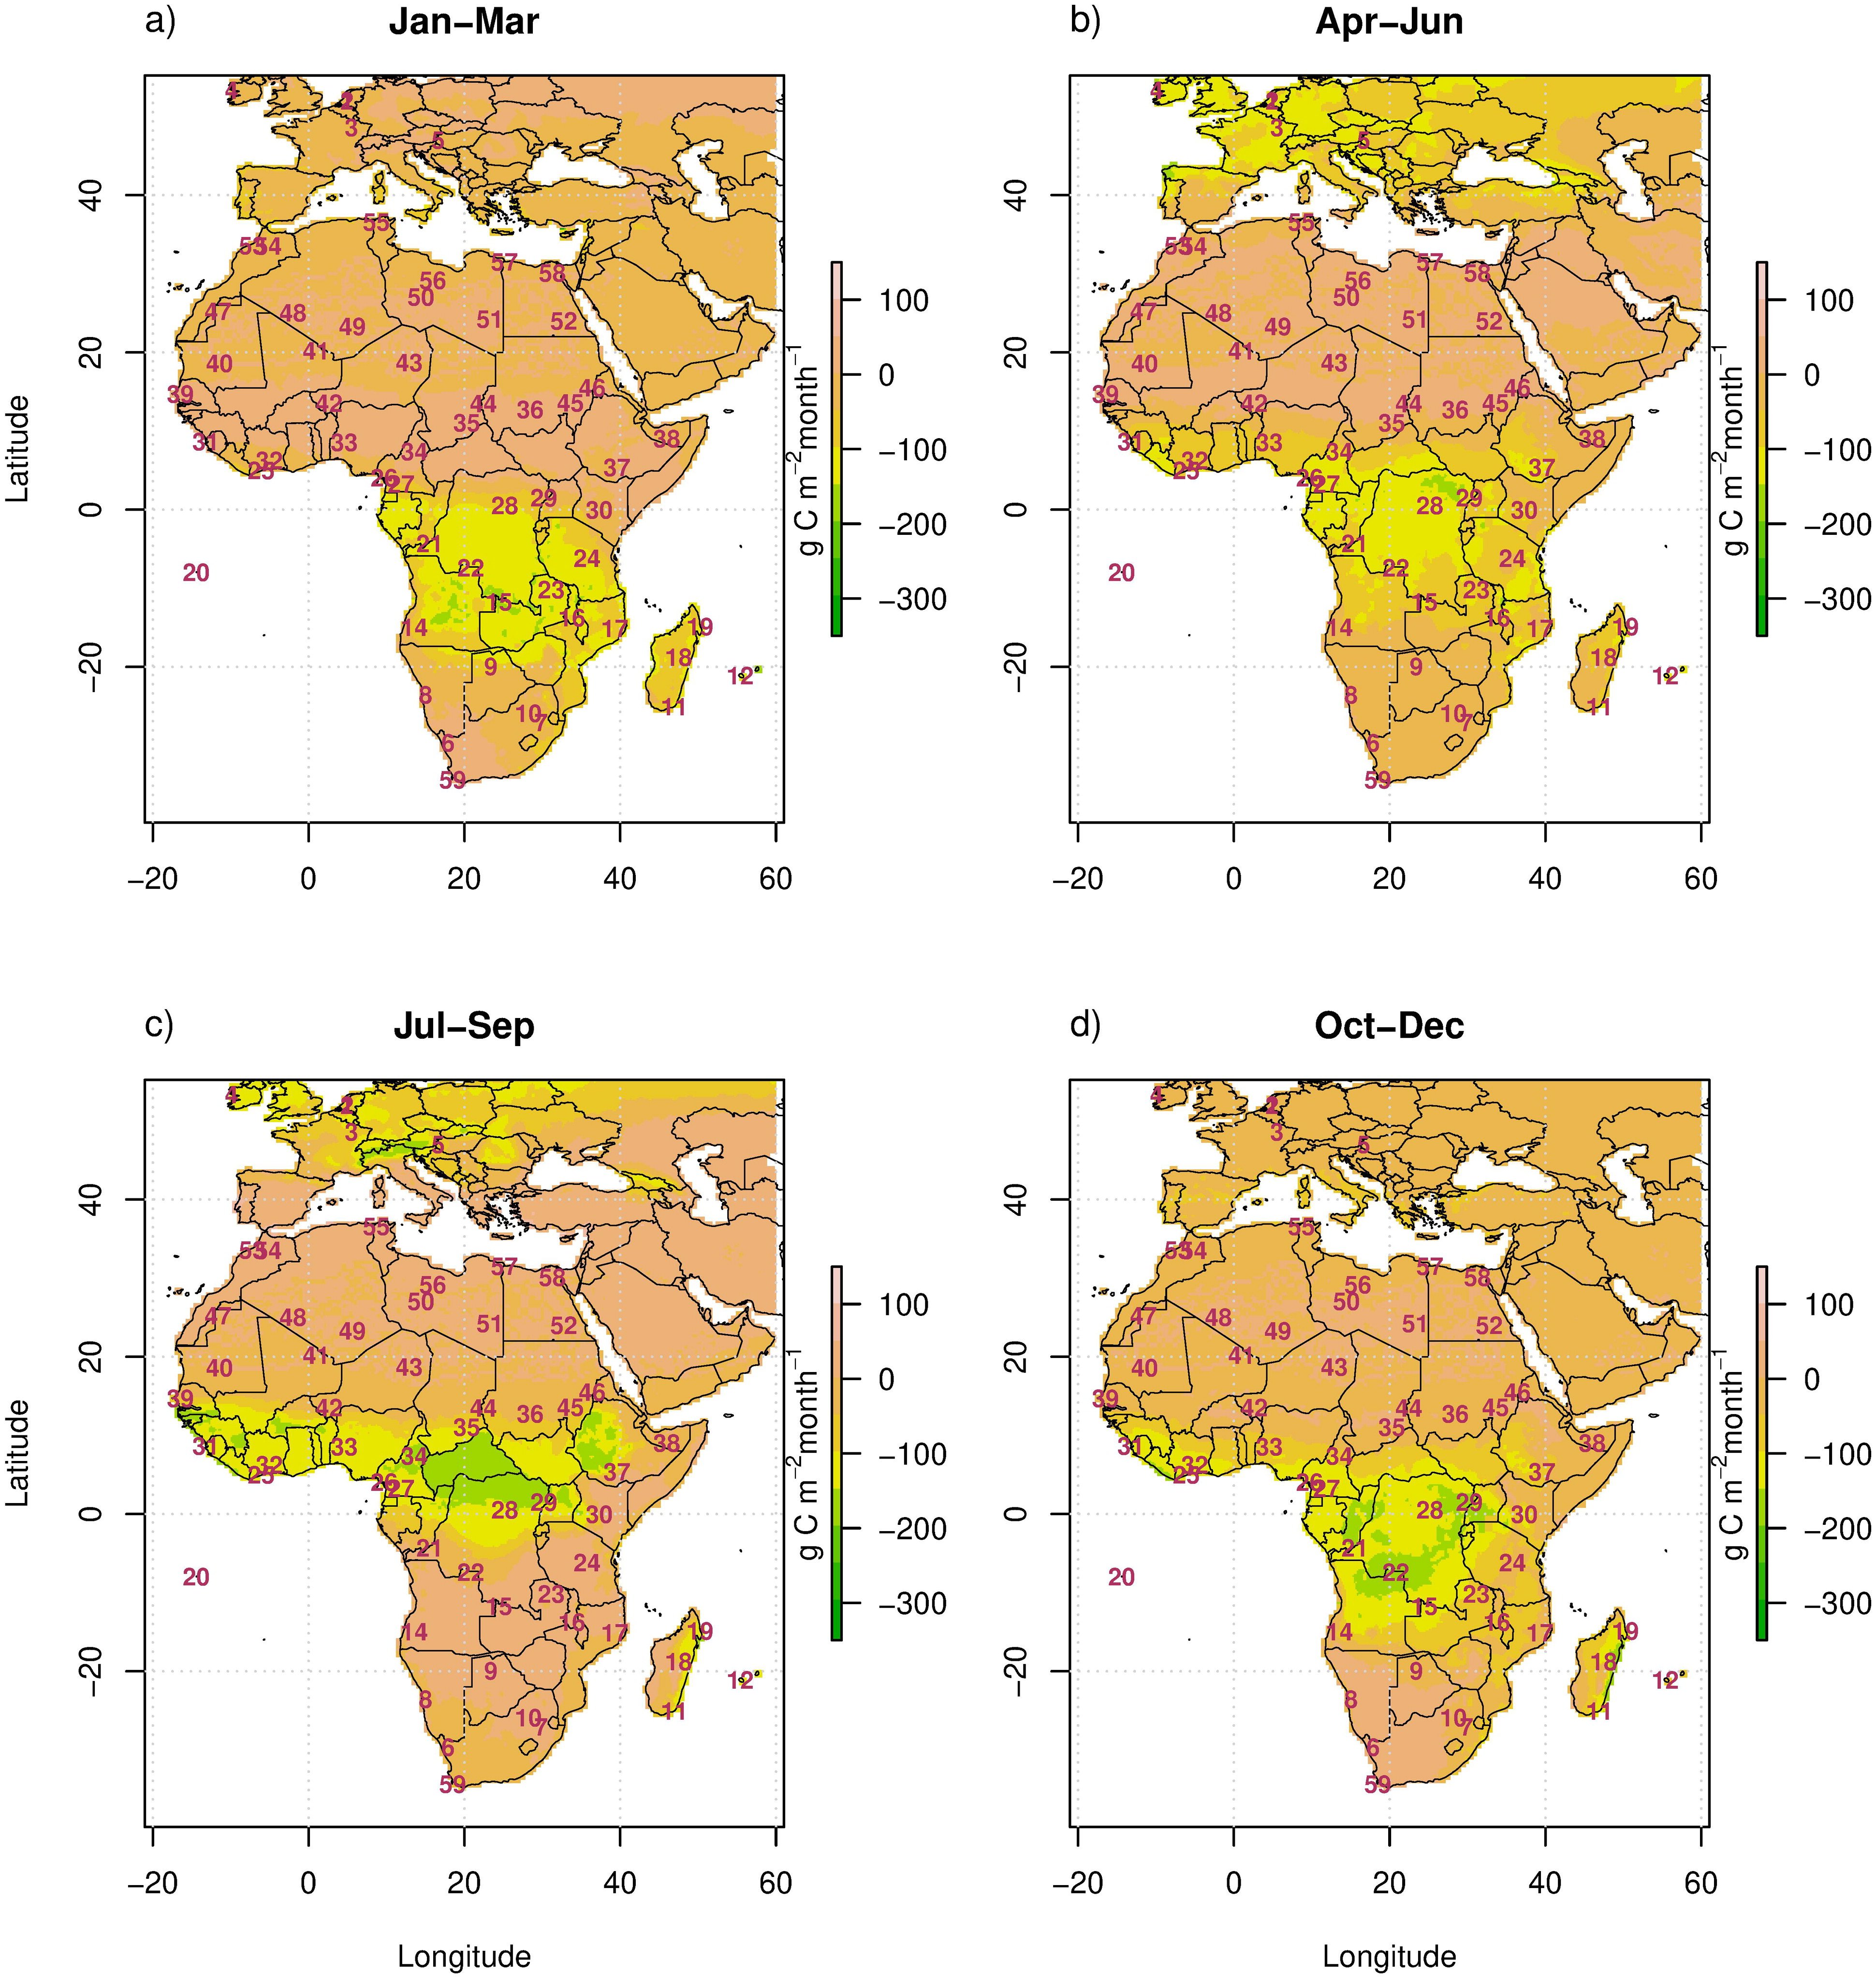
Fig. 2.
The mean net primary productivity (NPP) for the periods (a) January to March, (b) April to June, (c) July to August, and (d) September to December 2012. The uncertainty in net ecosystem exchange was set at 100% of the absolute NPP fluxes at the resolution of 0.2º expressed in g C m−2 month−1. NPP as estimated by the digital global vegetation model LPJ (Lund-Potsdam-Jena) S2 (CO2 and climate [time-invariant present-day land use mask]).
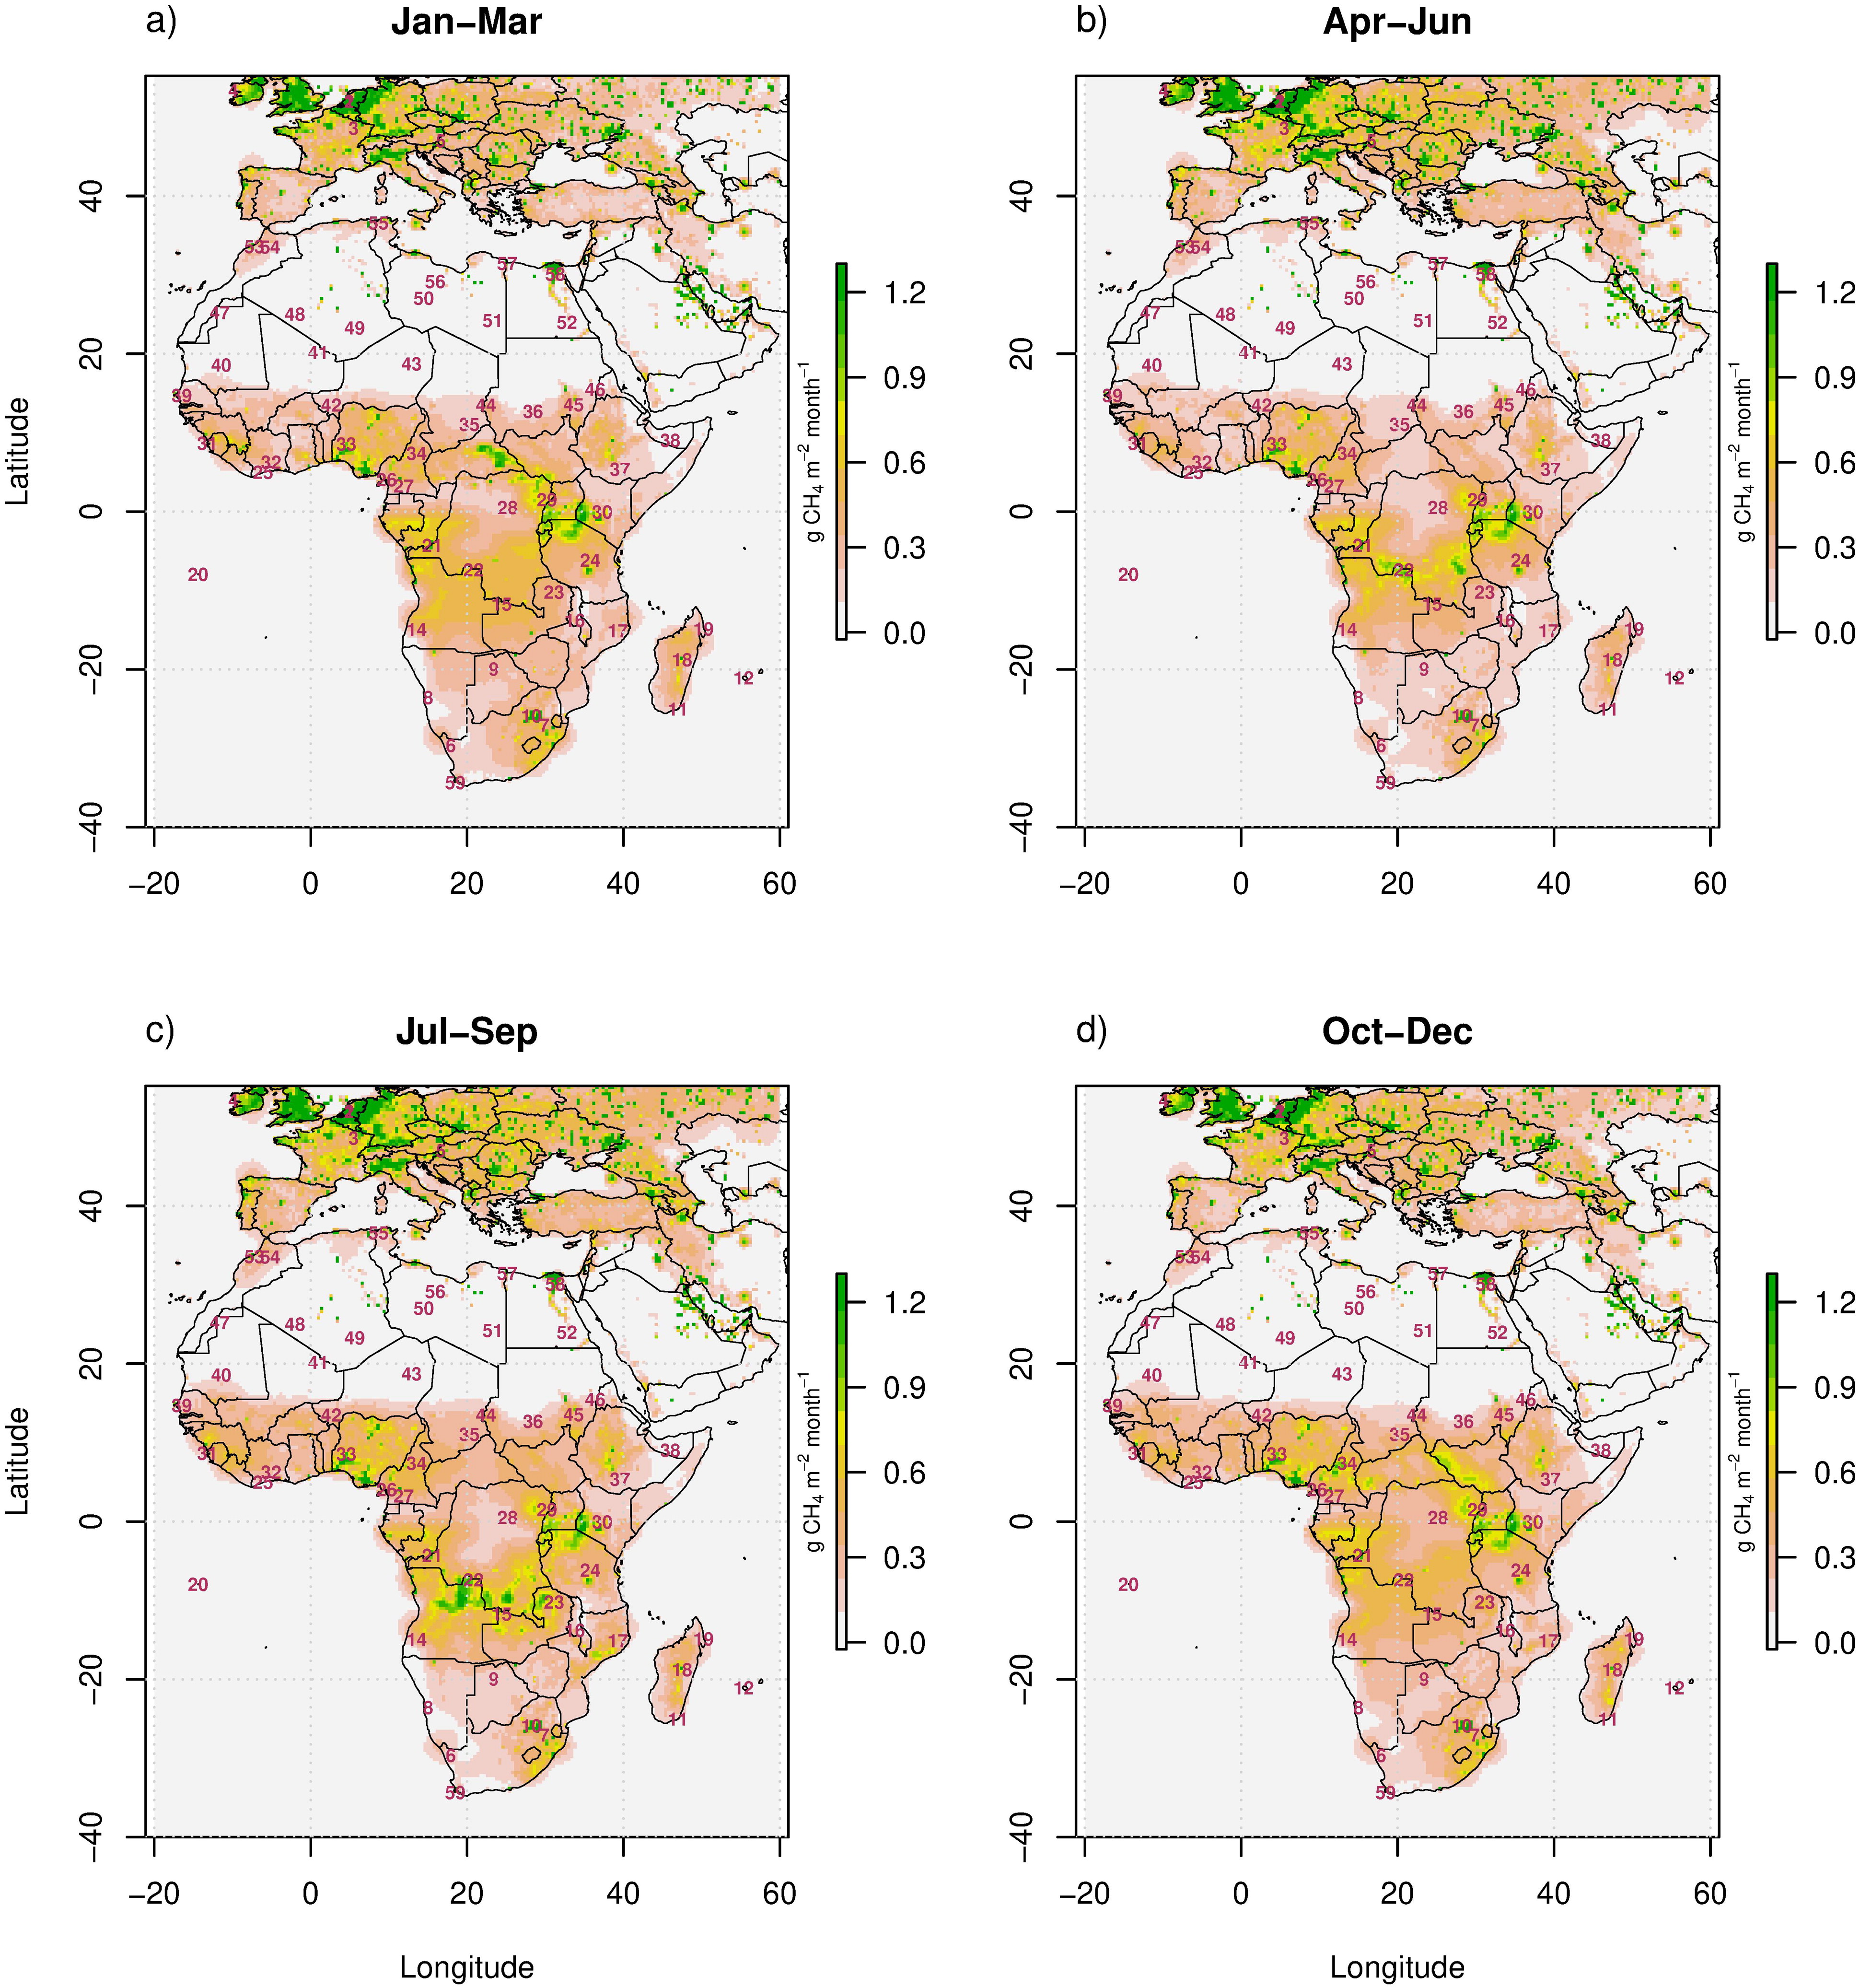
Fig. 3.
The prior CH4 fluxes at the resolution of 0.4º expressed in g CH4 m−2 month−1 for periods January to March, April to May, June to August, and September to December 2012. Anthropogenic emissions from EDGAR v4.3.2 (Janssens-Maenhout et al., 2012), wetland and rice emissions from Bloom et al. (2012), and other natural emissions, including the soil sink negative flux, volcanoes and emissions from termites from Fung et al. (1991).
Table 4.
Ranking of the new stations added to the base network for 4 three-month periods. The station with rank 1 achieved the highest uncertainty reduction in the total N2O flux for Africa. The cumulative reduction in uncertainty relative to the base un-certainty is provided in brackets.
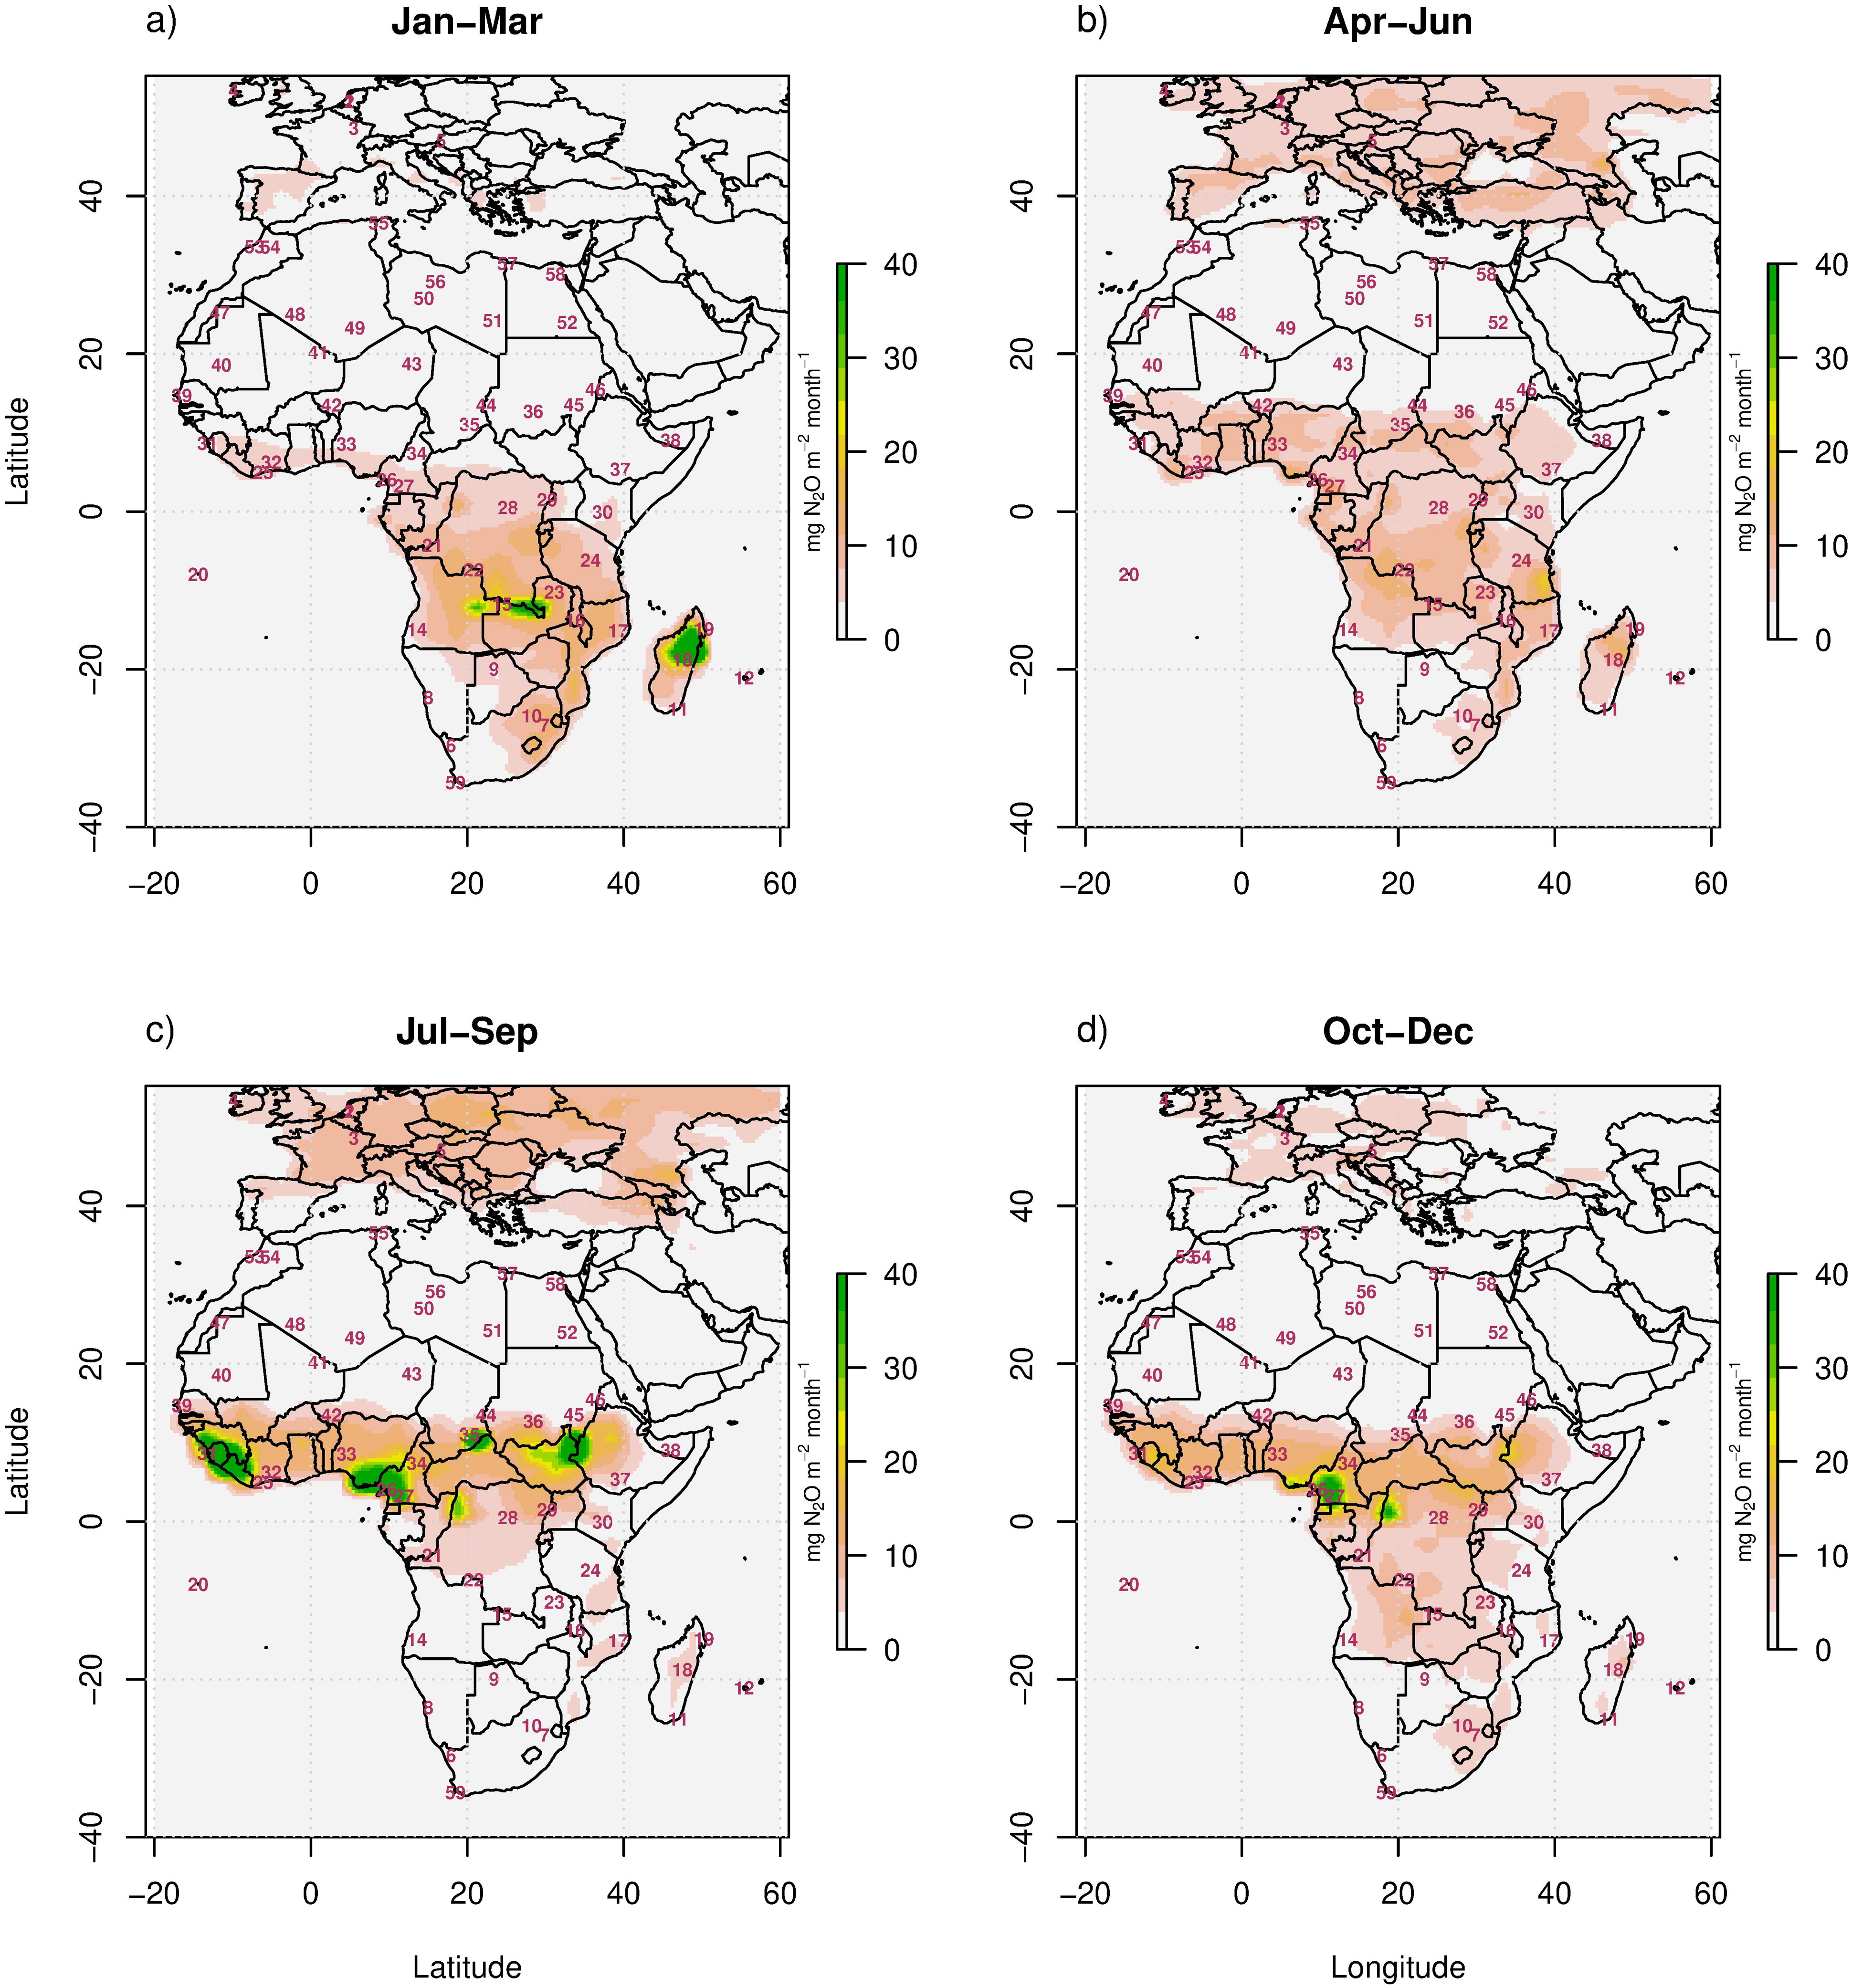
Fig. 4.
The prior N2O fluxes at the resolution of 0.4º expressed in mg N2O m−2 month−1 for periods (a) January to March, (b) April to May, (c) June to August, and (d) September to December 2012. Anthropogenic emissions from EDGAR v4.3.2 and natural emissions from soils were derived from emissions reported for 2008 in Saikawa et al. (2013).
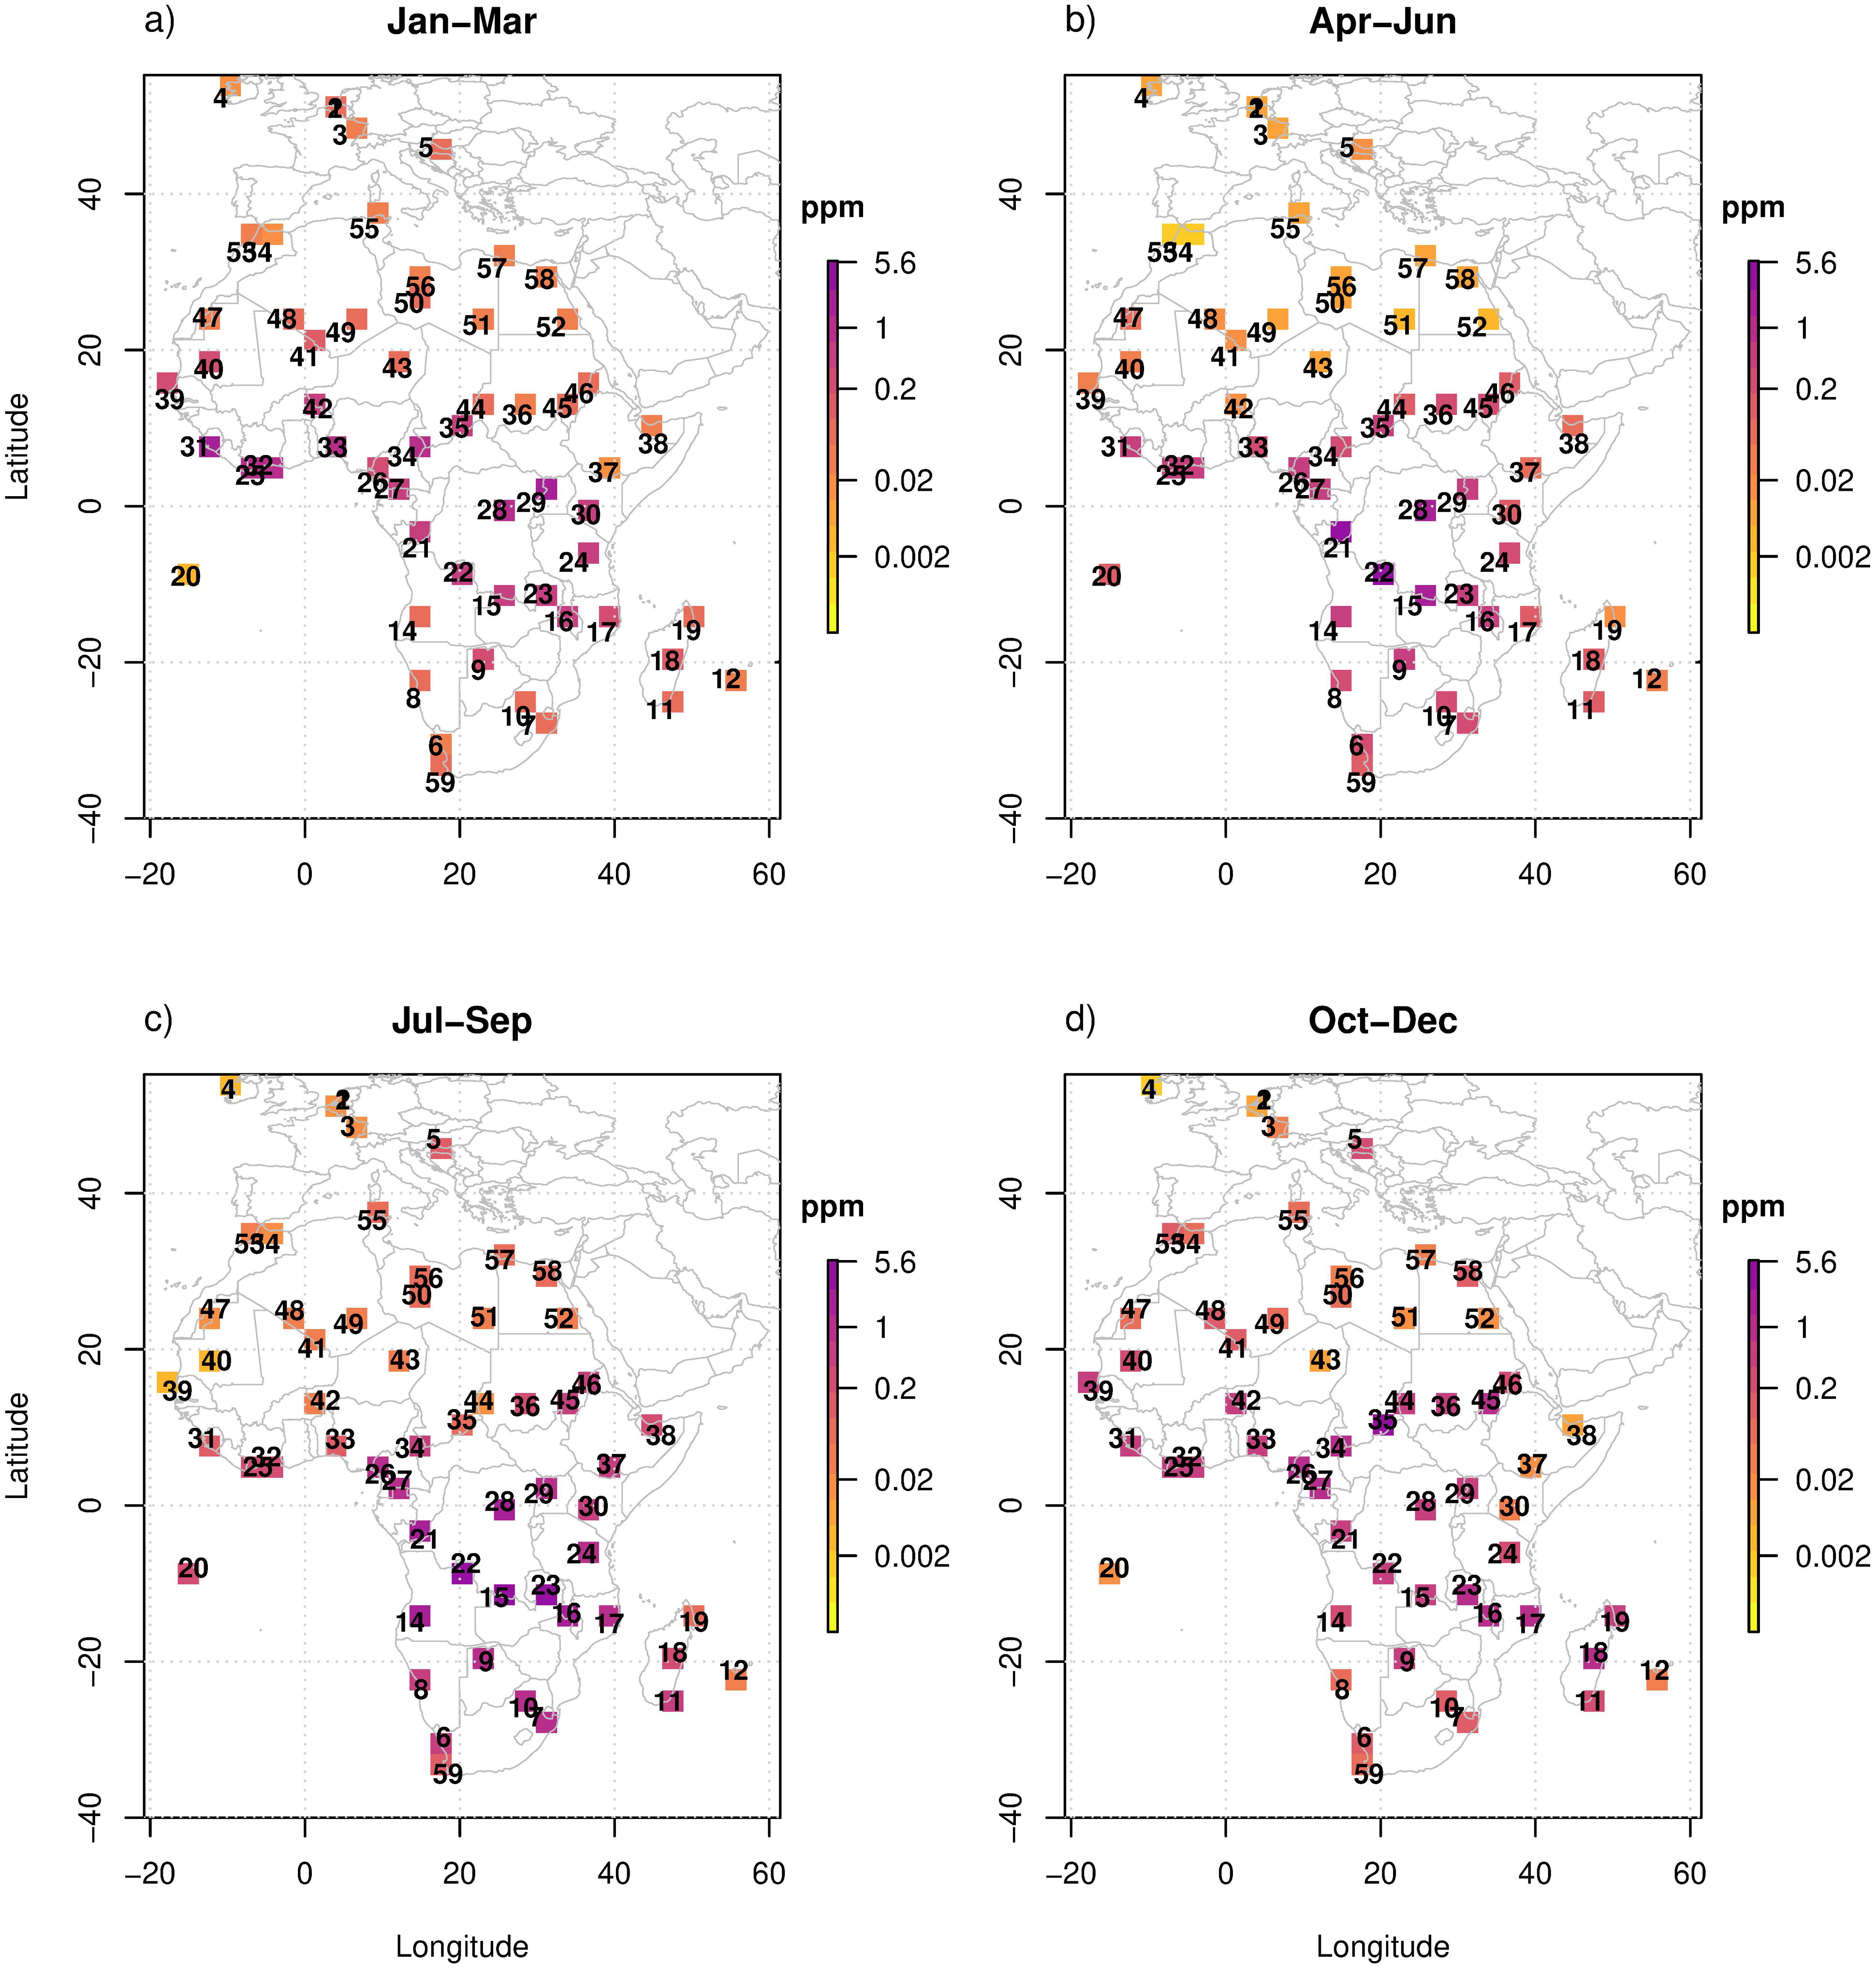
Fig. 5.
The potential biomass burning error in modelled CO2 mole fraction (in units of ppm) at each candidate site for the (a) January to March, (b) April to May, (c) June to August, and (d) September to December 2012 periods.
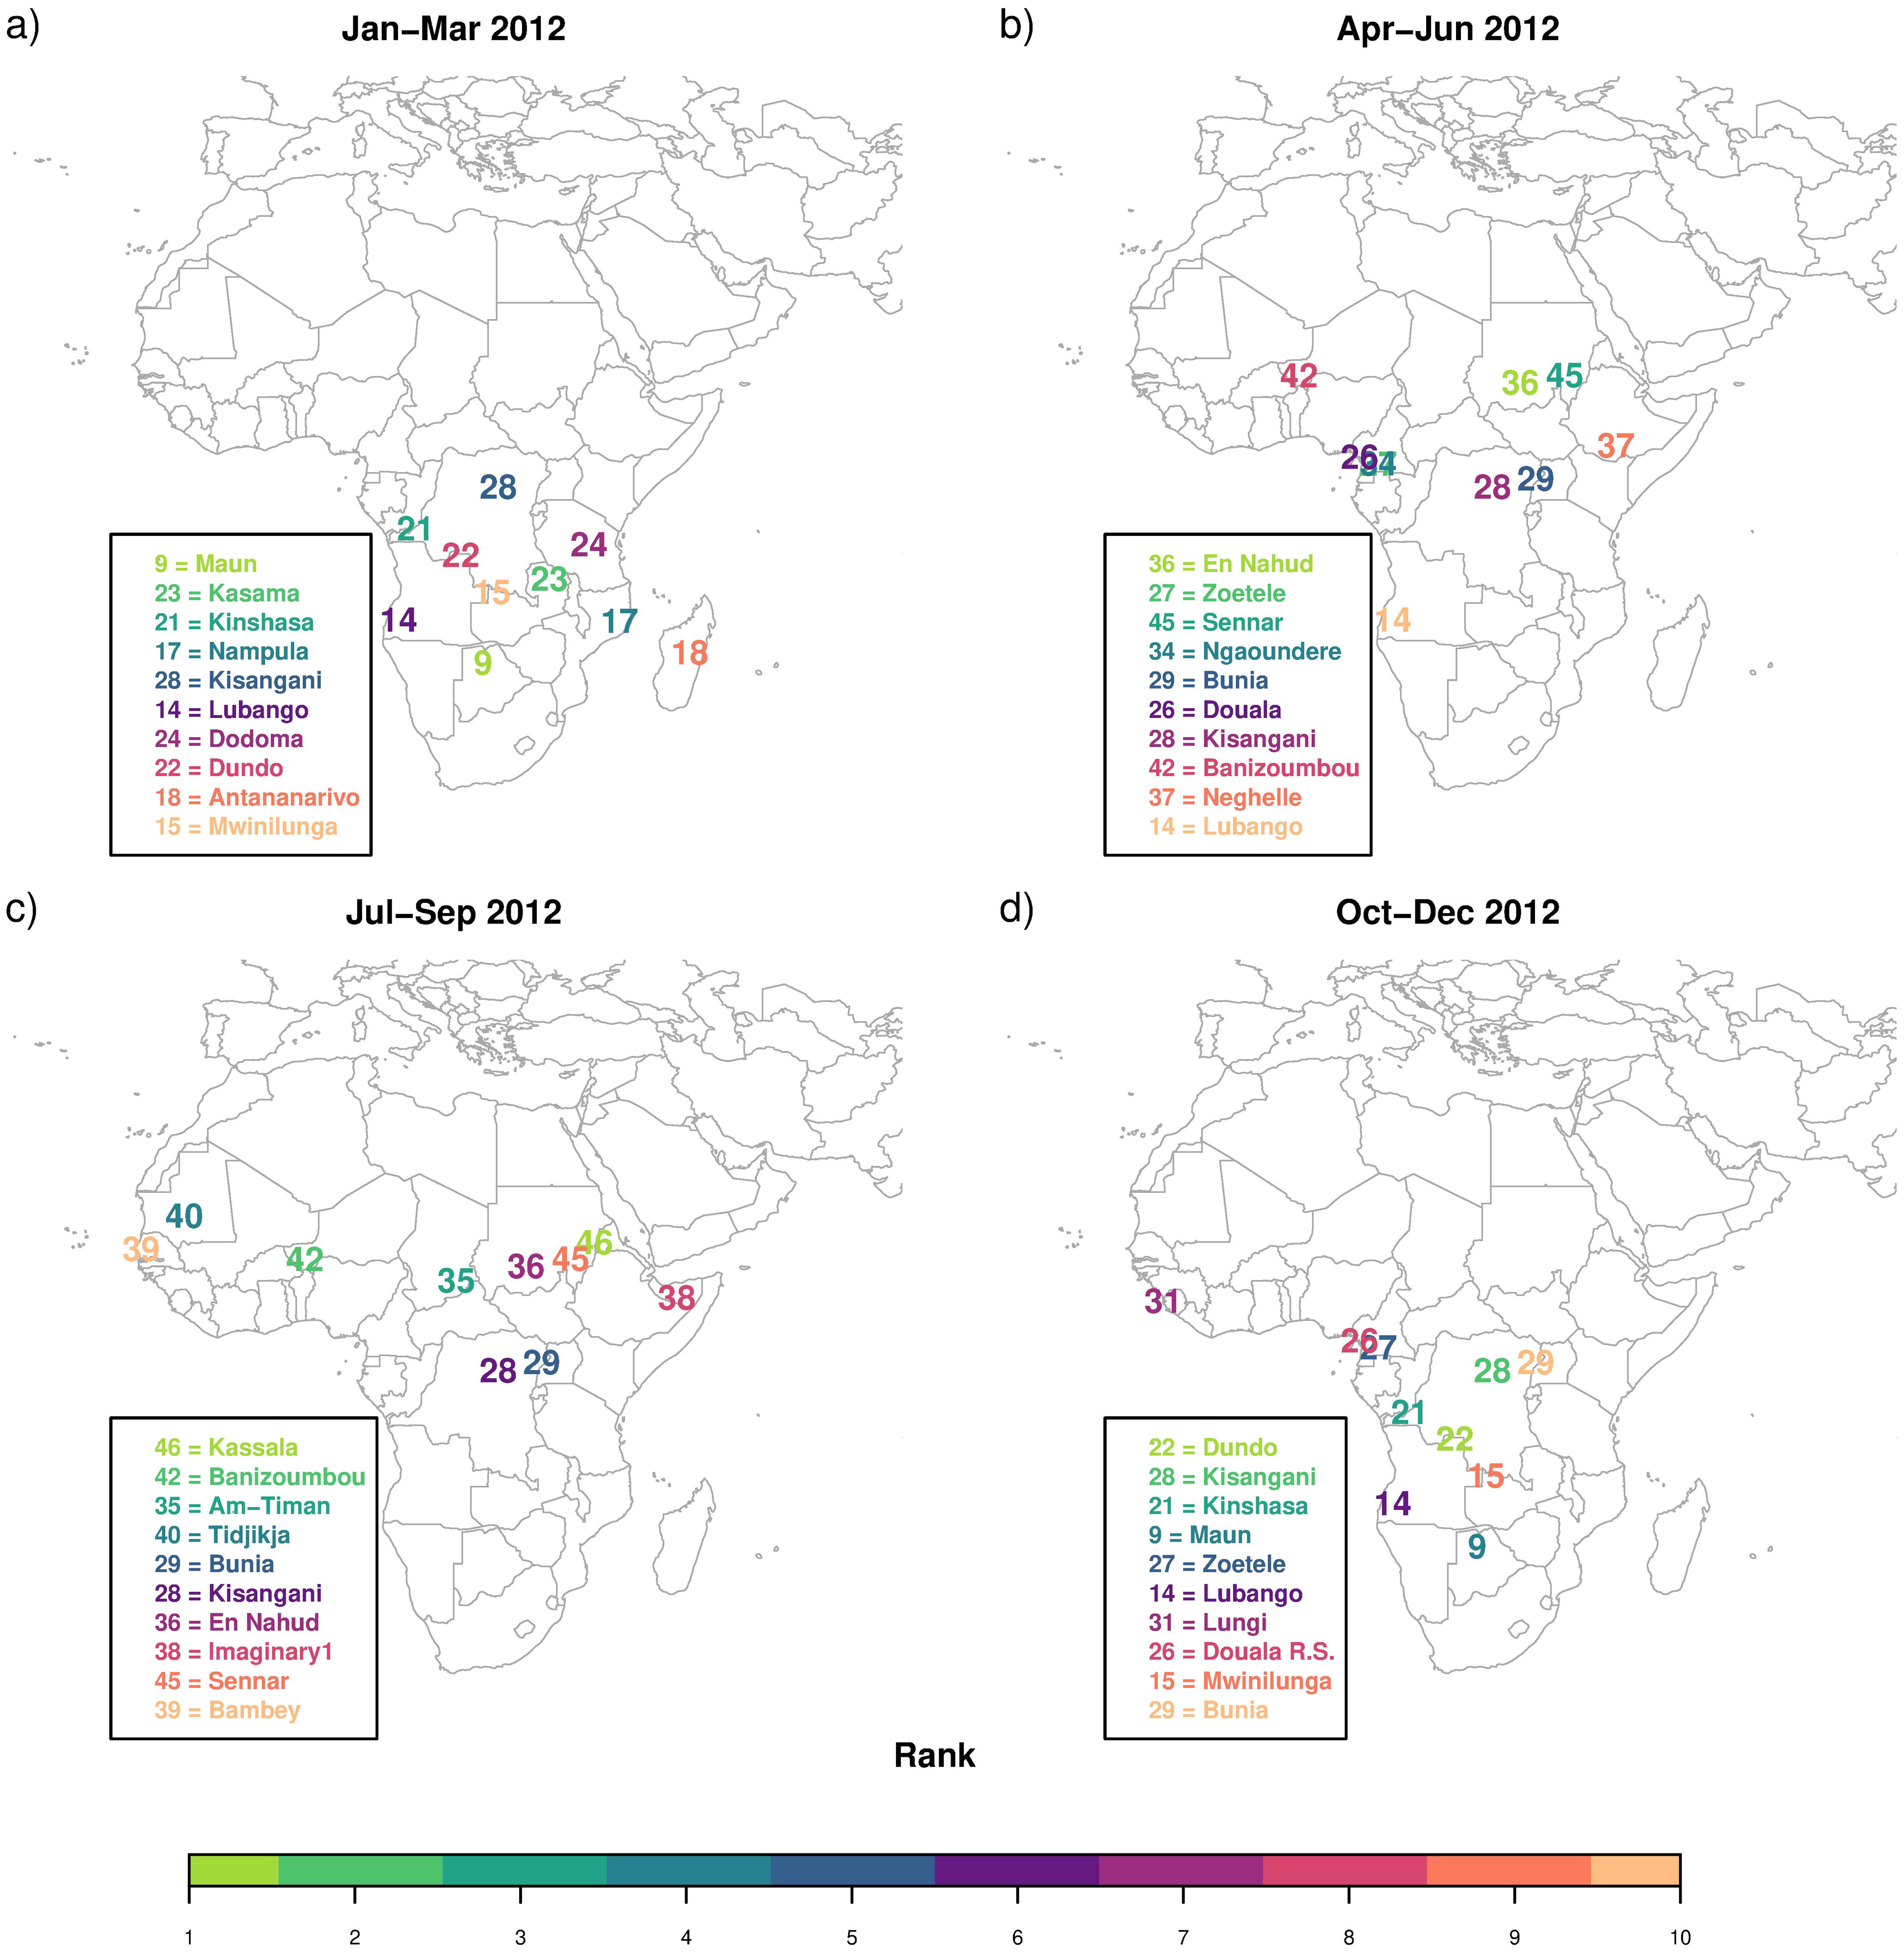
Fig. 6.
Optimal locations to situate new atmospheric monitoring sites to an existing network to reduce the overall uncertainty of CO2 fluxes from terrestrial Africa for the periods (a) January to March, (b) April to June, (c) July to August, and (d) September to December 2012. Sites are coloured according to the rank in the optimal design, with light green sites representing the site with the largest uncertainty reduction and which is the first site added to the network.
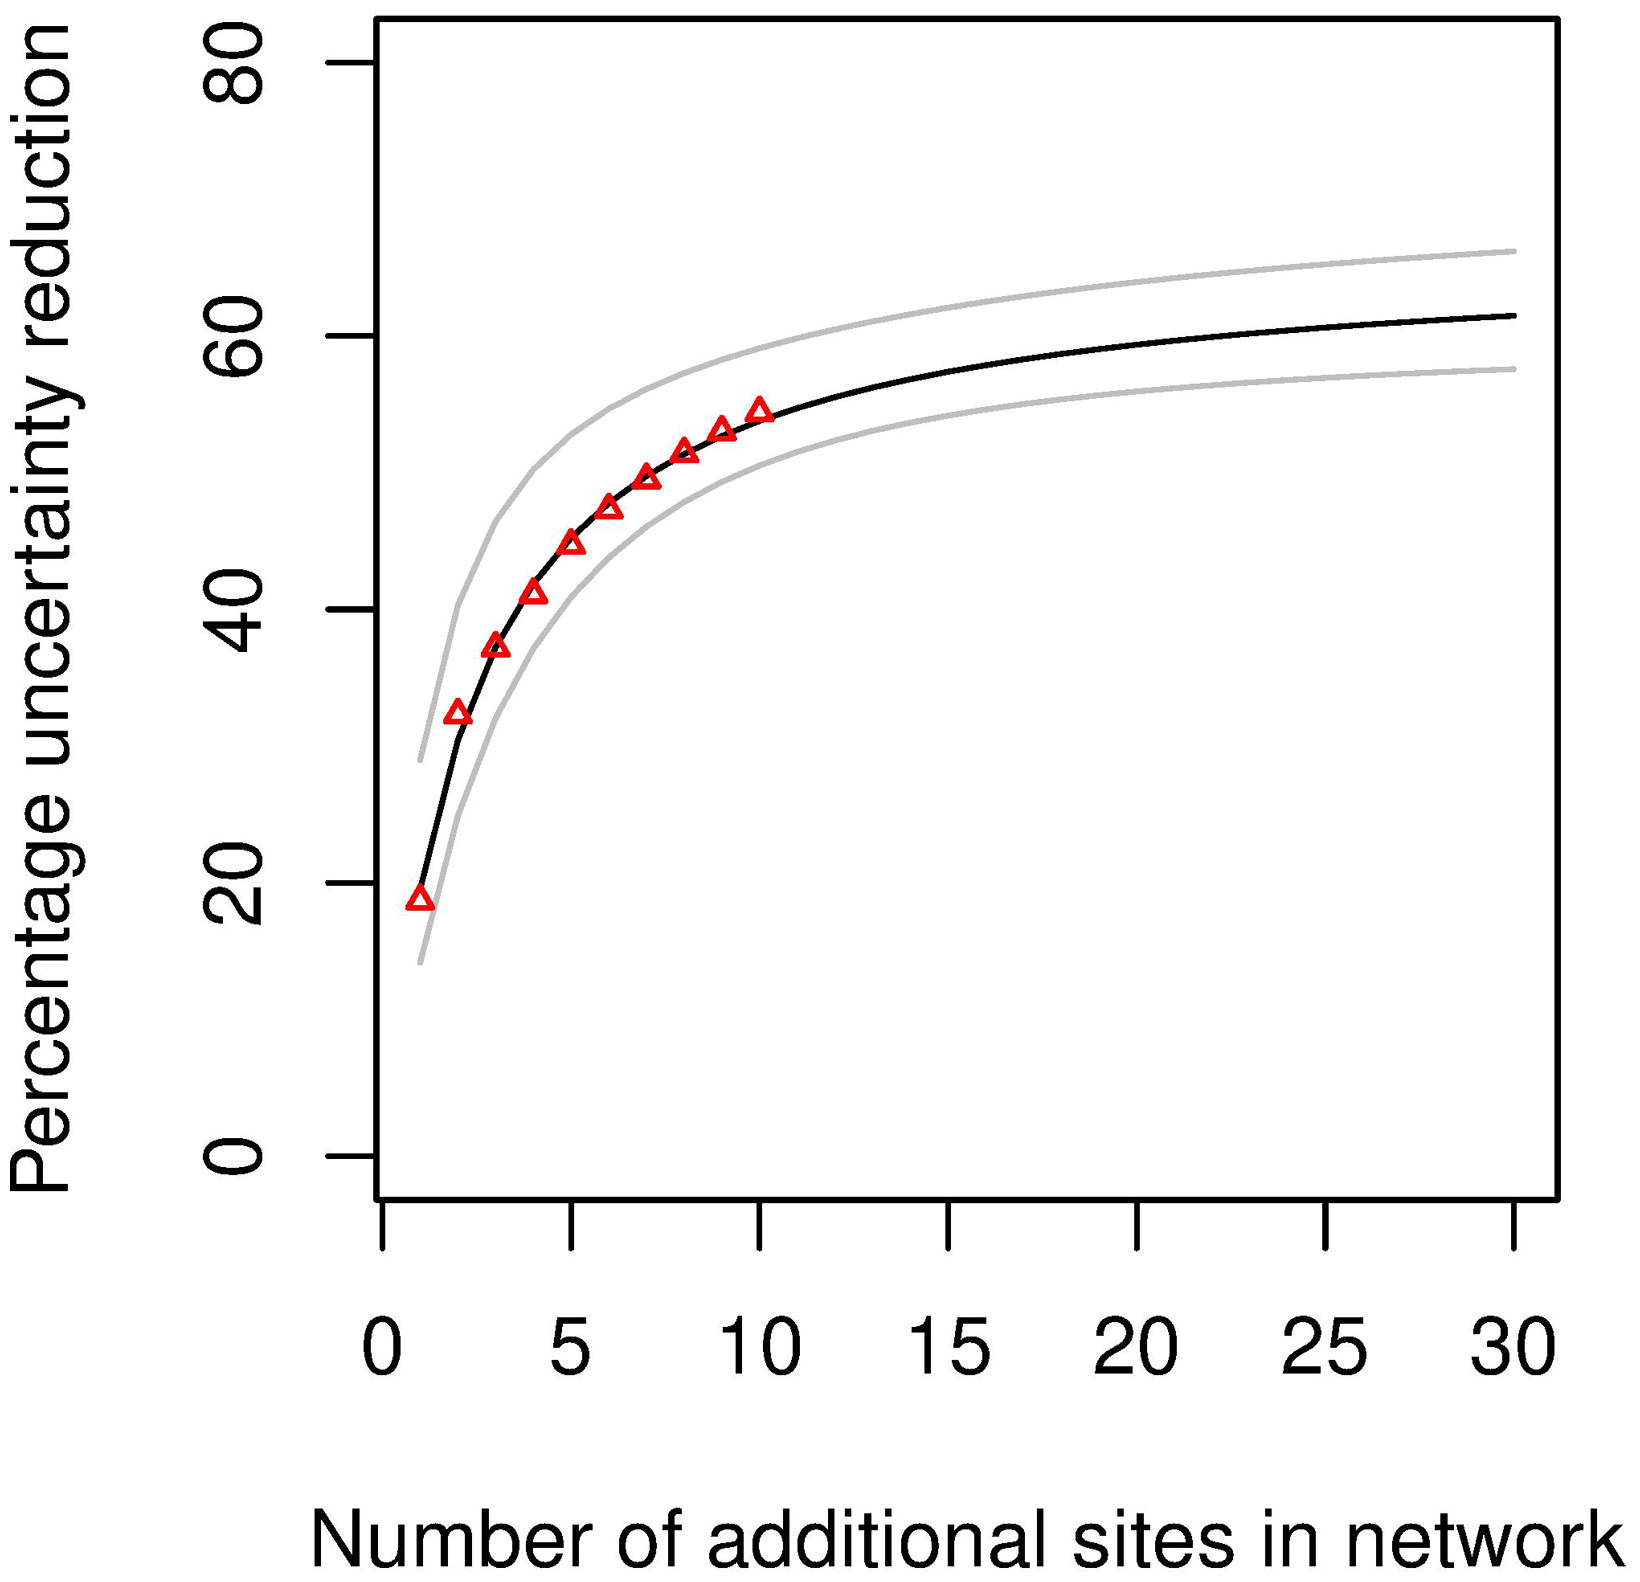
Fig. 7.
Extrapolation of the uncertainty reduction achievable with additional sites, up to 30, added to the network using a nonlinear least squares fit to a three-parameter equation .
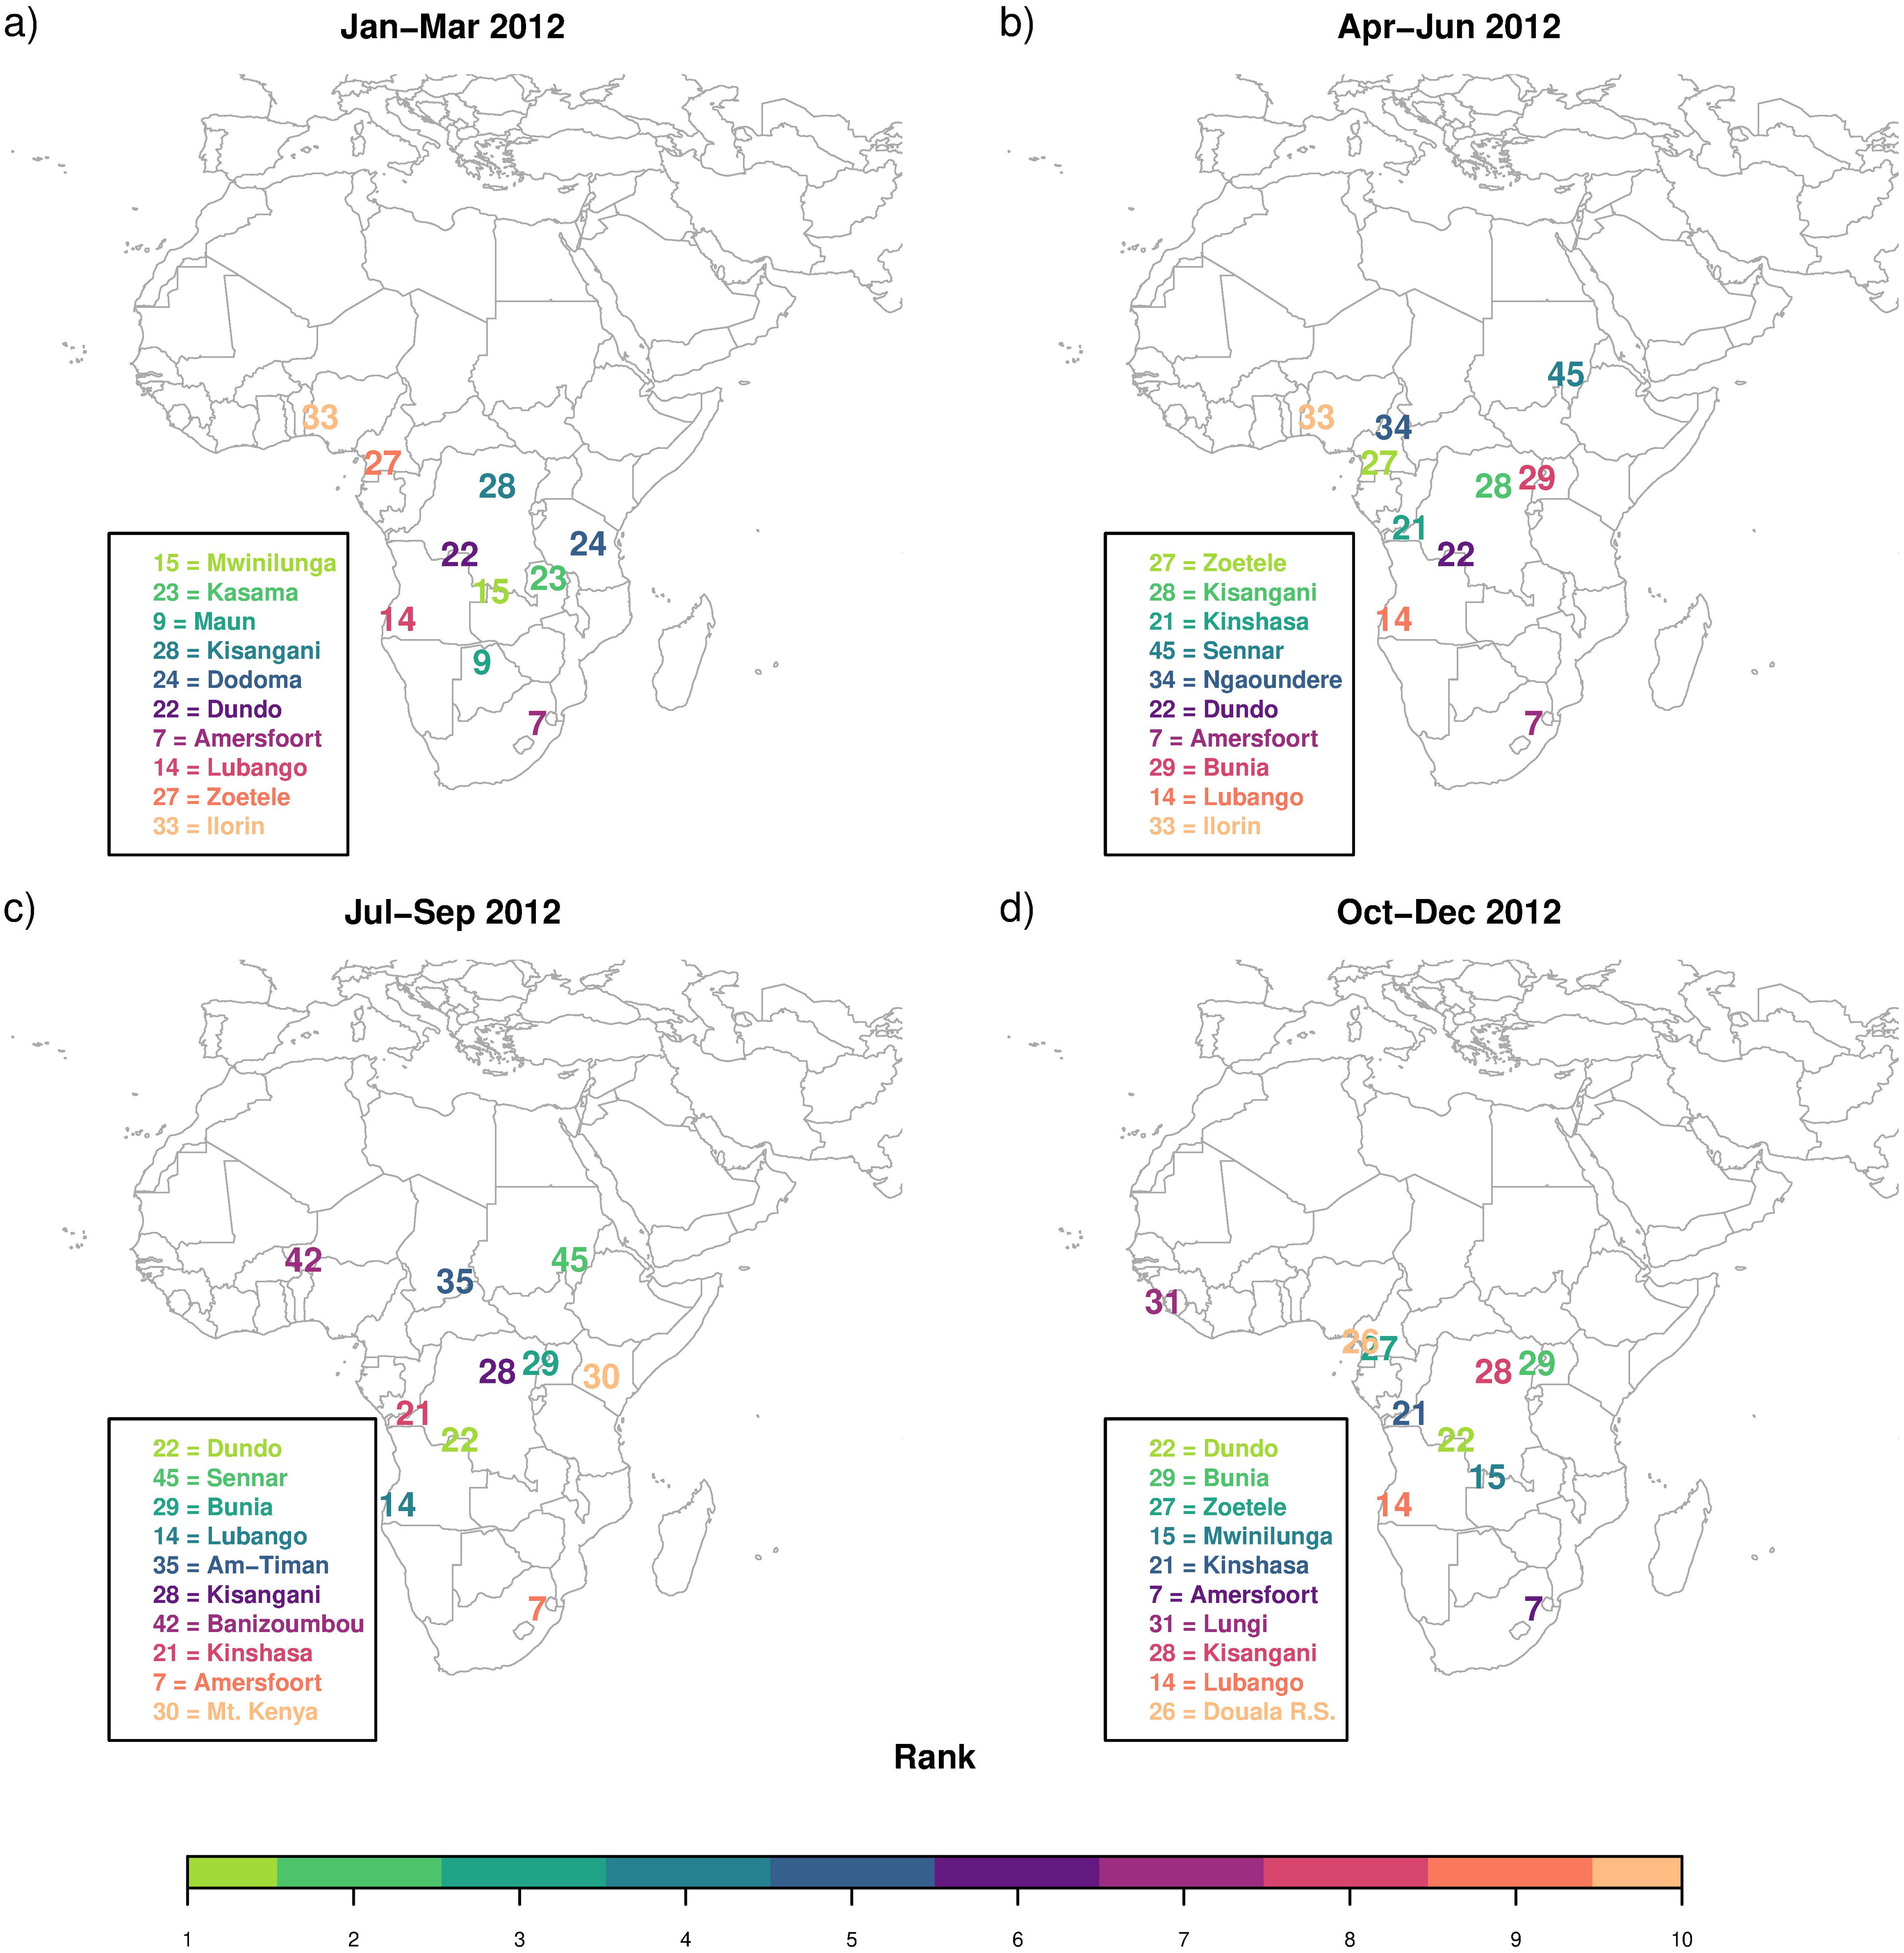
Fig. 8.
Optimal locations to situate new atmospheric monitoring sites to an existing network to reduce the overall uncertainty of CH4 fluxes from terrestrial Africa for the periods (a) January to March, (b) April to June, (c) July to August, and (d) September to December 2012. Sites are coloured according to the rank in the optimal design, with light green sites representing the site with the largest uncertainty reduction and which is the first site added to the network.
Table 3.
Ranking of the new stations added to the base network for 4 three-month periods. The station with rank 1 achieved the highest uncertainty reduction in the total CH4 flux for Africa. The cumulative reduction in uncertainty relative to the base uncertainty is provided in brackets.
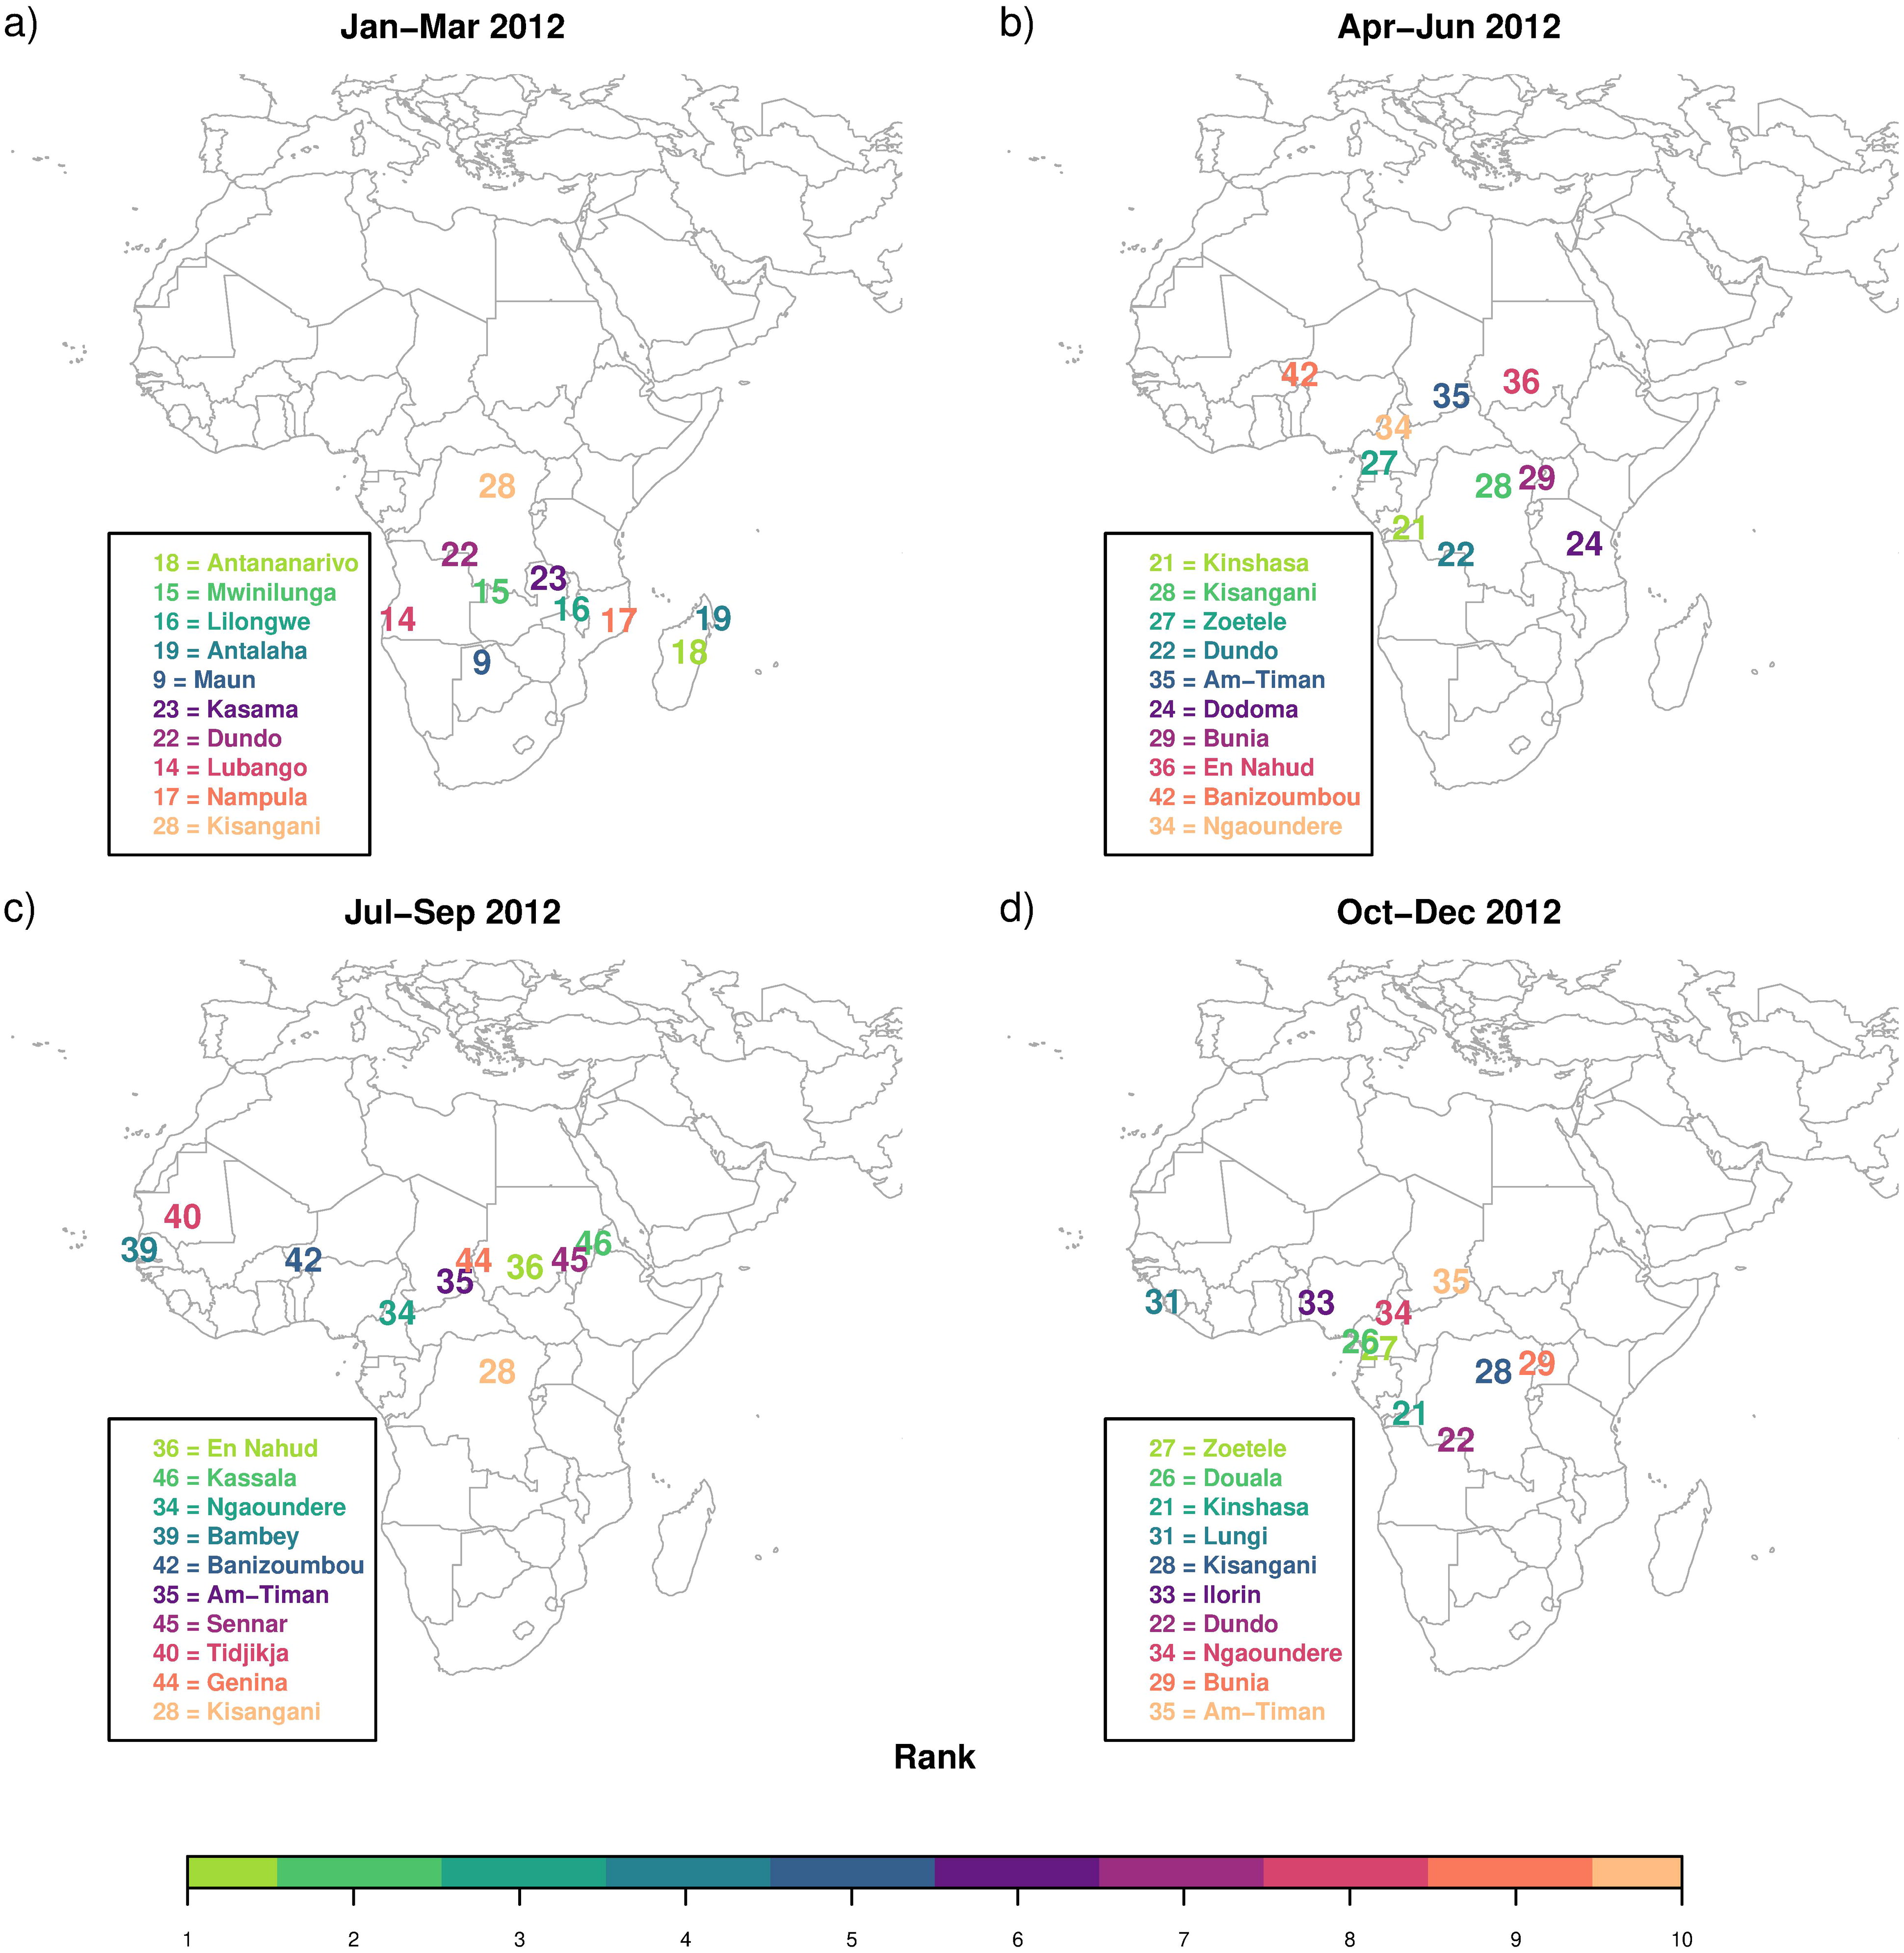
Fig. 9.
Optimal locations to situate new atmospheric monitoring sites to an existing network to reduce the overall uncertainty of N2O fluxes from terrestrial Africa for the periods (a) January to March, (b) April to June, (c) July to August, and (d) September to December 2012. Sites are coloured according to the rank in the optimal design, with light green sites representing the site with the largest uncertainty reduction and which is the first site added to the network.
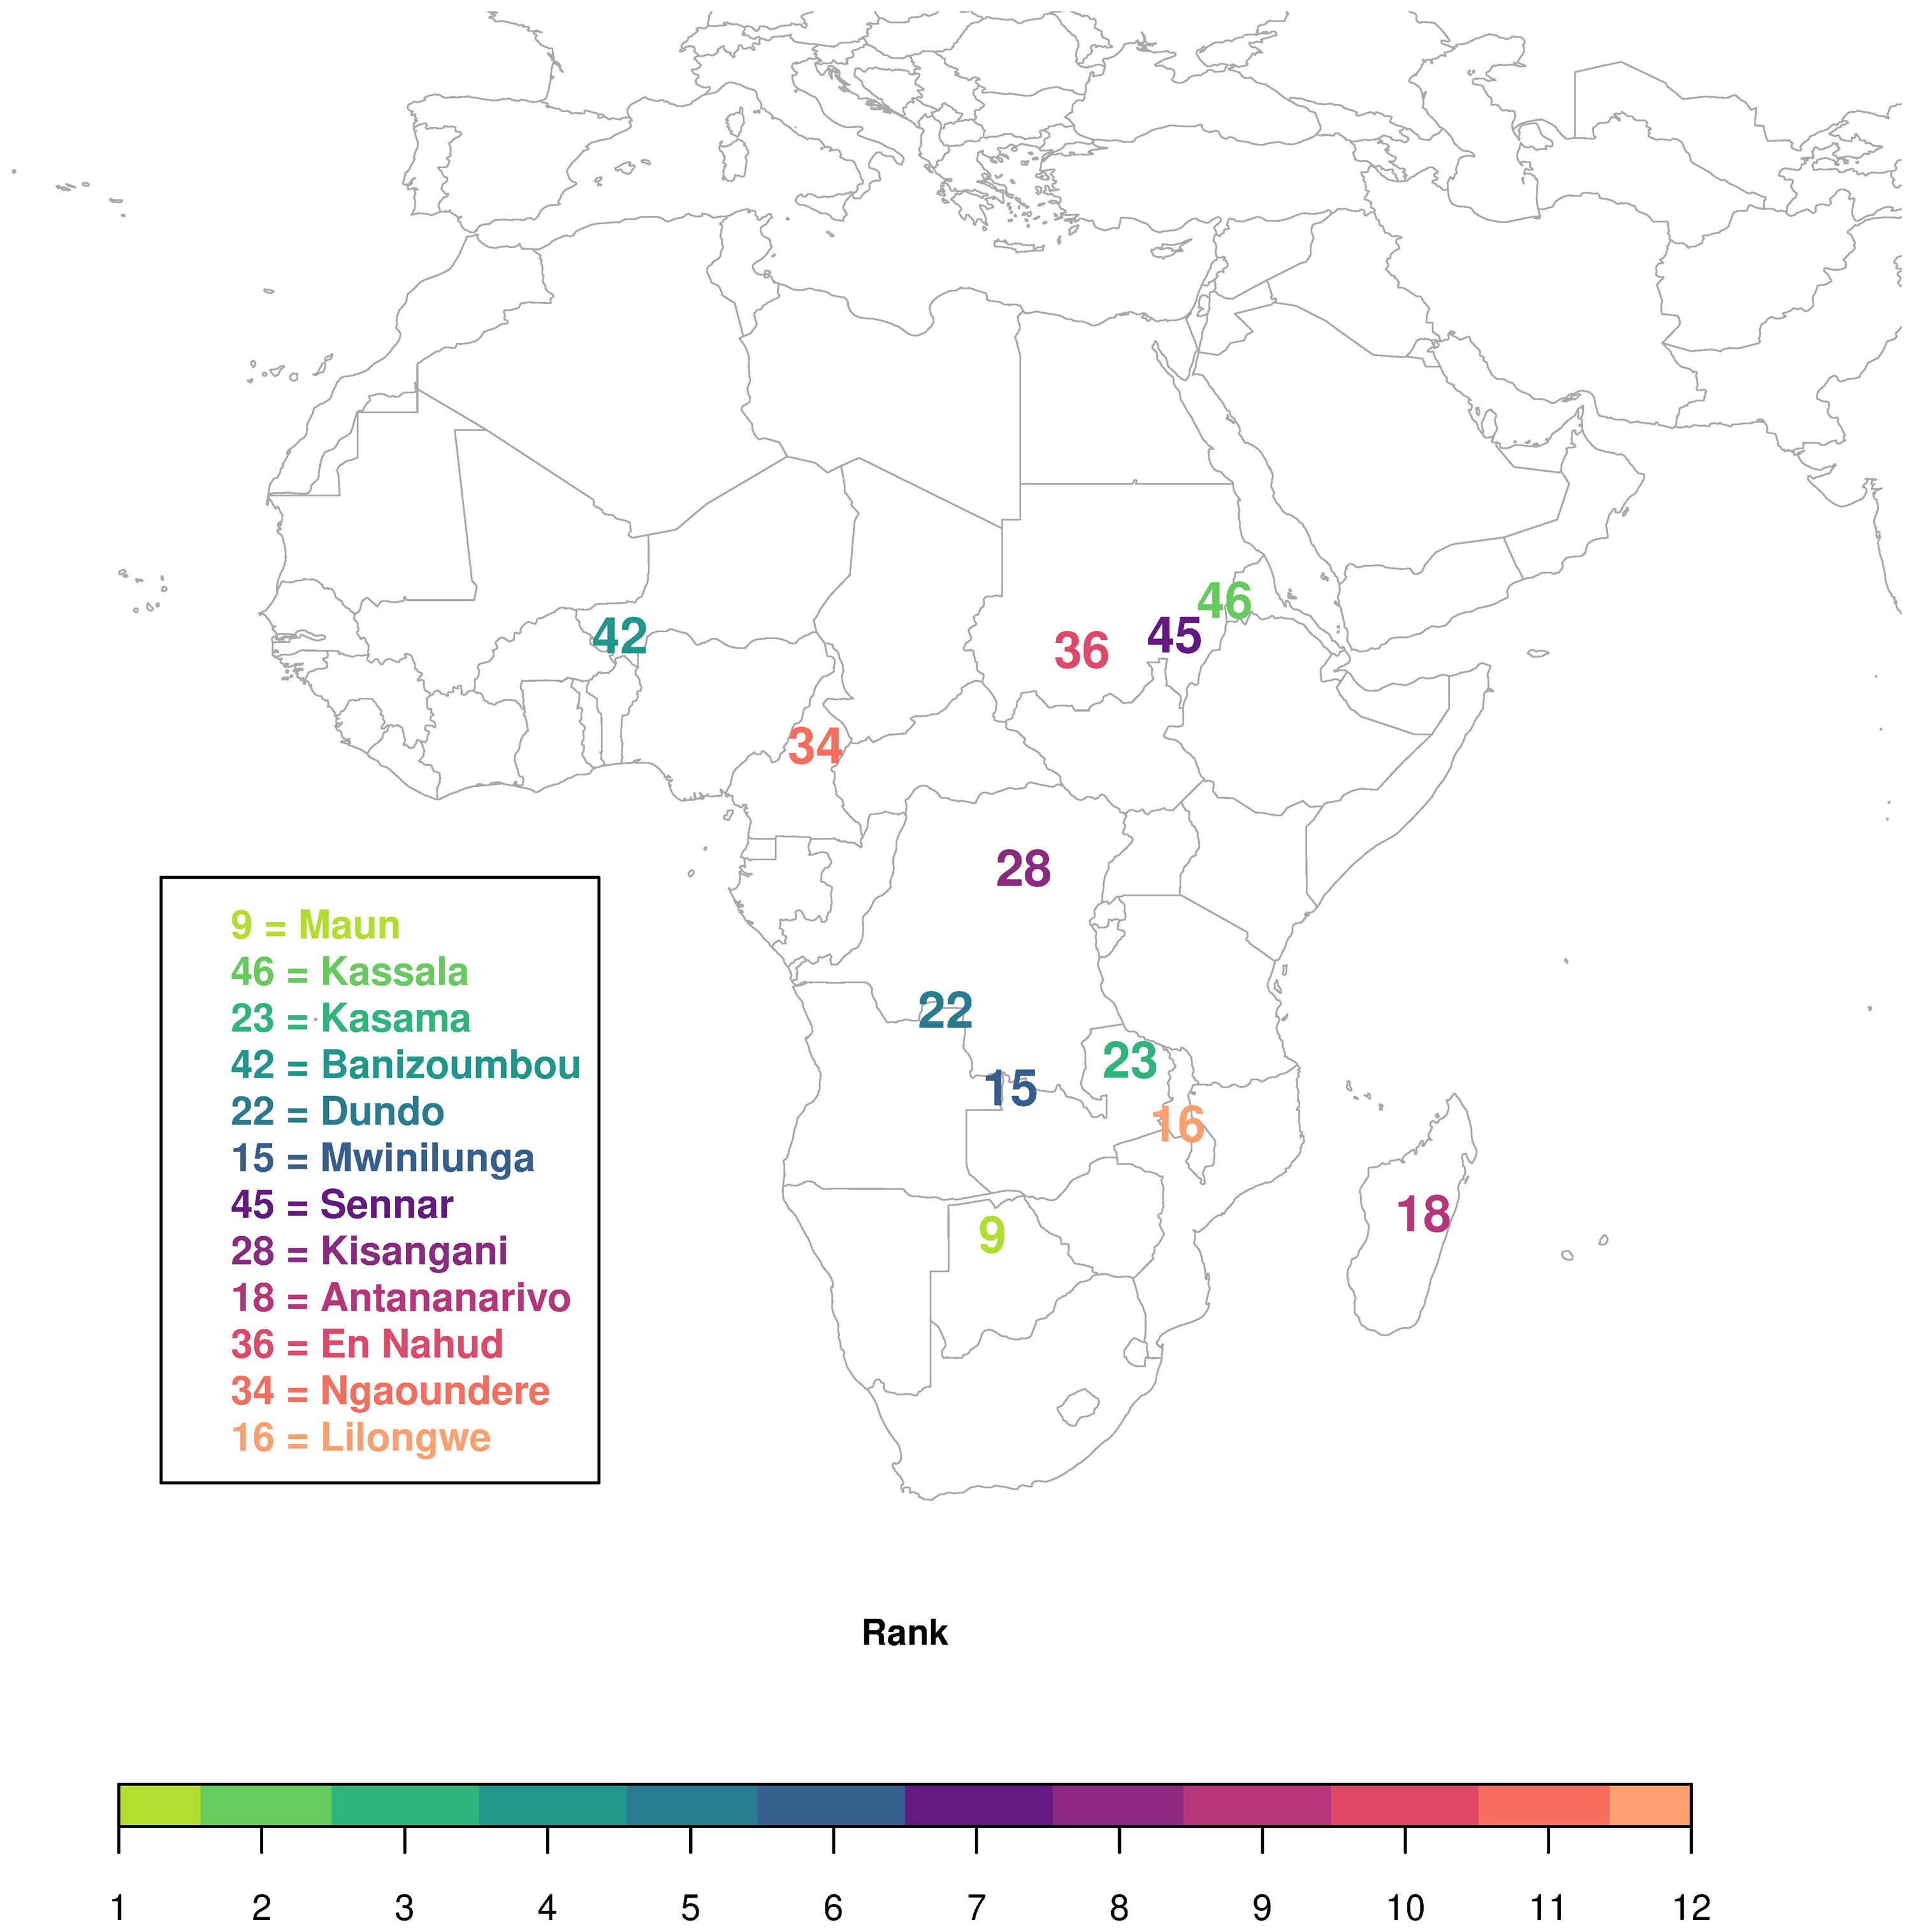
Fig. 10.
Optimal locations to situate new atmospheric monitoring sites to an existing network to reduce the overall uncertainty of CO2, CH4, and N2O fluxes from terrestrial Africa, where 2012 has been taken as a representative year, obtained using the solutions from the individual gas network designs. Sites are coloured according to the order in which they were added to the solution, where sites were first selected from the CO2 solution, followed by CH4, and N2O.
Table 5.
Uncertainty reductions achieved by the combined network solution aimed at reducing the uncertainty in fluxes across CO2, CH4 and N2O fluxes and across both Northern and Southern Hemisphere summers for approach 1, which uses the separate network design solutions (12 sites), and approach 2, which optimises over all three gases simultaneously (10 sites and 12 sites).
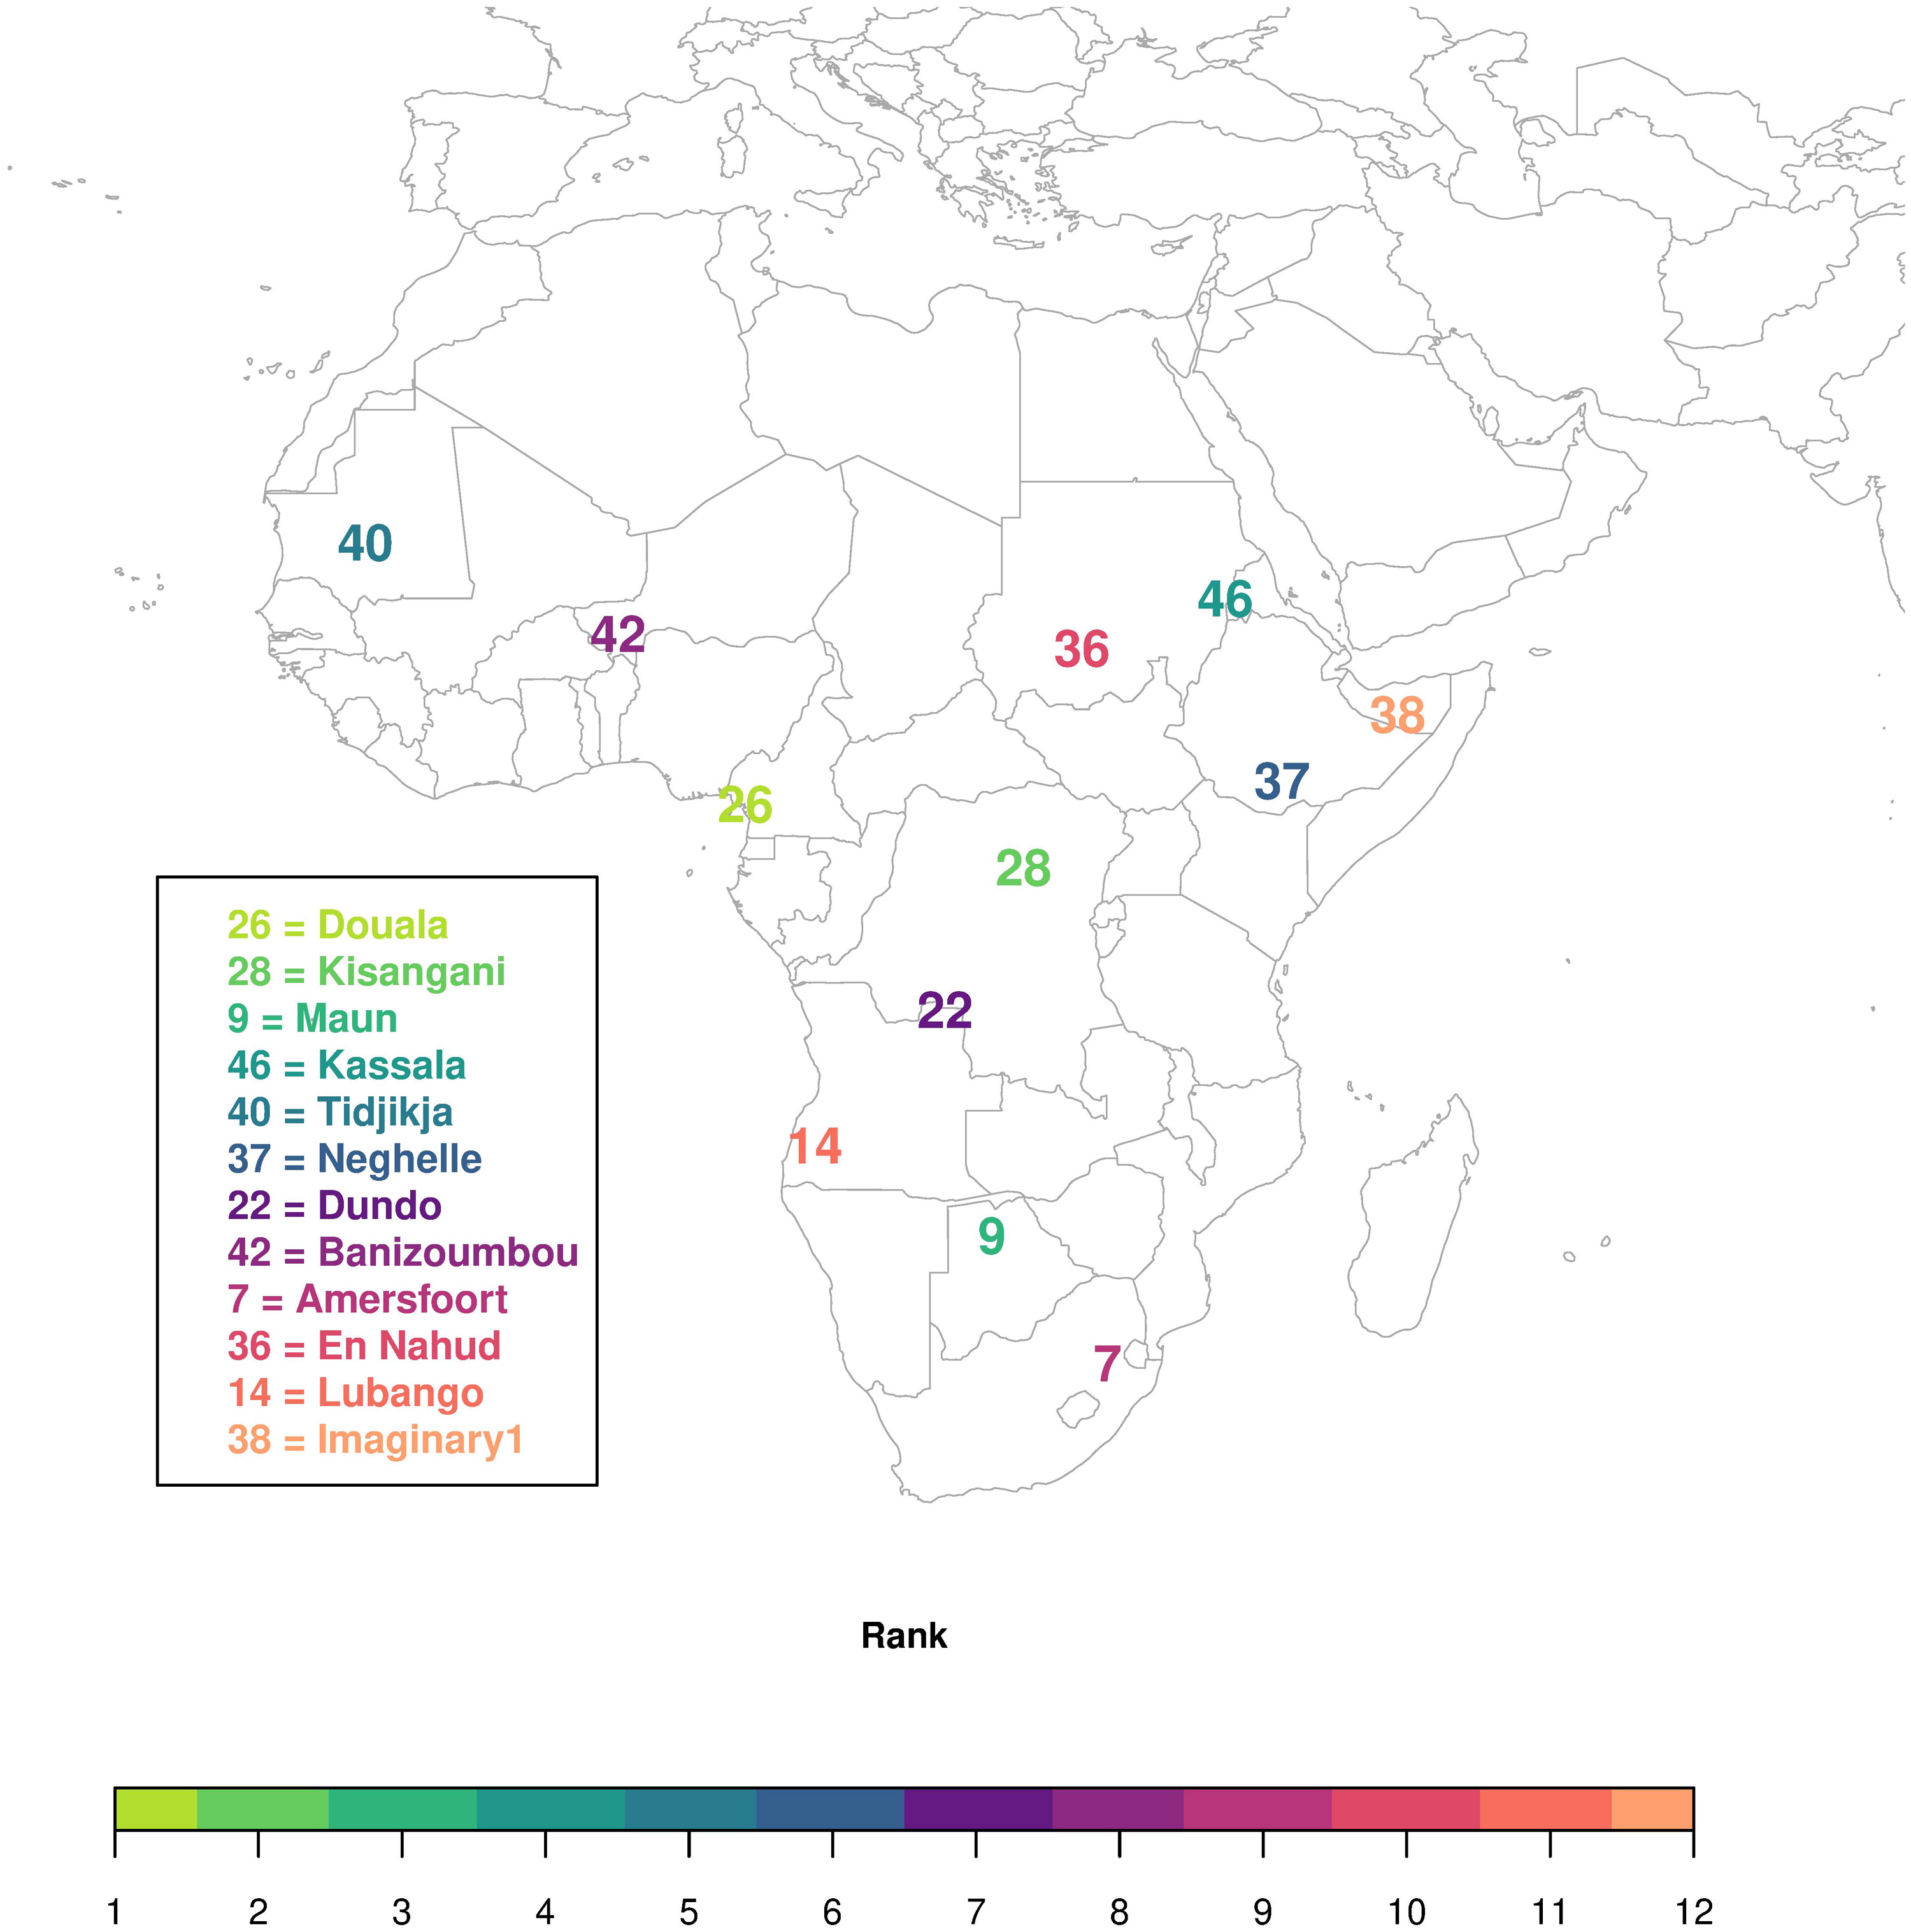
Fig. 11.
Optimal locations to situate new atmospheric monitoring sites to an existing network to reduce the overall uncertainty of CO2, CH4, and N2O fluxes from terrestrial Africa, where 2012 has been taken as a representative year, following approach 2, which optimised over the three gases simultaneously. Sites are coloured according to the rank in the optimal design, with light green sites representing the site with the largest uncertainty reduction and which is the first site added to the network.
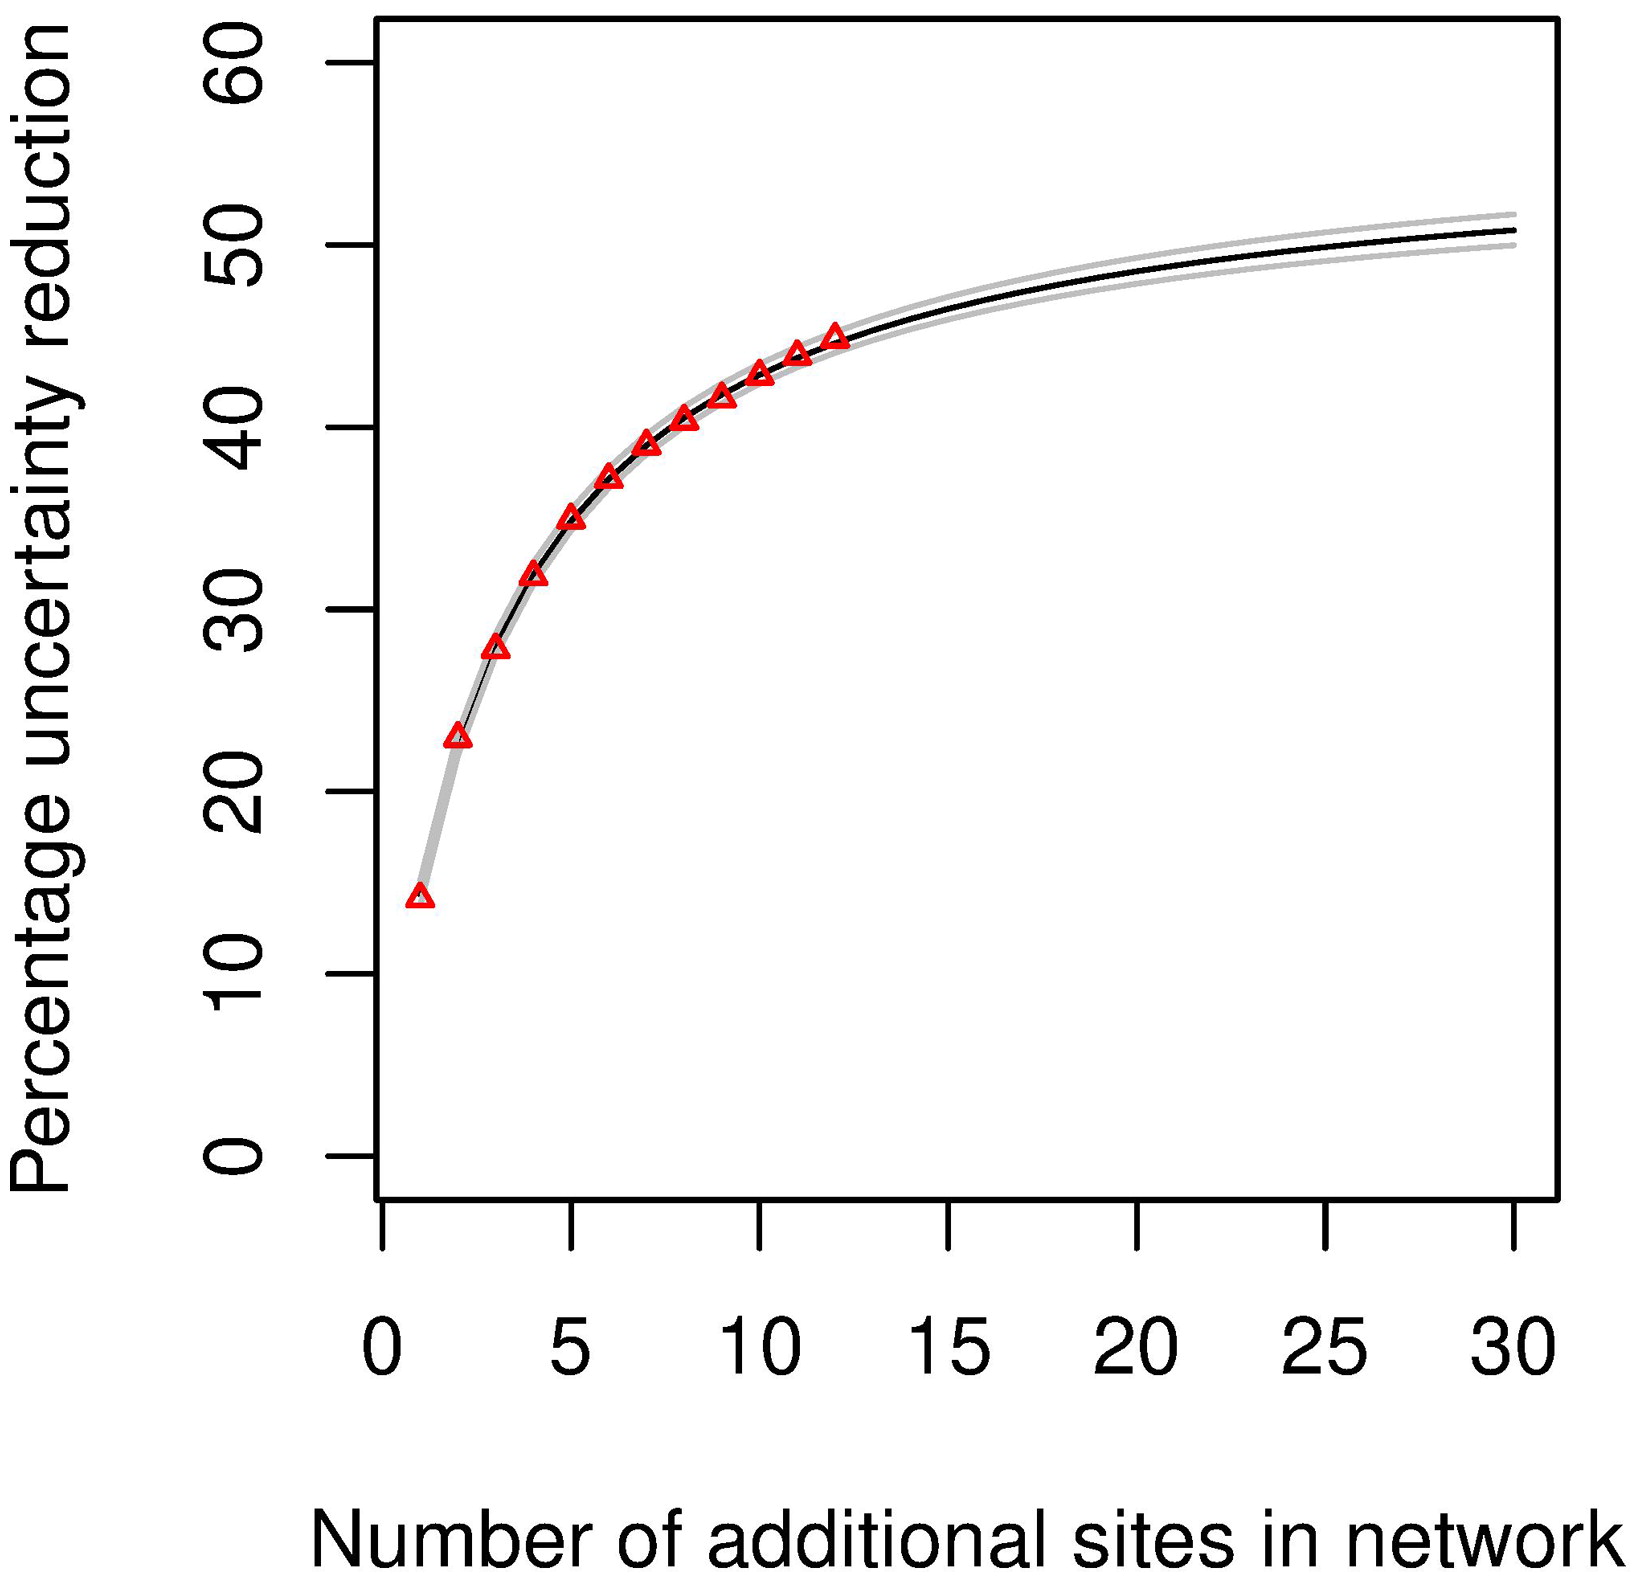
Fig. 12.
Extrapolation of the uncertainty reduction achievable over all three gases using approach 2, with additional sites, up to 30, added to the network using a nonlinear least squares fit to a three-parameter equation.
1+ (=sites)
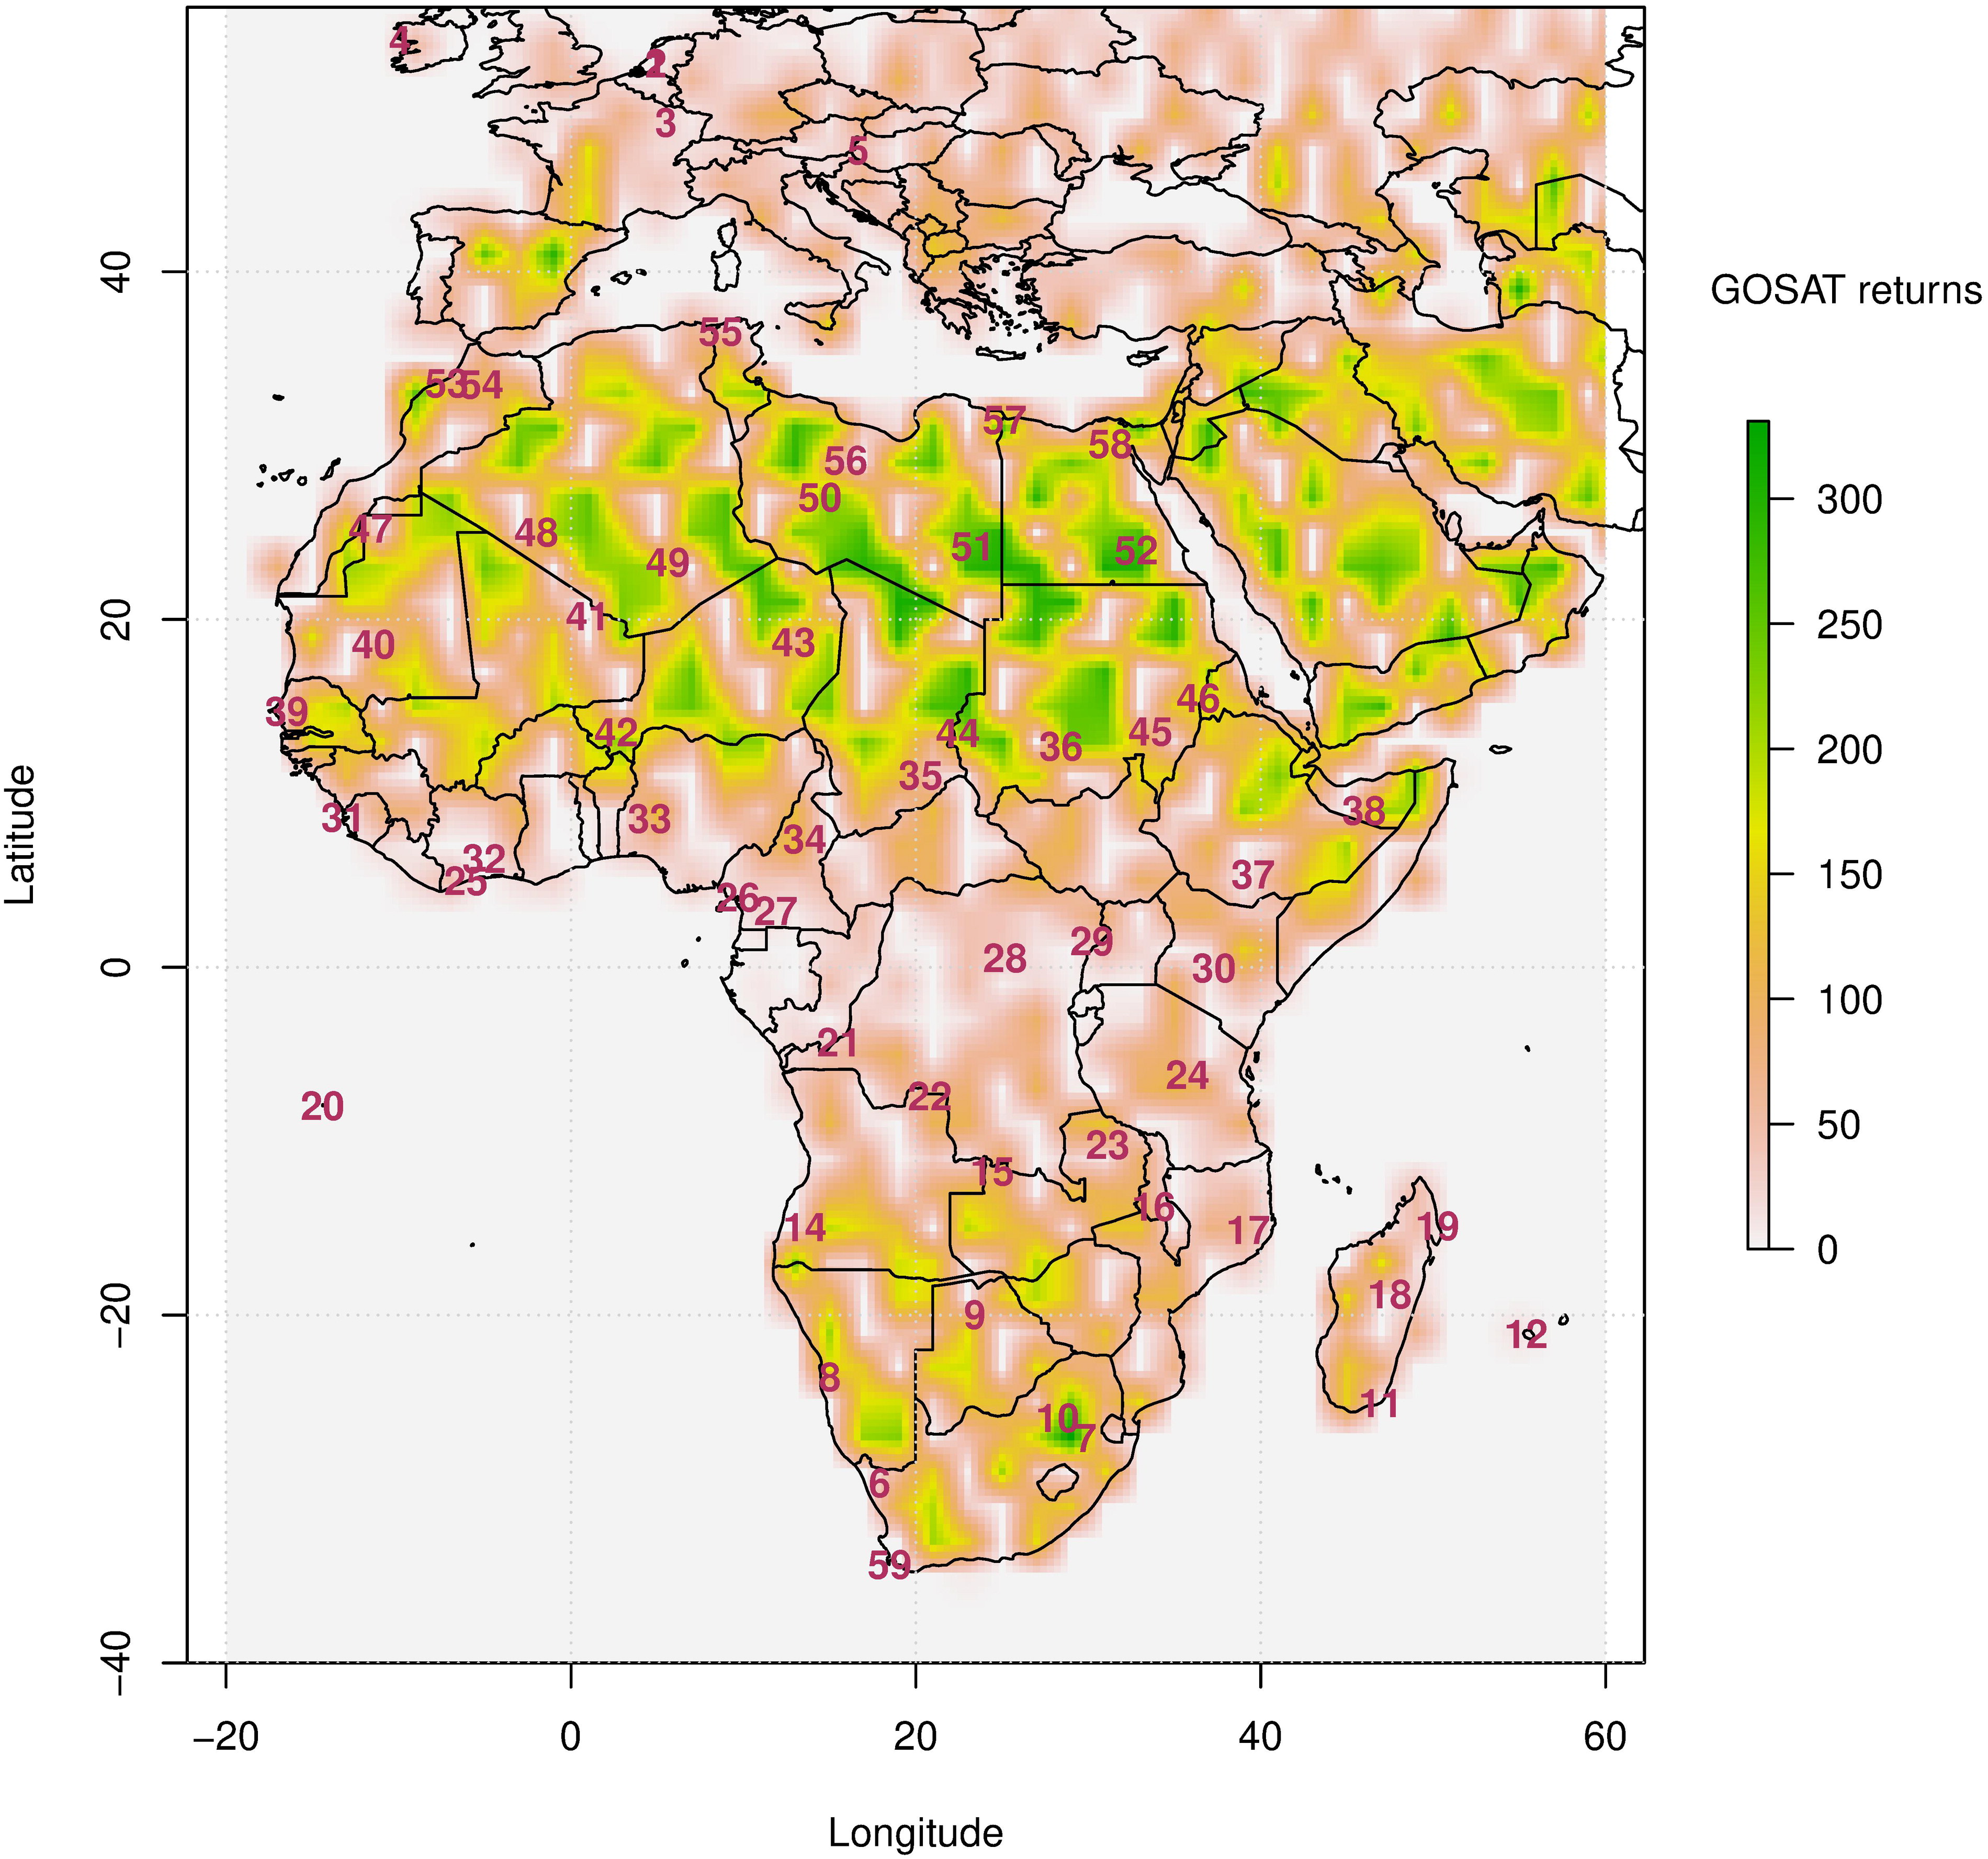
Fig. 13.
Number of valid retrievals from the GOSAT satellite product (https://earth.esa.int/web/guest/ missions/3rd-party-missions/current-missions/gosat) for CO2 for the year 2012.