
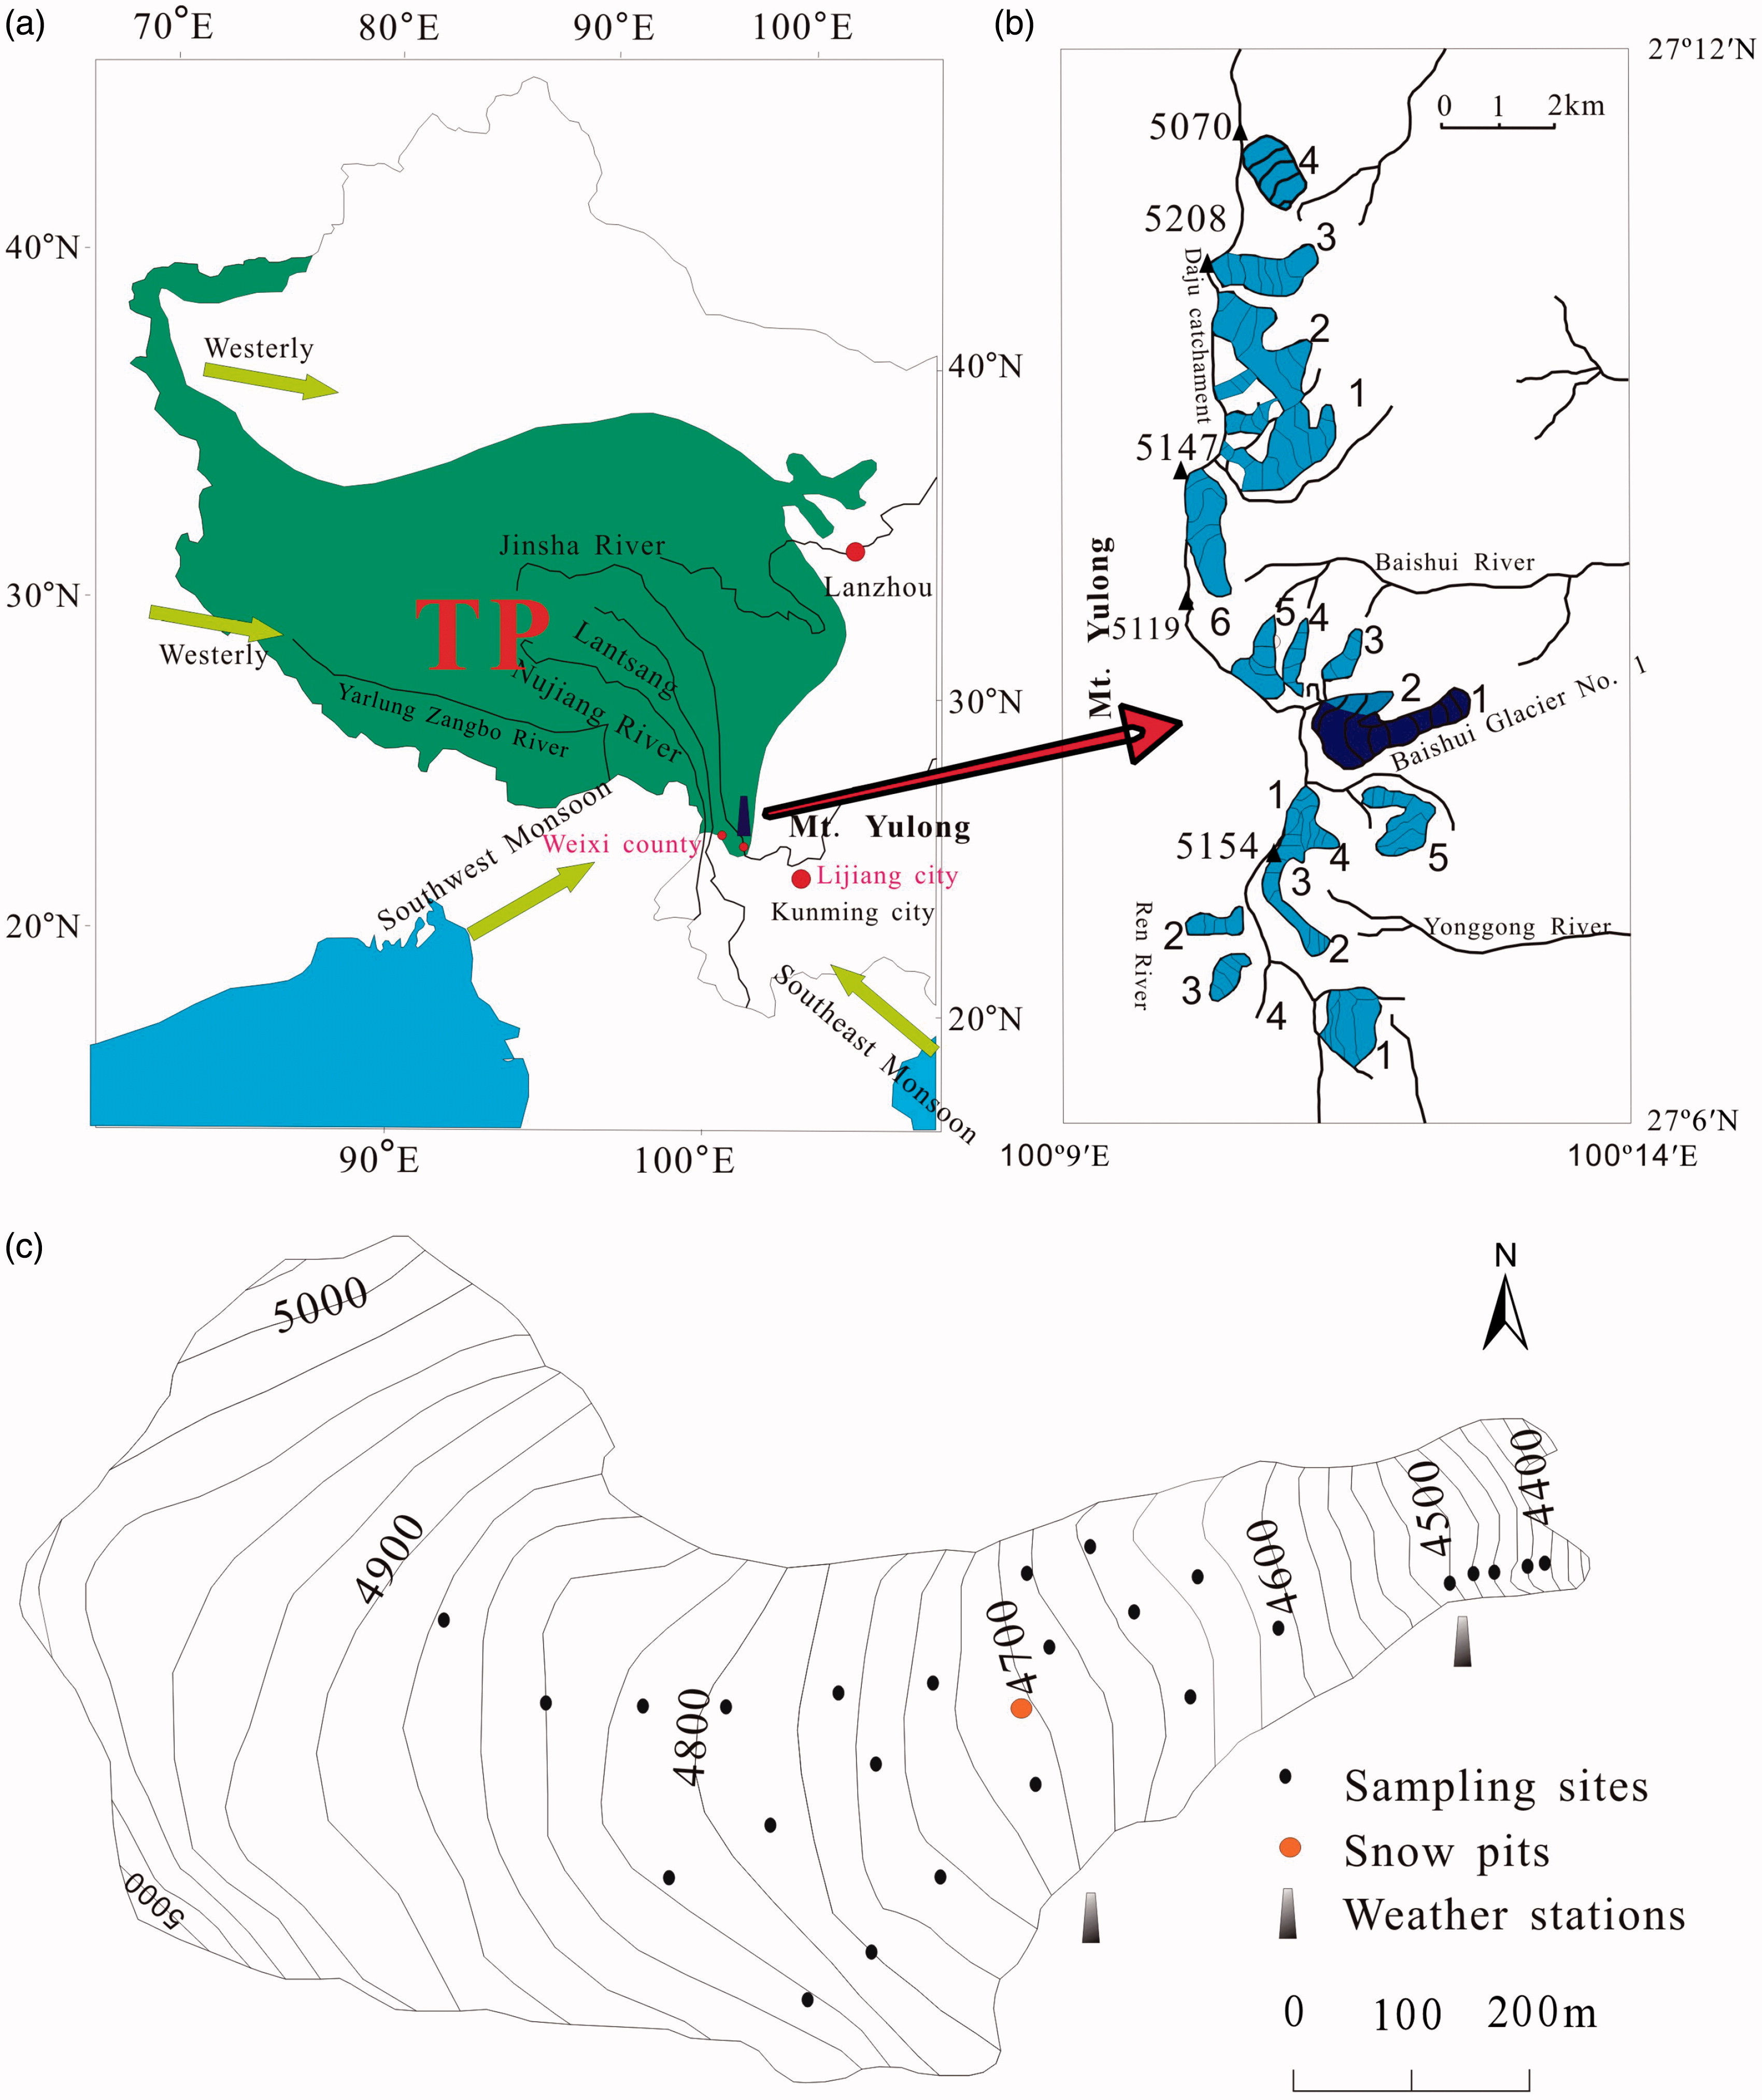
Fig. 1.
The location of Mt. Yulong and the sampling sites on Baishui glacier.
Table 1.
Various snow, granular ice, and meltwater samples collected from Baishui glacier in 2014 and a summary of the relevant information (number of samples, elevations of the sampling sites, and the measured parameters).
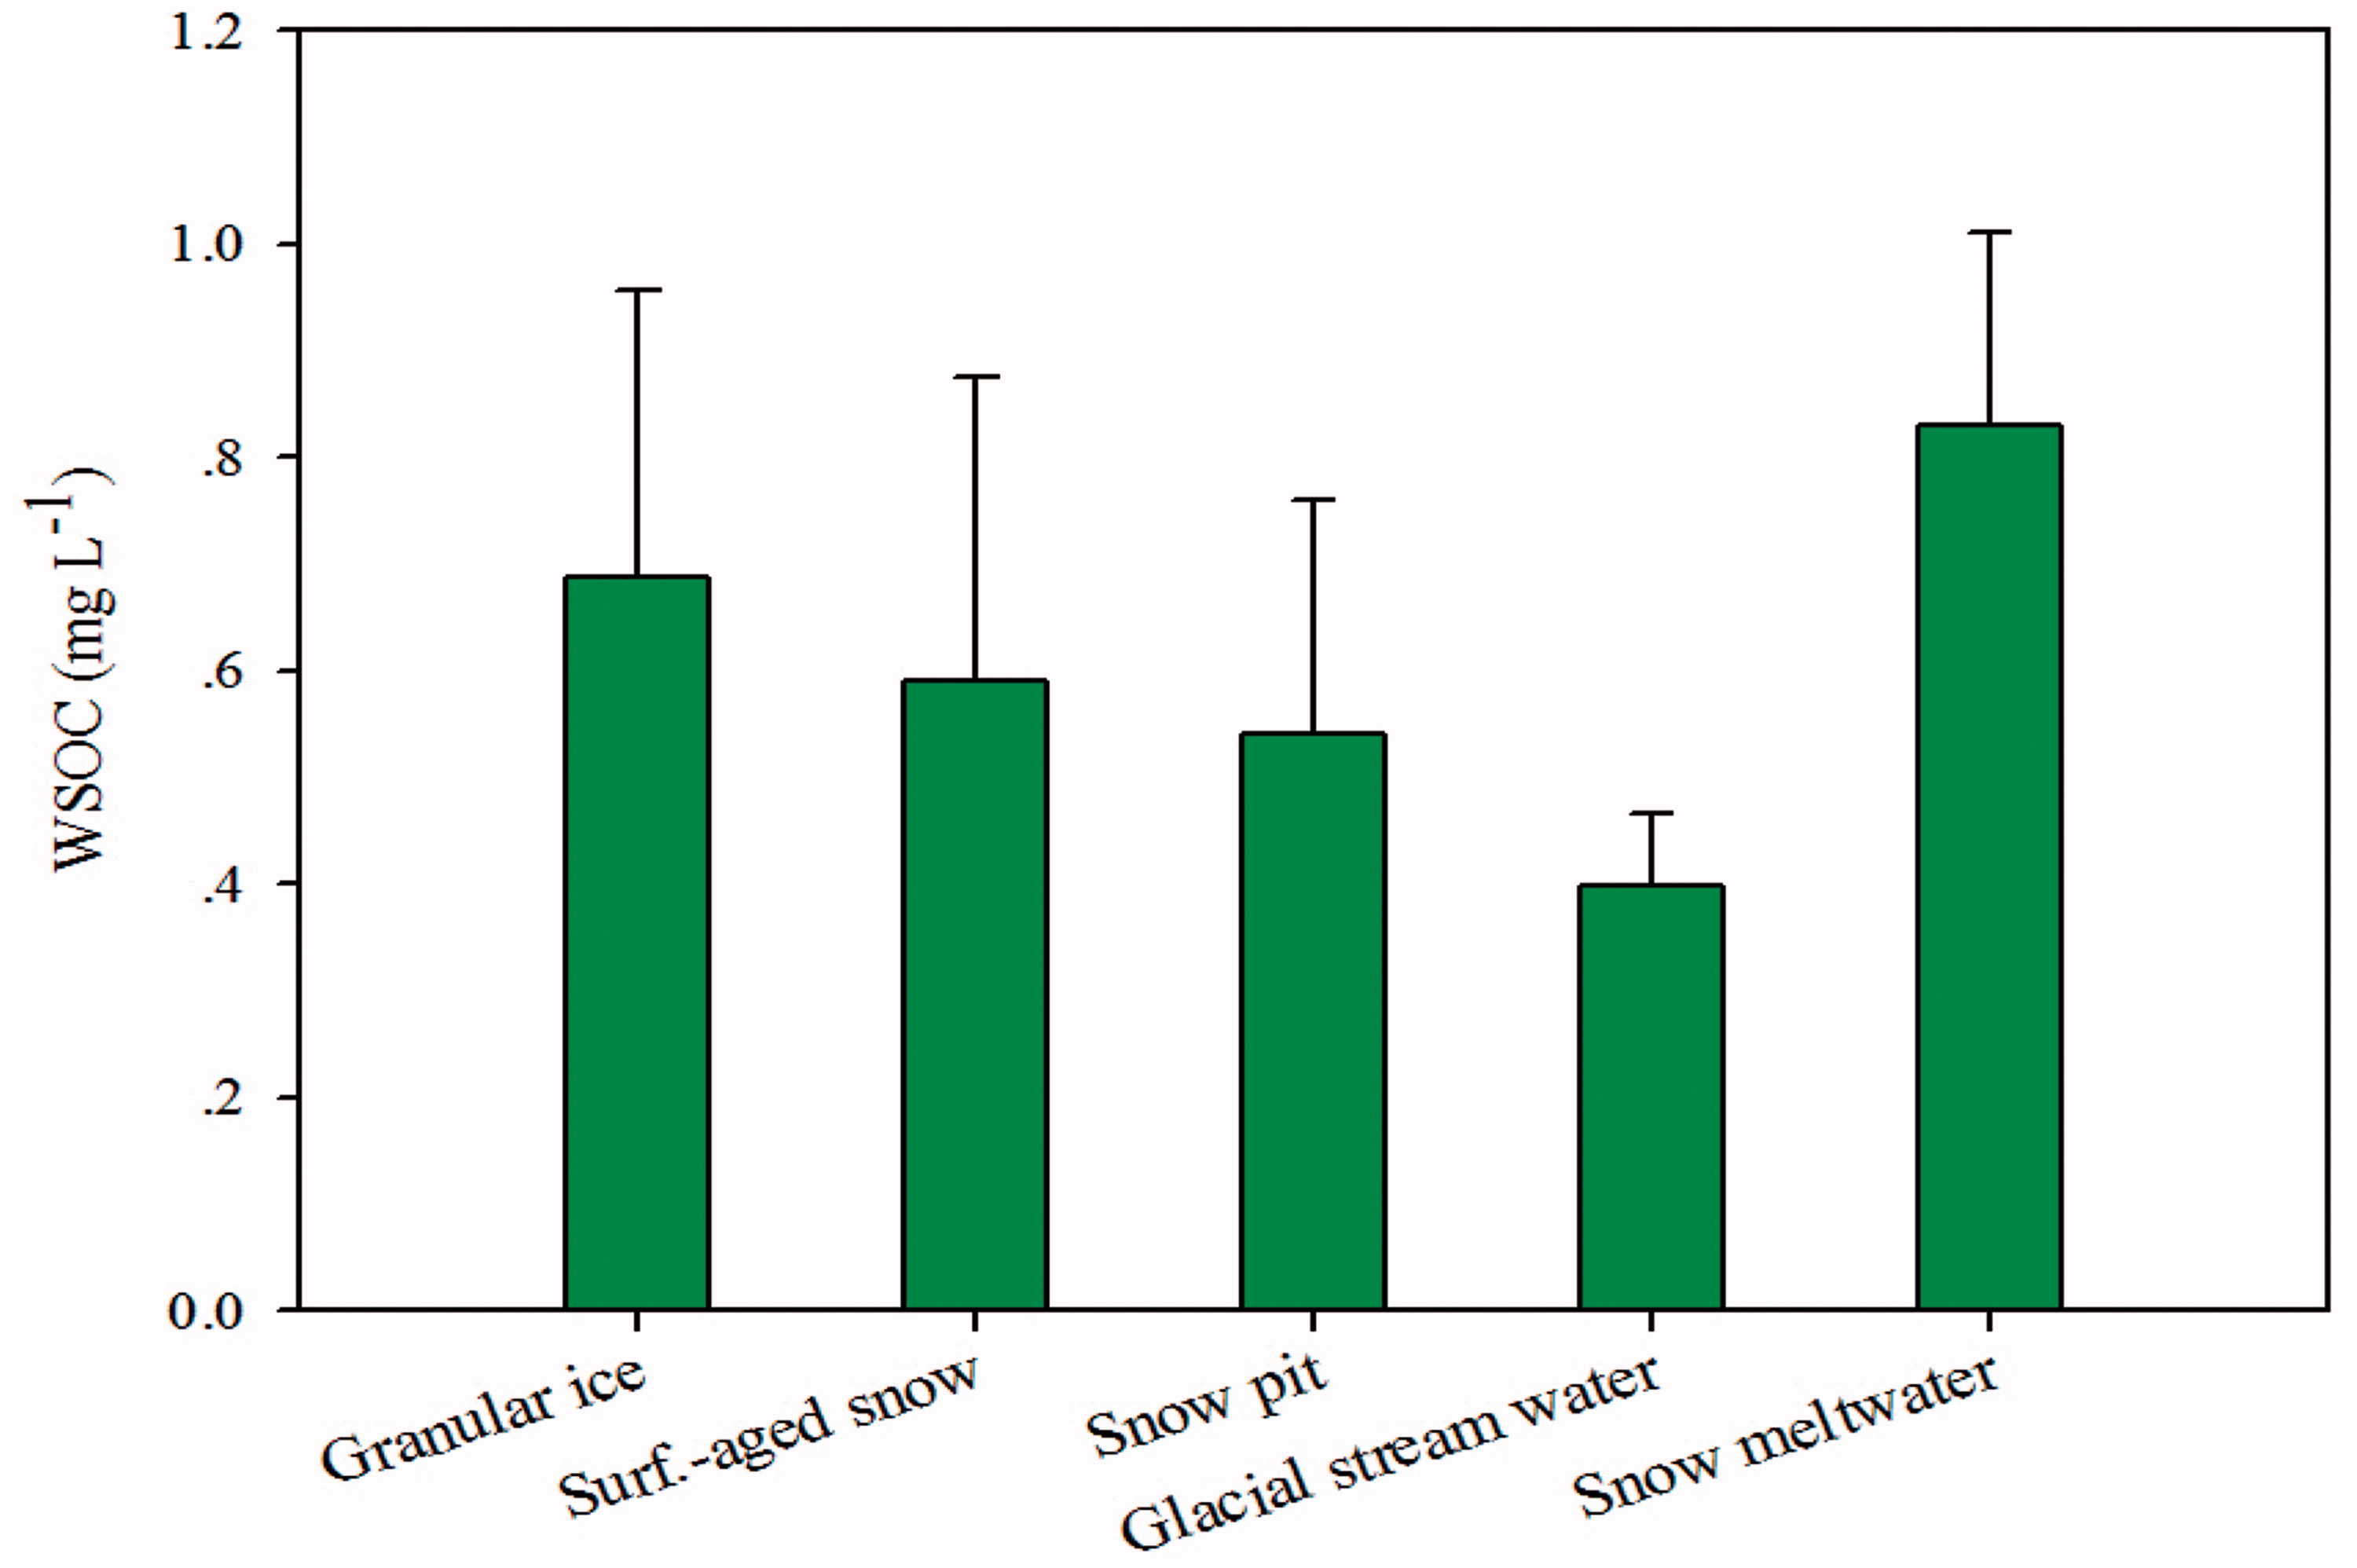
Fig. 2.
Average WSOC concentrations in snow, ice, and meltwater from Baishui glacier.
Table 2.
Water-soluble organic carbon (WSOC) and insoluble particulate carbon (IPC) concentrations (mg L−1) and WSOC/TC in snow, ice, and meltwater on Mt. Yulong and the comparison of WSOC, IPC concentrations with those from other glacial regions.
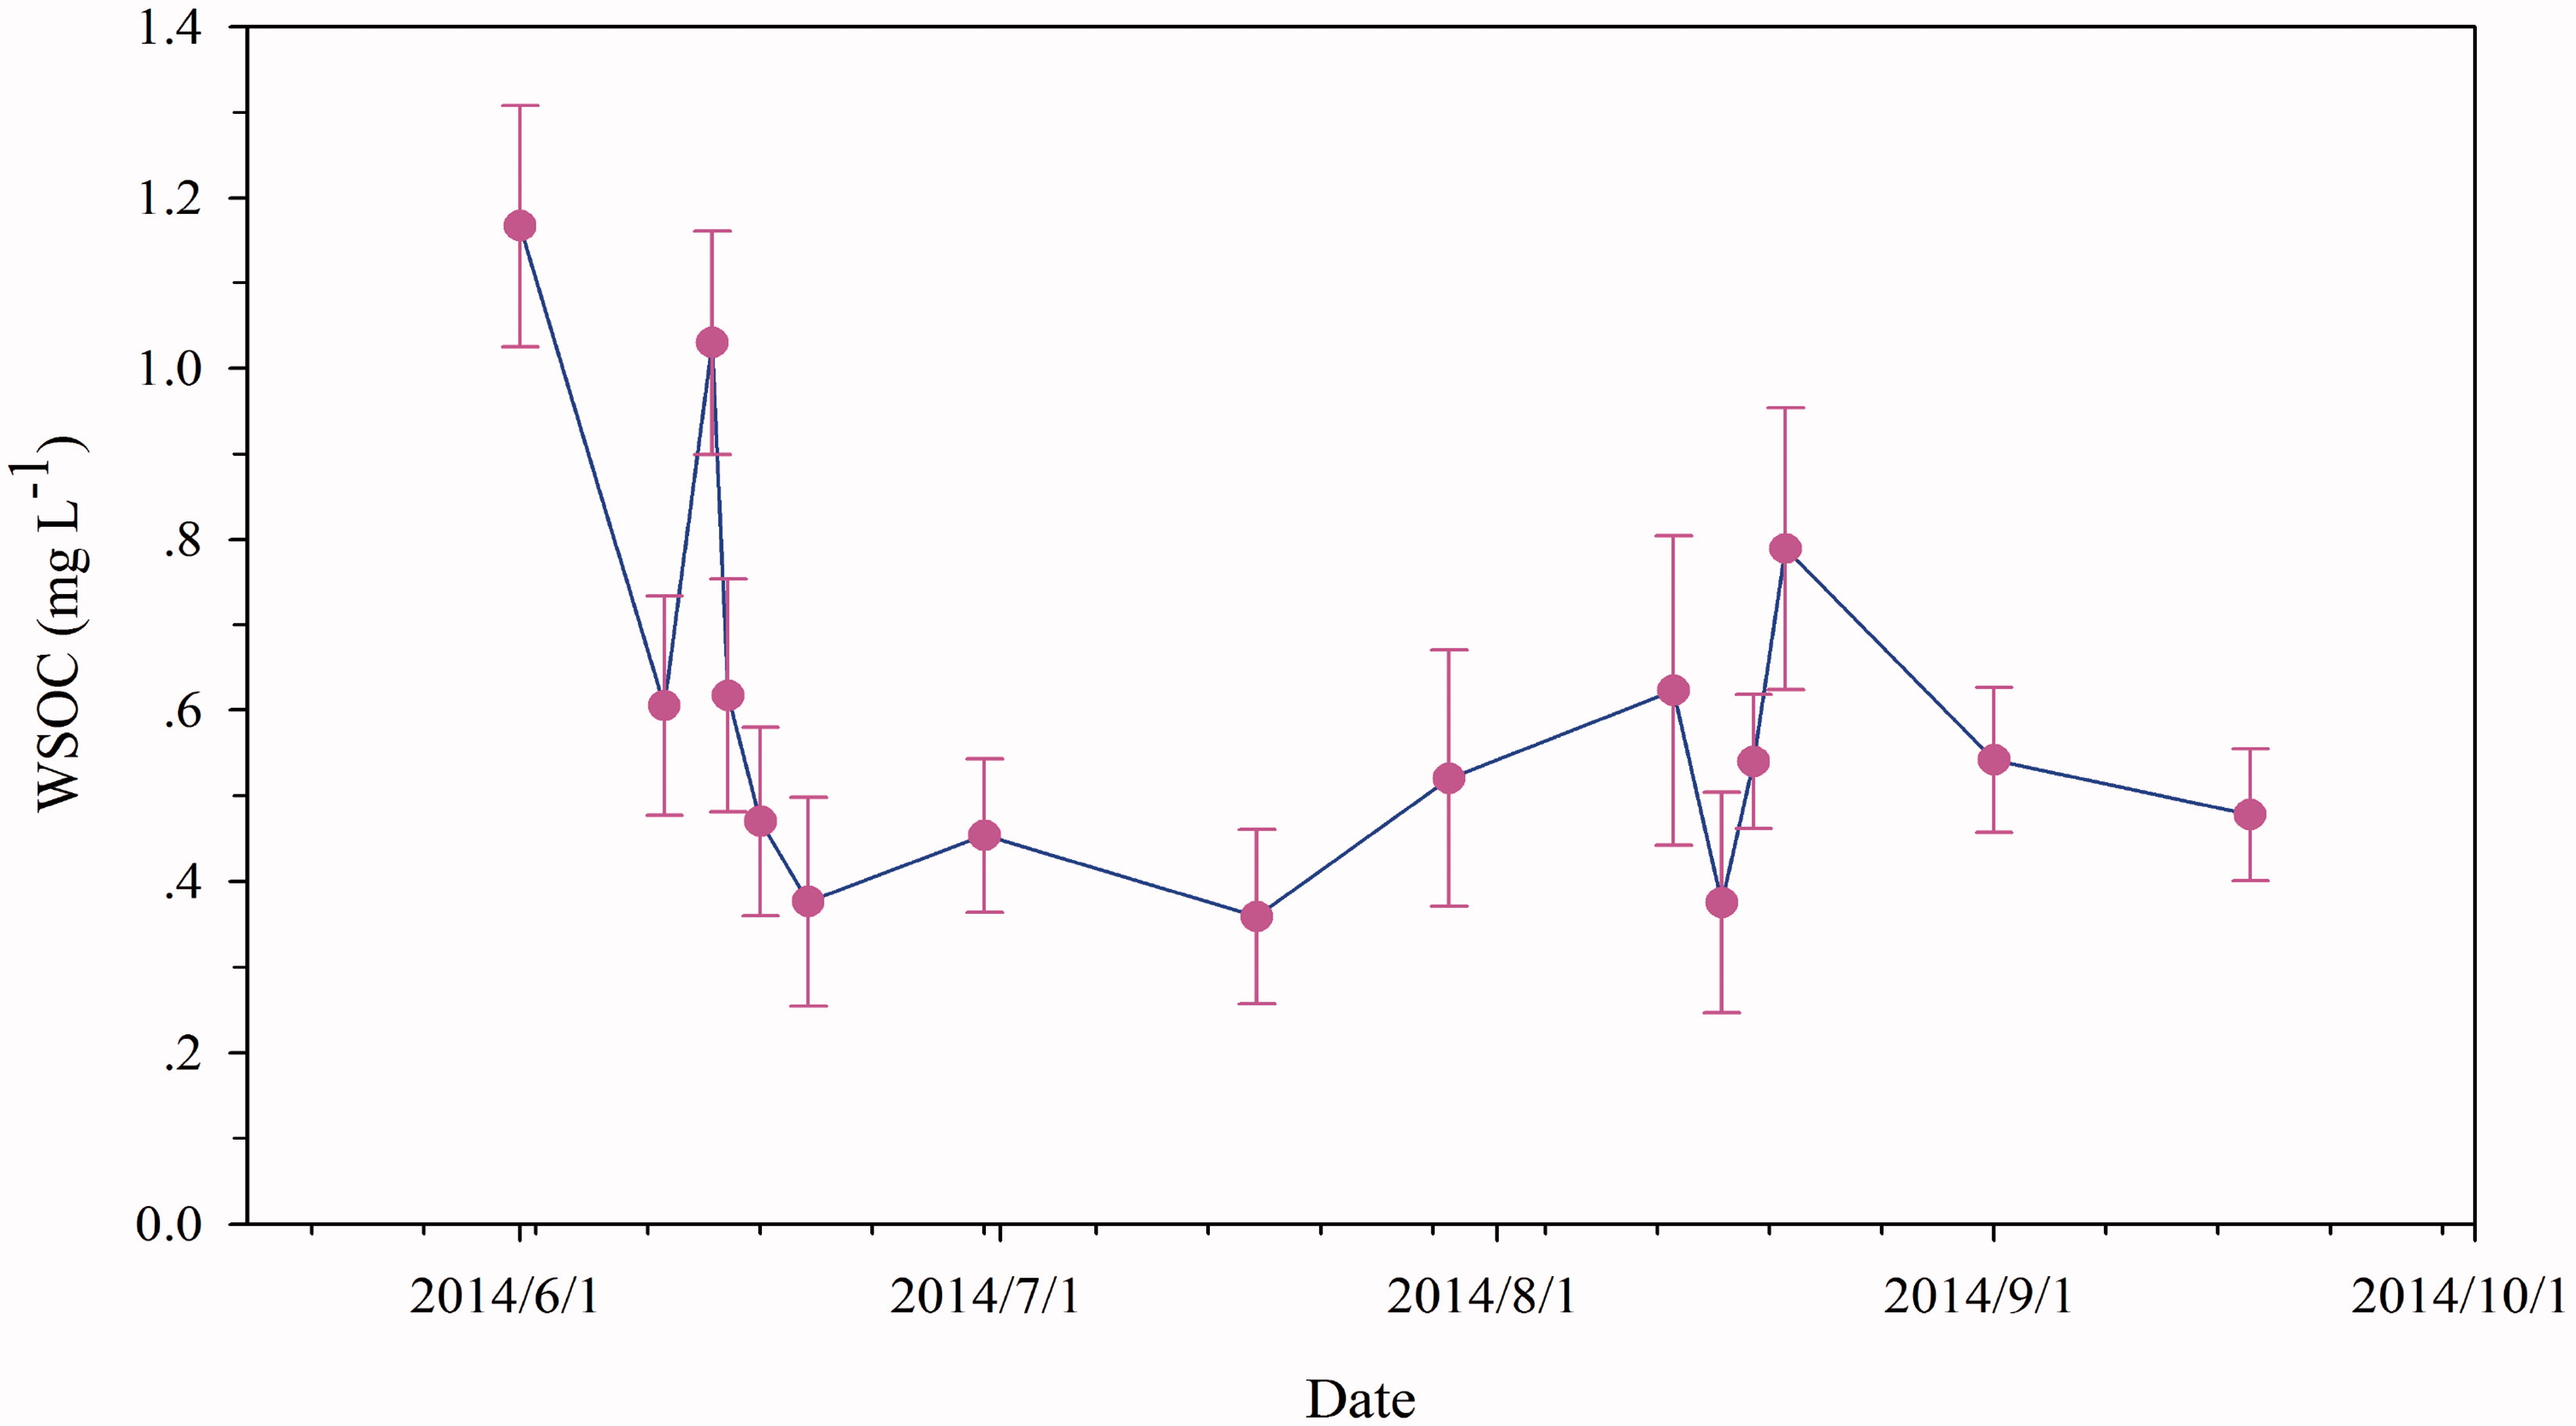
Fig. 3.
Depletion of WSOC concentrations in surface aged snow during the monsoon season.
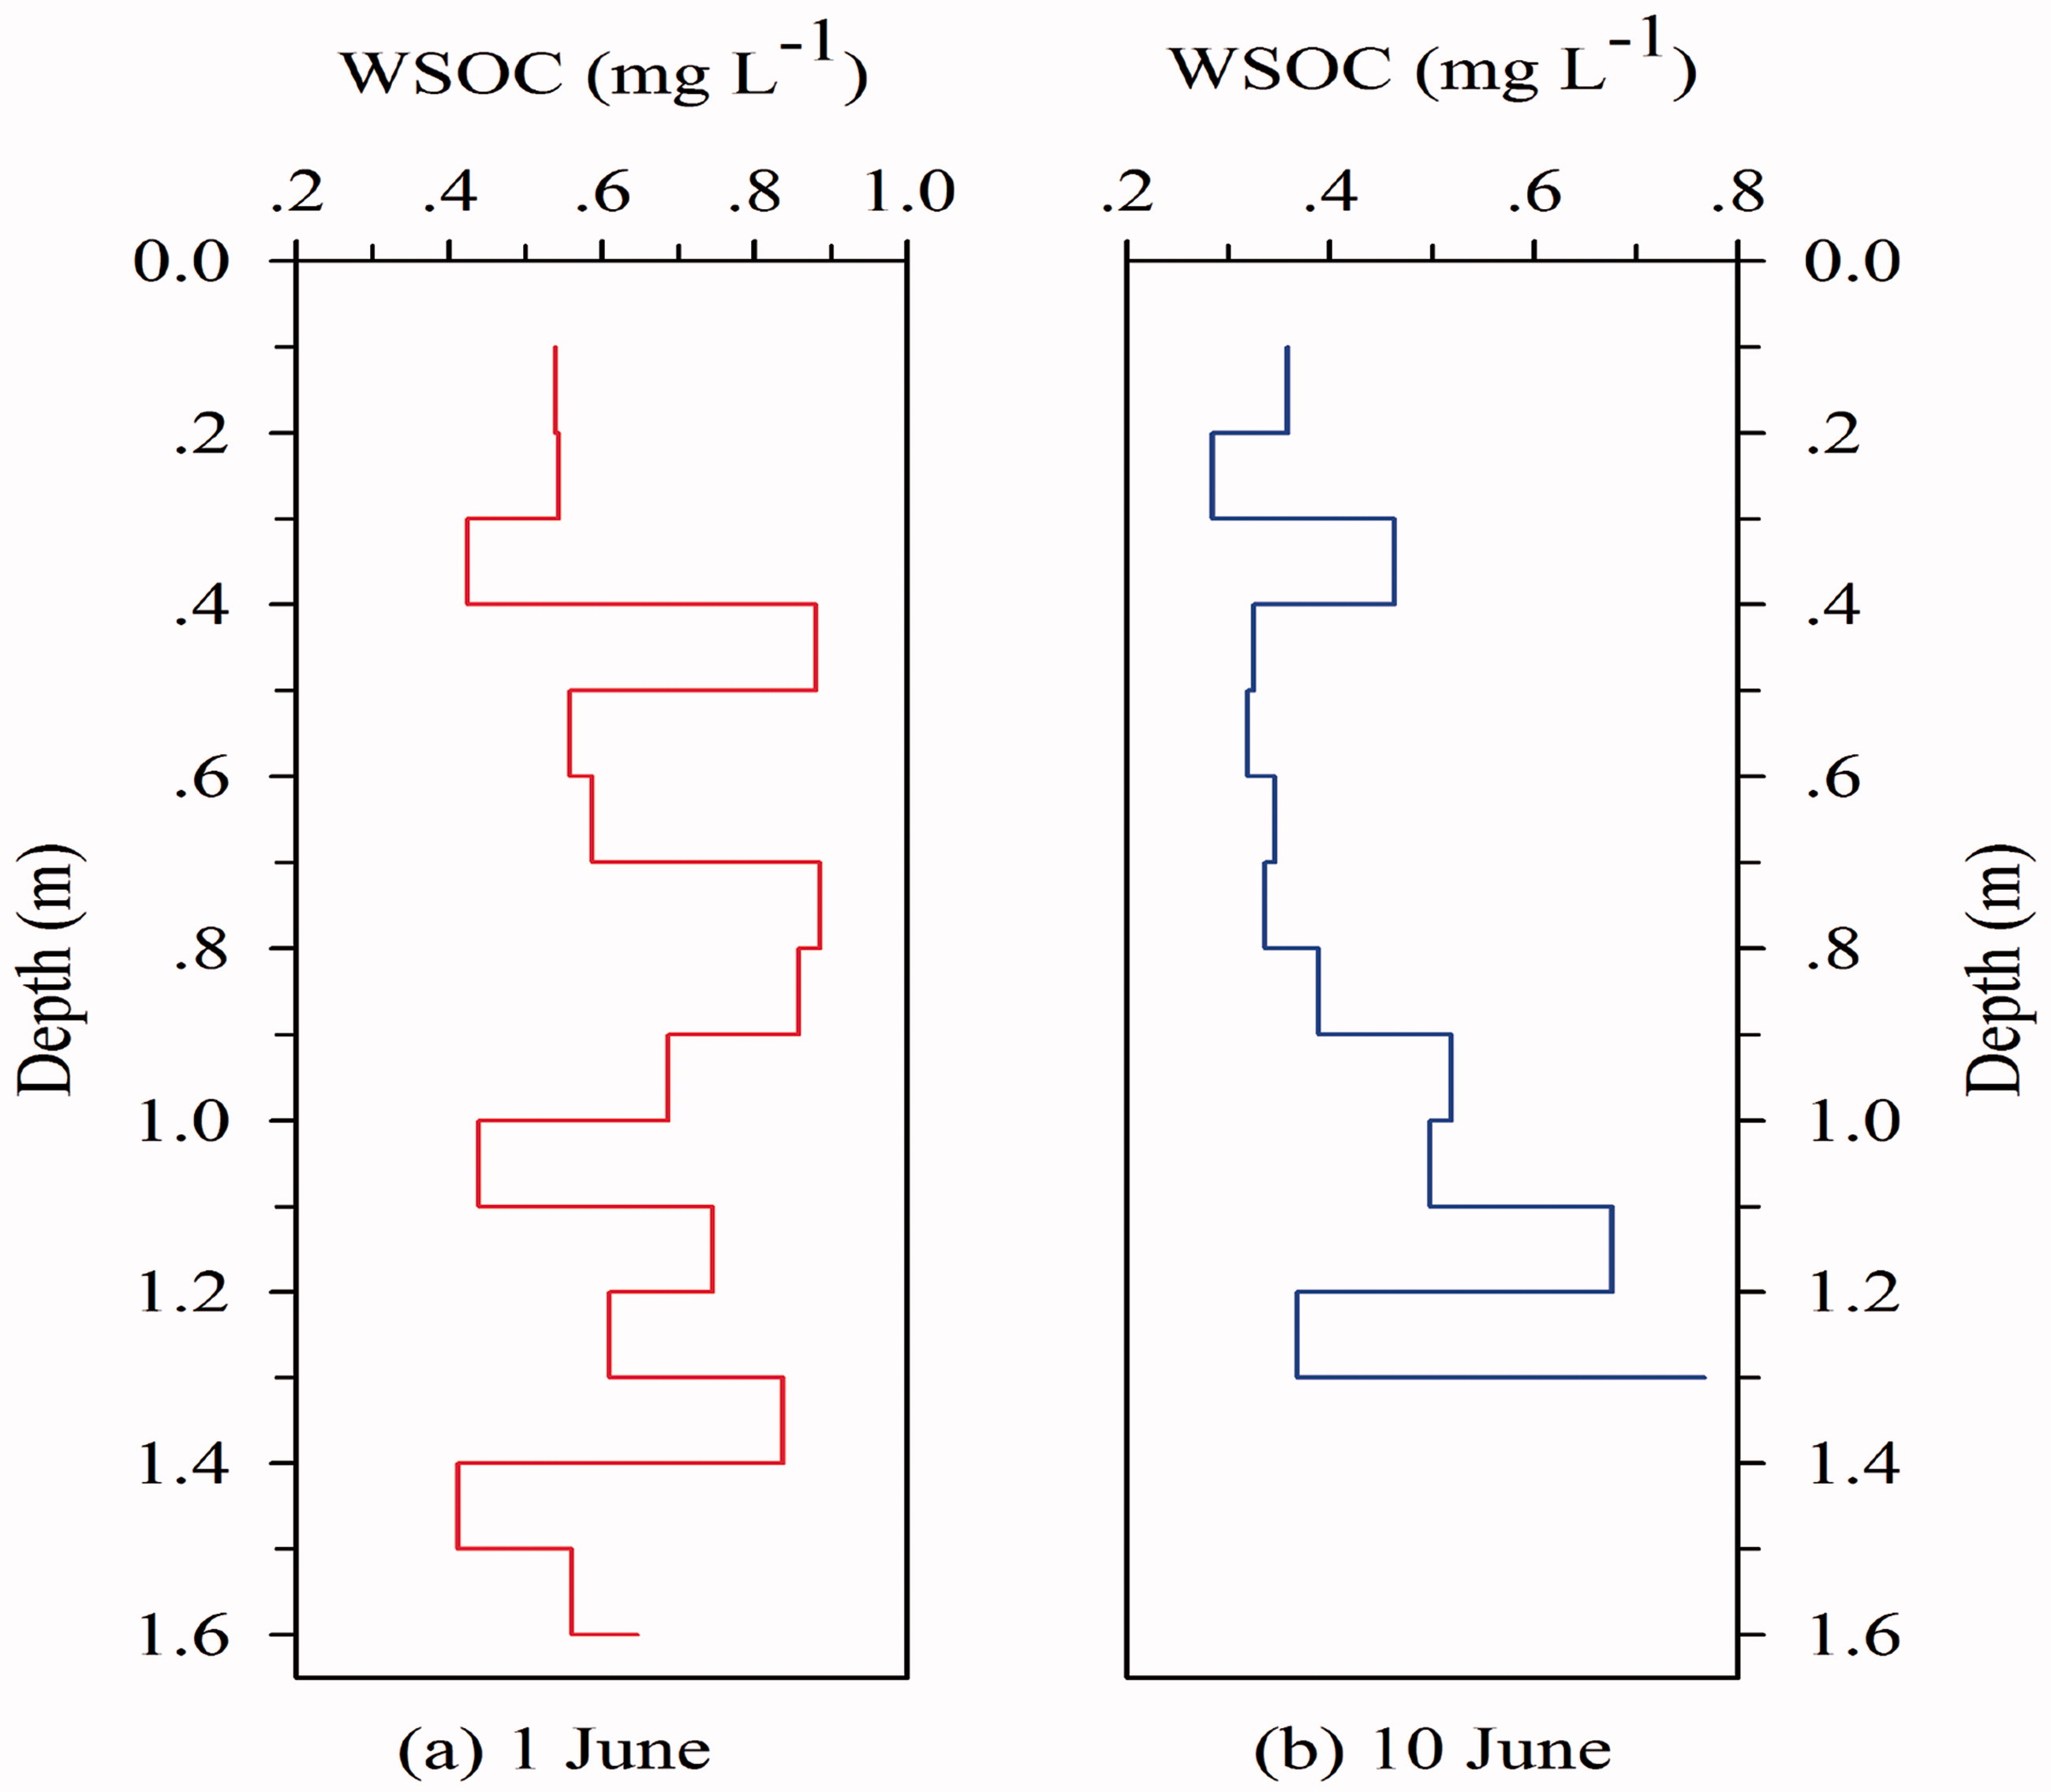
Fig. 4.
Vertical distribution of the WSOC concentrations in snow pits (excavated on (a) 1 June and (b) 10 June, 2014).
Table 3.
Mass absorption cross section (MAC) of WSOC and absorption Ångström exponent (AAE330–400) of snow and ice from Mt. Yulong and of carbonaceous aerosols from other regions. λ represents the wavelength at which MAC of WSOC was measured.
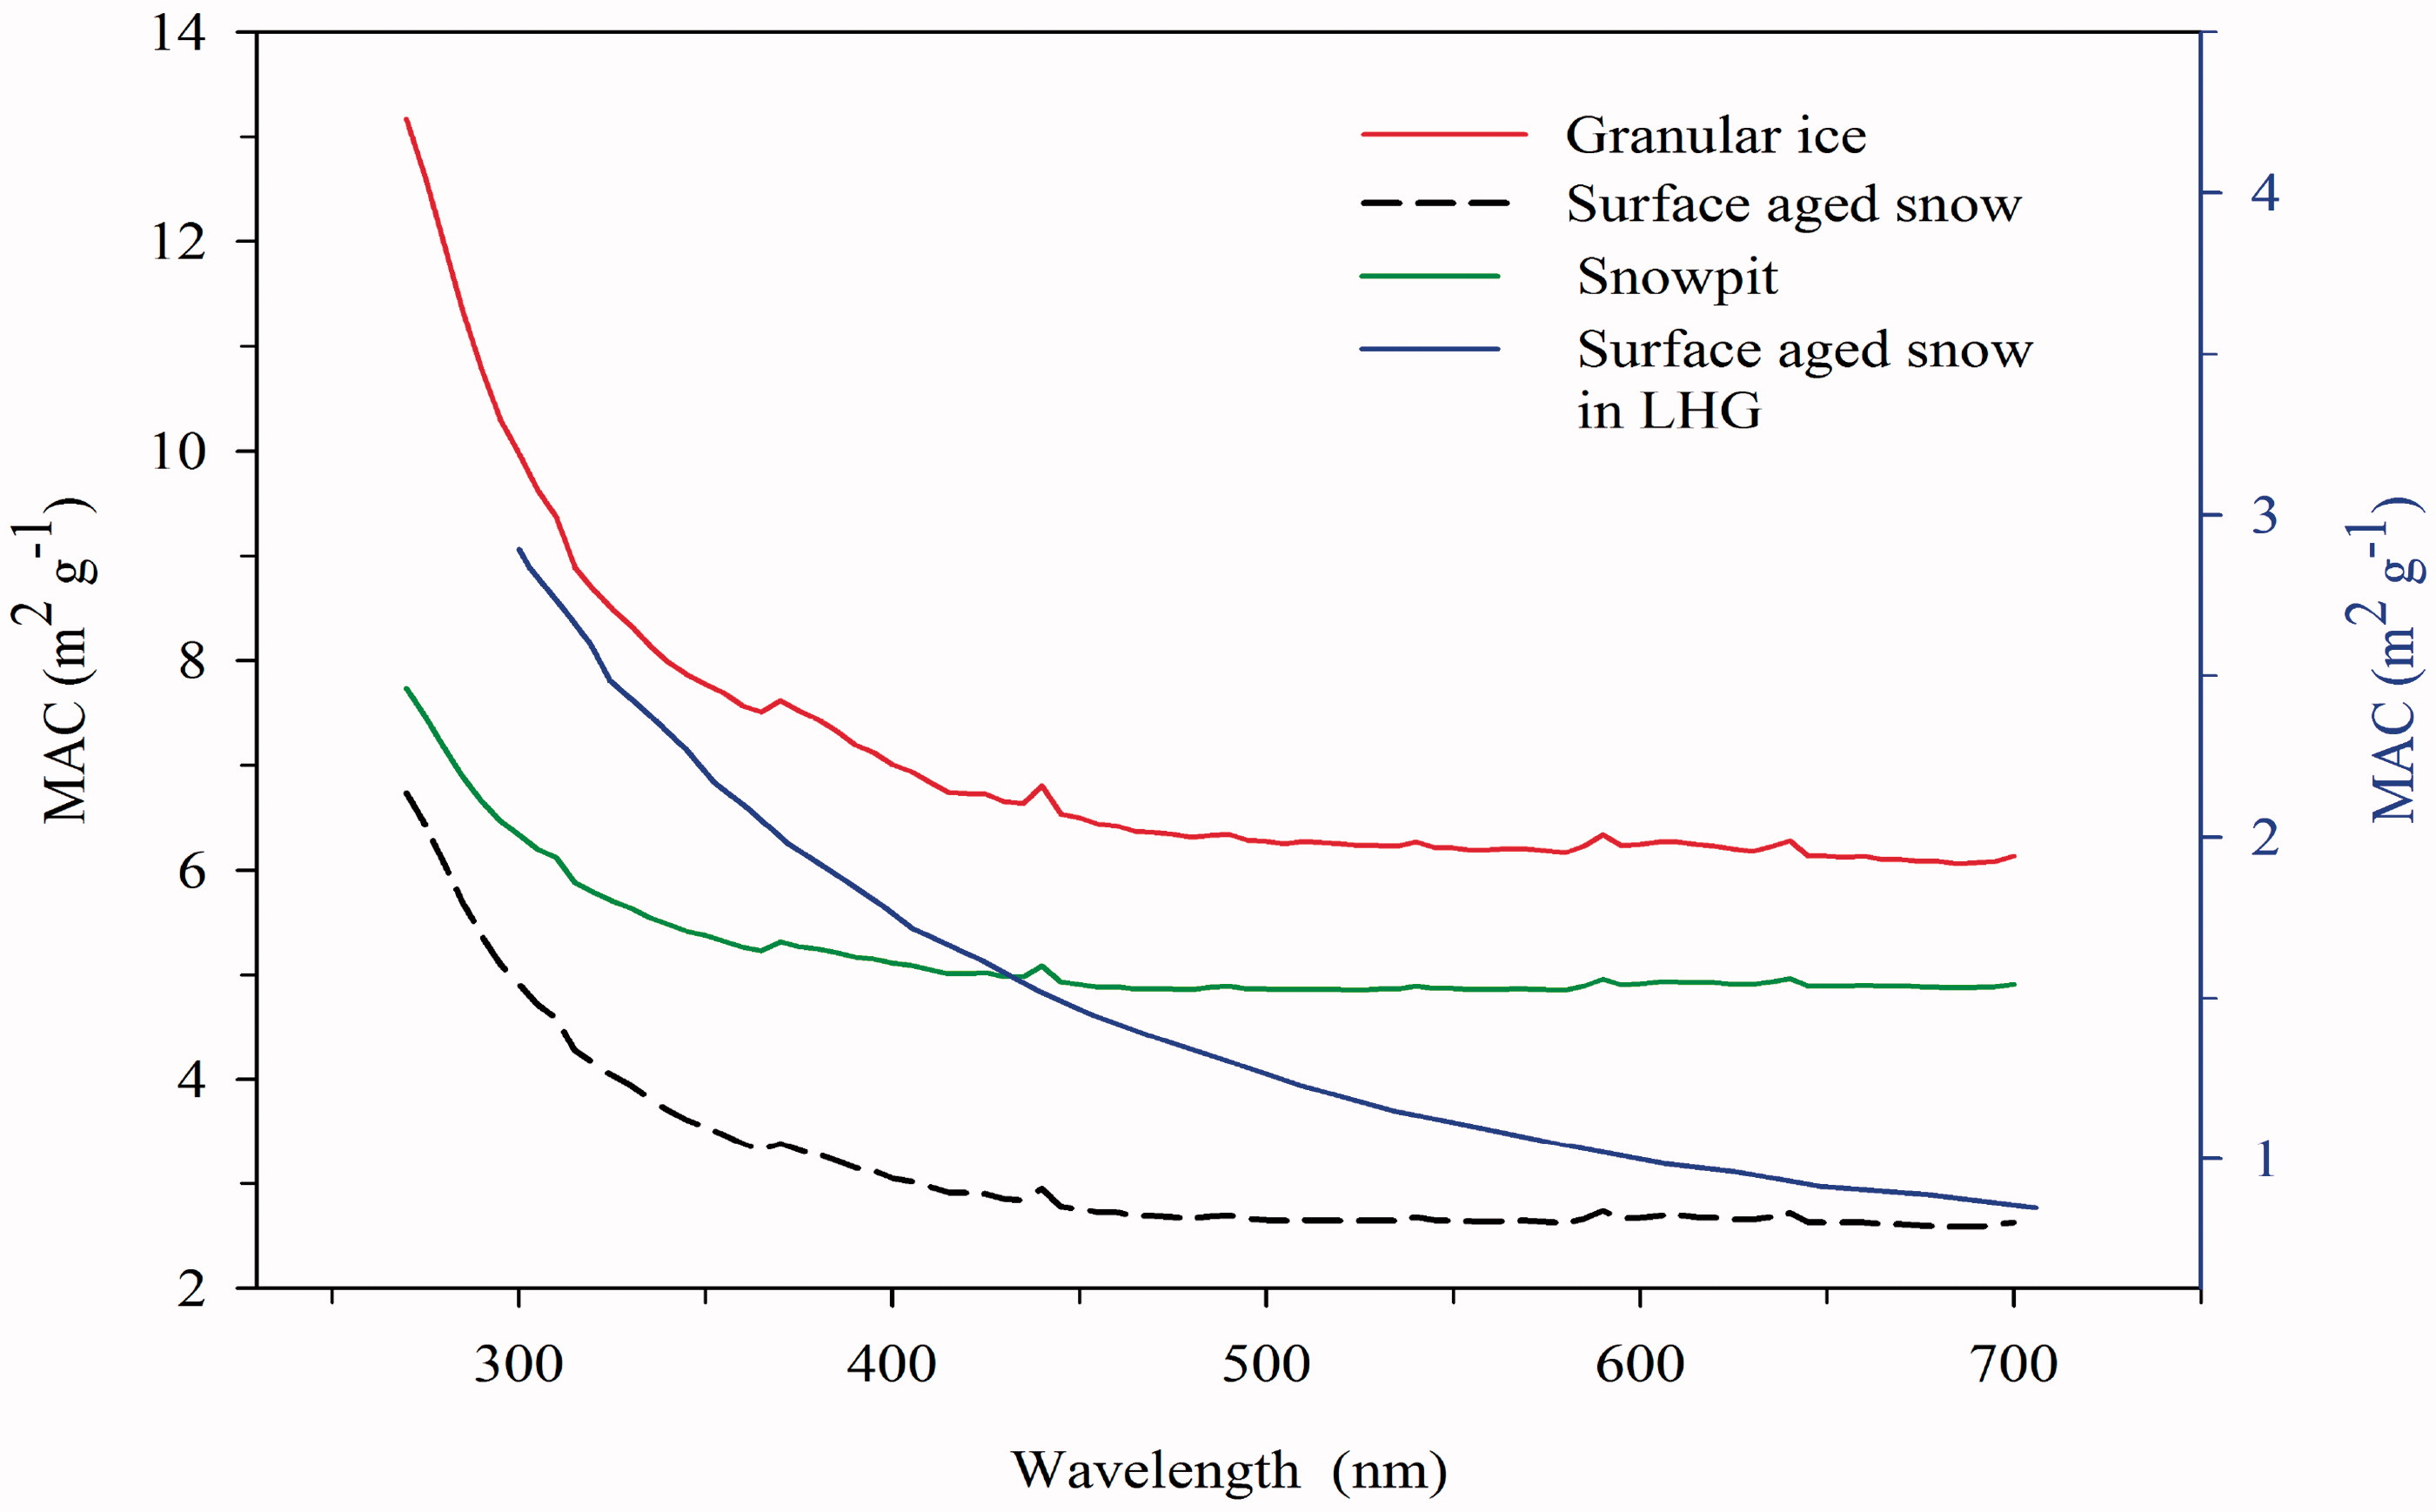
Fig. 5.
Correlations of wavelength and MACwsoc in snow and ice on Baishui glacier and LHG glacier.
Table 4.
Results of principle component analysis (PCA) carried out on WSOC and major water-soluble inorganic ions in snow pits samples: factor loading (F1, F2, F3), eigenvalues and percentual explained variance. The numbers in the table represent the percent of variance associated with each major ion. Negative values indicate an inverse relationship.
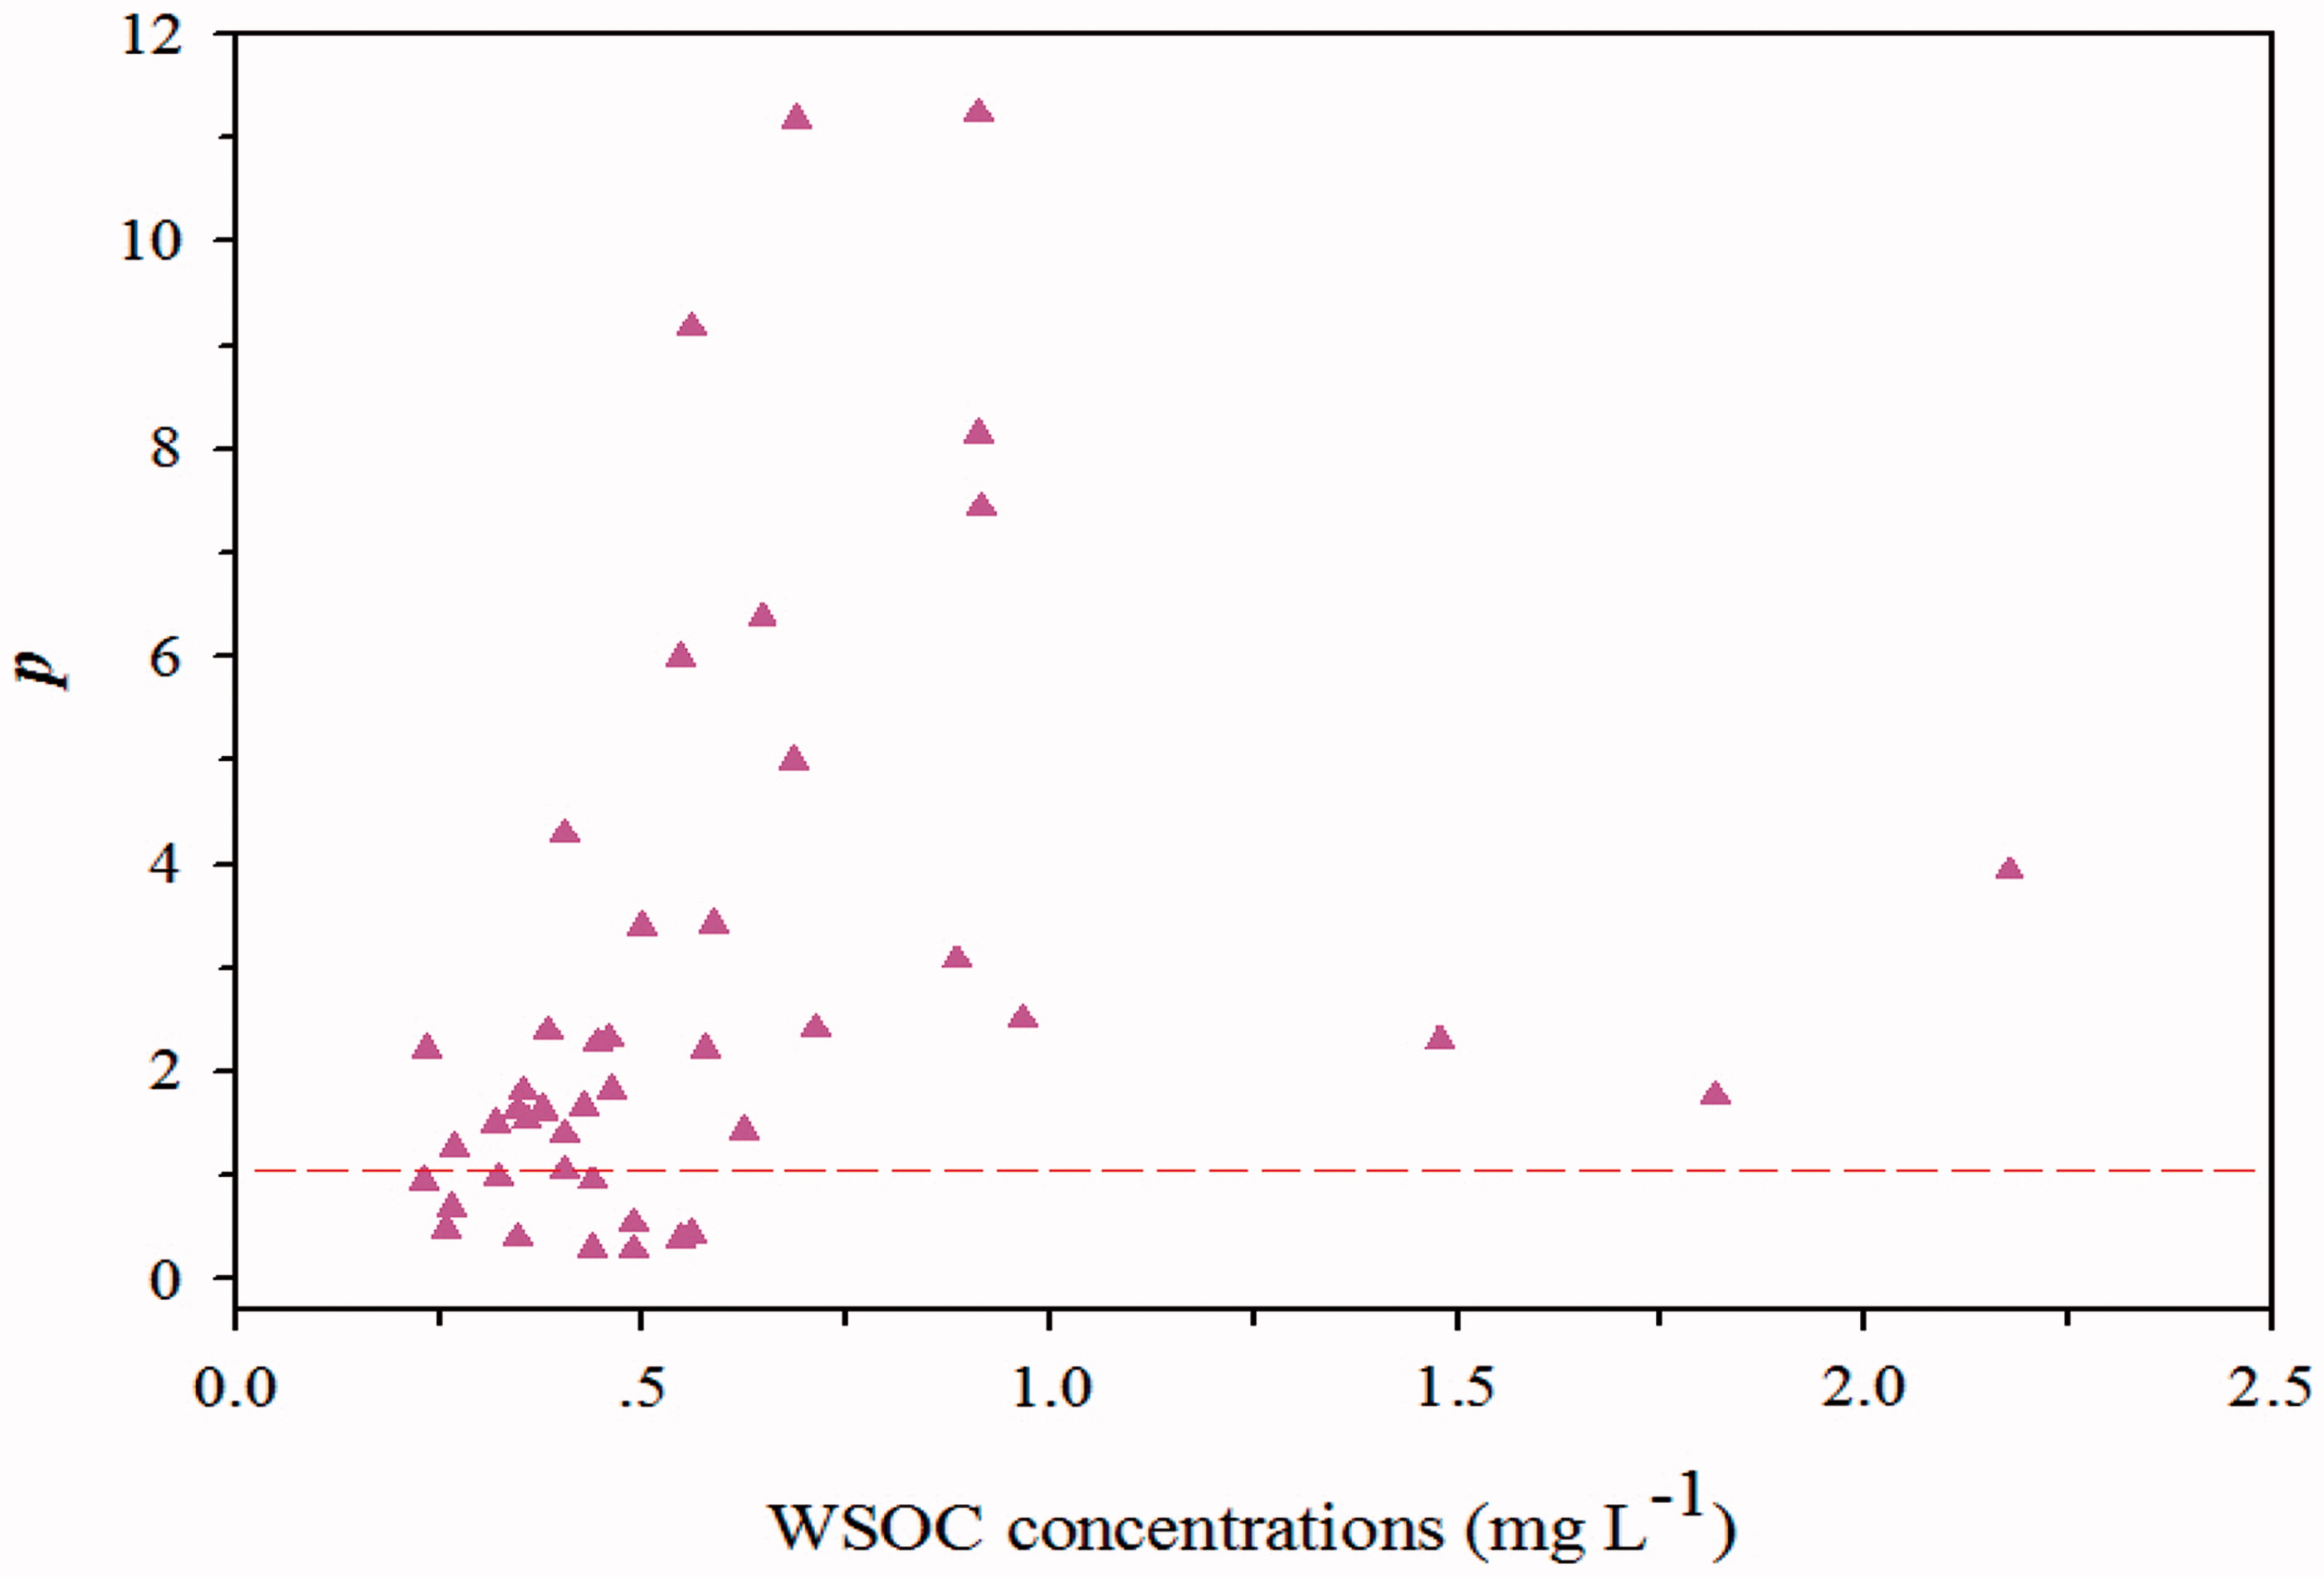
Fig. 6.
Relative light absorbance of WSOC and BC (p) versus WSOC concentrations.