
Introduction
1.
Water soluble organic carbon (WSOC) constitutes a major fraction (20–80%) of the organic carbon in glacierized regions, and has important influences on the energy budget and radiative forcing of glaciers (Ram et al., 2010; Khare et al., 2011; Pavuluri et al., 2011; Legrand et al., 2013a; Kirillova et al., 2014a,b; Yan et al., 2016). Mountain glaciers and ice sheets cover 11% of the land surface on Earth and store 6 petagrams of organic carbon (OC), the majority of which is WSOC (Hood et al., 2015; Yan et al., 2016). Global warming and glacier mass loss causes 13% of annual flux of WSOC in glaciers (Hood et al., 2015). Glaciers represent a unique ecosystem and biome that possess potential implications for the biogenic system close to glacial runoff (Hood et al., 2009, 2015; Anesio and Laybourn-Parry, 2012), the global carbon cycle (Hodson 2008; Li et al., 2016a), and sea level variations (Jacob et al., 2012). Glacier ecosystem accumulates OC from in-situ primary production as well as from the deposition of impurities derived from anthropogenic and natural sources (Singer et al., 2012; Stibal et al., 2012). OC records in glaciers are of great significance to global carbon dynamics, snow photochemistry, and air-snow exchange processes (Antony et al., 2011; Niu et al., 2017a). It was also known that photochemical reactions of OC in snow and ice can release reactive gaseous species into the overlying atmosphere (Guimbaud et al., 2002; Grannas et al., 2004; Niu et al., 2017b).
Carbonaceous matter contained in glaciers and ice sheets includes WSOC and insoluble particulate carbon (IPC) (Legrand et al., 2013a; Li et al., 2016a). The characteristics of WSOC can reflect the quality of atmospheric environment so that it was used as a proxy to study past anthropogenic influence on the atmospheric load and composition of organic compounds/matter at the glacial region ( Legrand et al., 2013a, b ). IPC is an indispensable component of the carbonaceous matter (Hood et al., 2015; Li et al., 2016a), although it is stable relative to WSOC in terms of chemical property. Hydrophilic WSOC and OC are released from glaciers through glacial meltwater that discharges at the glacier terminus into proglacial aquatic ecosystems and streams. Various WSOC and IPC present in snow cover and glaciers, and the physical and photochemical processes occurring within them, can have a great effect on atmospheric and glacier chemistry (Jones et al., 2001; Domine and Shepson, 2002; Grannas et al., 2007; Antony et al., 2011). Moreover, glacier ice represents a significant hydrological reservoir of OC that merits deep consideration in studies of evaluating and addressing riverine carbon cycles and dynamics (Schuur et al., 2008; Hood et al., 2015).
WSOC and IPC can significantly reduce glacier albedo and accelerate glacier melting by absorbing more solar radiation (Flanner et al., 2009; Doherty et al., 2013; Wang et al., 2015; Li et al., 2016a; Niu et al., 2017a, b). WSOC has been proven to be absorbing sunlight at ultraviolet wavelengths (200–800 nm) (Andreae and Gelencser, 2006; Chen and Bond, 2010; Cheng et al., 2011; Bosch et al., 2014; Li et al., 2016a), and the radiative forcing caused by WSOC was estimated to account for 2–10% relative to black carbon (BC) in atmospheric aerosols in a typical pollution area of North China (Kirillova et al., 2014a) and about 10% at Laohugou (LHG) glacier, northern Tibetan Plateau (TP) (Yan et al., 2016). Mountain glaciers were proposed as dominating the release of WSOC from glaciers around the world (Hood et al., 2015), whereas WSOC accounts for a large fraction of carbonaceous matter (Psichoudaki and Pandis, 2013; Legrand et al., 2013a; Hood et al., 2015) and potentially to the radiative forcing.
Studies on concentrations, sources, light absorption properties, and historical variations of WSOC have been conducted at glaciers in the Qilian mountain (Yan et al., 2016, 2015), Arctic (Hood et al., 2009; Stubbins and Dittmar, 2012), European ice core (Singer et al., 2012; May et al., 2013; Legrand et al., 2013b), and Antarctic (Lyons et al., 2007; Antony et al., 2011; Legrand et al., 2013a). However, the relevant dataset on WSOC is sparse in the TP (Spencer et al., 2014; Yan et al., 2015; Li et al., 2016a, b; Niu et al., 2017b) because of the harsh environmental and logistical difficulties. The TP, also called ‘the Third Pole’ of the world (Xu et al., 2009; Yao et al., 2012a), is one of the most remote and isolated regions in the world, and holds the largest quantity of glaciers at middle latitudes (Li et al., 2016a). Deposition of carbonaceous matter on the glacier has caused notable changes in climate (Lau et al., 2010; Bond et al., 2013) and shrinking of most of the glaciers in the TP (Wang et al., 2015; Li et al., 2016a; 2017; Niu et al., 2017a). Mt. Yulong, located in southeastern TP, is one of the typical high-mountain glacial area, large numbers of temperate glaciers are widely distributed on it. Glaciers at high altitudes are sensitive indicators of climate change and natural archives of variations in impurities’ deposition (Niu et al., 2016b). The retreat of glaciers would cause an increase in the export of carbonaceous matter out of the glacial basin, which have obvious impact on livelihood of a large portion of the Earth’s population (Gertler et al., 2016) and ecosystems (Li et al., 2016a), particularly for those residing downstream of the snowmelt runoff (Paudyal et al., 2016). Therefore, it is urgently needed to conduct the distribution and characteristics of WSOC in snow of glaciers on Mt. Yulong, southeastern TP.
In this study, we:(1) primarily focus on the light absorption property of WSOC in a typical temperate glacier, this is a first report on the WSOC and its optical characteristics in glaciers from Mt. Yulong; (2) provide information on general concentrations of WSOC and IPC in snow and ice; (3) the depletion processes of WSOC in snowpacks; and (4) discuss the fluxes of WSOC and IPC, and the implications of carbonaceous matter for glacial melting. The results of this study will provide a basis for quantitative evaluation of WSOC and the relevant carbon dynamics/cycles across the TP and even other regions.
Study area
2.
The area of the study is Baishui glacier in the Mt. Yulong. Mt. Yulong (26°59′-27°17′ N, 100°04′-100°15′ E) is located in southeastern TP (Fig. 1). The elevation of Mt. Yulong is generally 4000 m asl (the highest peak over 5500 m asl). Baishui glacier is one of the typical temperate glaciers that have larger energy fluxes compared to inland glaciers in the TP, particularly at lower snow-covered elevations. Limestone and sandstone are the primary lithologies in the Mt. Yulong region.
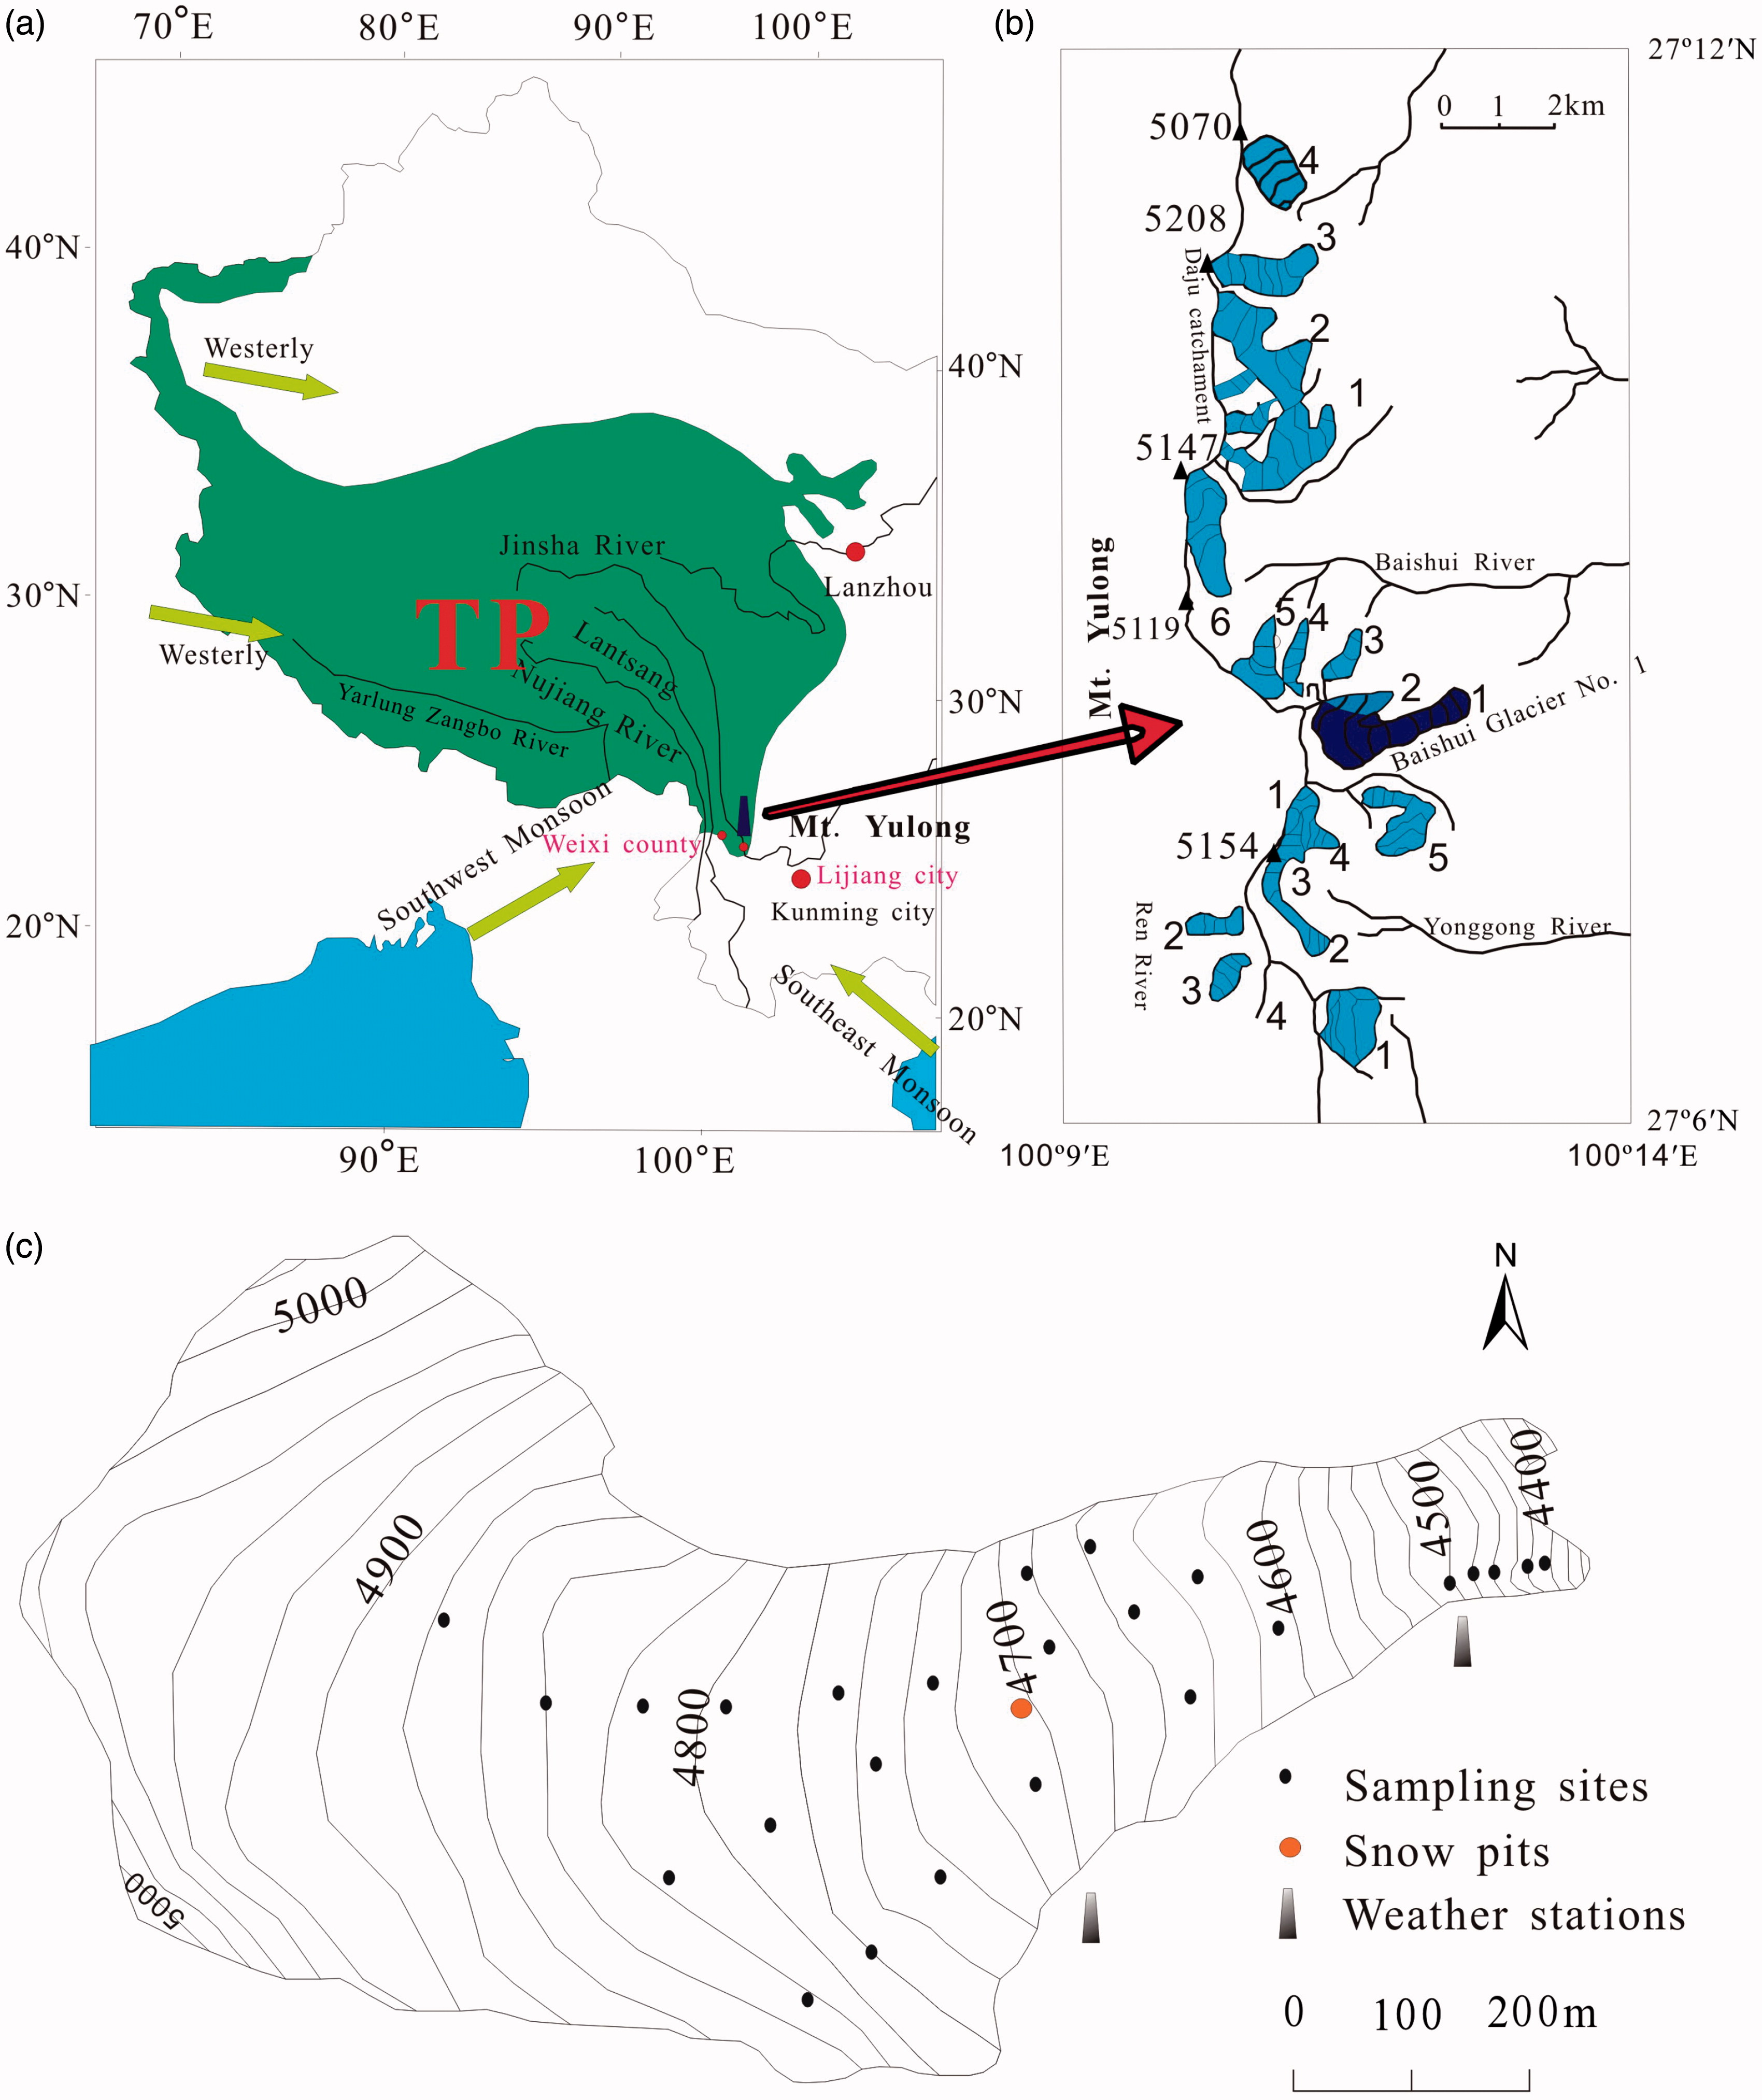
Fig. 1.
The location of Mt. Yulong and the sampling sites on Baishui glacier.
The Mt. Yulong region has two distinct seasons: the monsoon or rainy period (June–September) and the non-monsoon or dry period (October–May) (Niu et al., 2014, 2016, 2017b). In the monsoon season, much moisture and heat is transported from the Indian and Pacific oceans by the intense Indian summer monsoon and East Asian summer monsoons (Nie et al., 2017). During the non-monsoon season, the region is under the control of the southern limb of westerlies, and nearly no rainfall events occur. The maximum thickness of snow cover that accumulated in the non-monsoon season in Mt. Yulong is nearly 3.5 m, and it is extensively melted in the monsoon season due to high temperatures and frequent rainfalls. The Equilibrium Line Altitude (ELA) of Baishui glacier in Mt. Yulong is now approximately 4900 m, during recent years, glacial melting and shrink has occurred at an accelerated rate (Du et al., 2015; Niu et al., 2017a). Baishui River is located at the downstream of Baishui glacier, summer rainfall, and glacial meltwater are the main water resources that constituted the runoff of Baishui River.
The average temperature in the monsoon season (5.08 °C) was absolutely higher than that in the non-monsoon season (−3.67 °C). Similarly, the relative humidity in the monsoon season (90%) is also significantly higher than it was in the non-monsoon season (59%).
Materials and methods
3.
Sampling and analytical techniques
3.1.
Surface aged-snow and granular ice samples were collected from different elevations (ranged from 4340 to 4825 m asl) on Baishui glacier mostly in the melt season in 2014. Meltwater of surface snow on glacier was collected along the tributary from the glacier terminus to the upper ablation zone during the extensive melting period. Glacial stream water was collected from miniature streams on glacier surface during the extensive melting season. Two snow pits were excavated on 01 June and 10 June 2014, at the same site with an elevation of 4700 m asl on Baishui glacier. Maximum depth of the two snow pits were 1.6 m (excavated on 01 June) and 1.3 m (excavated on 10 June). Snow pit samples were immediately collected as soon as the pits were excavated, and samples were collected continuously at 10 cm depth intervals from the bottom to the top. Detailed information of sample collection is summarized in Table 1. Air temperature at the glacier surface was measured using a portable temperature transducer. The average temperature at the glacier surface was 0.3 °C on Mt. Yulong, when Baishui glacier has been experiencing extensive ablation.
Table 1.
Various snow, granular ice, and meltwater samples collected from Baishui glacier in 2014 and a summary of the relevant information (number of samples, elevations of the sampling sites, and the measured parameters).
All samples were collected in 500 ml Whirlpak polyethylene bags (BFL-3070, LABPLAS, Canada) and kept frozen until they could be rapidly melted. Extreme care and stringent sampling protocols (i.e. the authors wore undefiled masks, gloves) were used at all times during sampling campaign. The polyethylene bottles used to load meltwater samples and small shovels were pre-cleaned with ultrapure water and disinfected in the laboratory at the State Key Laboratory of Cryospheric Science in Lanzhou city.
Every melted surface aged-snow and granular ice samples, meltwater sample (including snow meltwater, glacial stream water) were filtered using disposable needles-type filters (MN ChromafilR, PA-20, 0.20 μm, California, USA) before measuring WSOC concentrations. The WSOC concentrations were determined using a TOC-L analyzer (Shimadzu Corp, Kyoto, Japan) (Stubbins and Dittmar, 2012). Approximately, a volume of 8 ml filtered sample each time was used to detect WSOC concentrations. The detection limit of the analyzer was 0.015 mg L−1, and the average WSOC concentration of the blanks was 0.081 ± 0.017 mg L−1, indicating that contamination can be neglected during the pre-treatment and analysis processing of these samples. Specific method for the determination of WSOC has been reported in Niu et al. (2017b).
Various snow and granular ice samples and meltwater samples were also filtered using pre-combusted (at 550 °C for 6 hours) quartz fiber filter (47 mm in diameter, Whatman™, Manchester, UK) in the clean laboratory. After filtering, the quartz filters were wrapped with aluminum foil and were kept cold and stored. Moreover, the stored filters were dried in an oven for 6 hours before performing IPC analysis. The IPC collected on filtered quartz fiber filters was taken as samples not treated by NH4H2PO4 solution since there was no obvious difference for the two scenarios (Kuchiki et al., 2015; Li et al., 2016a). IPCs (BC and OC) on the filters were analyzed using a Desert Research Institute (DRI) Model 2001 thermal/optical reflectance carbon analyzer (Atmoslytic Inc., Calabasas, California). A temperature peak (550 °C) was designed to decrease measuring time. The measurement of carbon fractions is based on Improve A thermal/optical reflectance protocol. EC is usually used synonymously with BC (Xu et al., 2009; Cheng et al., 2011), we use EC as a proxy for BC. The applied heating conditions permitted the separation of BC portions in O2 (2%) and helium (98%) atmosphere and OC portions in a helium atmosphere (Wang et al., 2015; Niu et al., 2017a, c). The residence time of each heating step was defined by the flattening of the carbon signal. The results determined from our procedure are consistent with previous protocols. Detailed statement on the IPC’s analytical method was reported in Li et al. (2016a) and Niu et al. (2017a, c).
Moreover, the light absorption spectra of WSOC samples were determined by employing an ultraviolet-visible absorption spectrophotometer (SpectraMax M5, California, USA), scanning wavelengths from 200 to 800 nm at an interval of 5 nm (Yan et al., 2015, 2016). By measuring the absorbance, we assumed that the scattering contribution to spectral extinction is low (Kirillova et al., 2014b).
Water-soluble inorganic ions (NO3 -, Cl-, SO4 2-, K+, NH4 +, Ca2+, Na+, Mg2+) were determined using two ion chromatography (ICS-2500 and Dionex 600, Sunnyvale, CA). The IC systems Dionex 600 and ICS-2500 were used to determine cations and anions, respectively. The instruments were calibrated using standard cation and anion solutions (Dionex, Sunnyvale, California, USA). The detection limits for ion chromatography were 0.01–0.05μeq L−1. The IC analysis results were evaluated in terms of the reproducibility of the peak heights, peak retention times, and linearity of each calibration curve (Xu et al., 2015).
Methods for light absorption of WSOC
3.2.
The mass absorption cross-section (MAC) of WSOC (or MACwsoc ) (unit: m2 g−1) was computed according to the Lambert–Beer Law (Kirillova et al., 2014a, b; Yan et al., 2016).
Where I and I0 are the light intensity of incident light and transmitted light, respectively. C is the concentration of WSOC and L is the light path length (1 cm, for the quartz cuvettes used in measurements) and A is the absorbance measured by the spectrophotometer. The MAC of WSOC is presented for wavelength at 365 nm, this wavelength was chosen to avoid interferences from inorganic compounds (e.g. nitrate) and to enable comparison with previous results (Hecobian et al., 2010; Cheng et al., 2011; Kirillova et al., 2014a,b).
Absorption Ångström Exponent (AAE) was investigated to evaluate the wavelength (λ) dependence of the light absorption, of light absorbing WSOC, the AAE was deduced from the following relation:
AAEs were fitted within the wavelengths ranged from 330 to 400 nm, so as to avoid interference from other light absorbing inorganic matter (e.g. nitrate) (Cheng et al., 2011; Bosch et al., 2014; Kirillova et al., 2014b). This simple estimate is based on the assumption that AAE for WSOC measured at 330–400 nm represents the whole ultraviolet spectrum range, and no influences of scattering are included.
Light absorption of WSOC relative to BC (p)
3.3.
The amount of light absorption of WSOC relative to BC is assessed employing a simple model. BC is the most efficient light absorbing carbonaceous matter in the atmosphere (Ramanathan and Carmichael, 2008; Bond et al., 2013).
The fraction of solar energy absorbed by WSOC relative to BC (p) is evaluated as follows:
Where C indicates the concentration of WSOC, BCm is the measured BC concentrations (in ng g−1) in snow and ice of glaciers; MACBC indicates the mass absorption coefficient of BC. There are several values for MACBC reported in literatures (Bond and Bergstrom, 2006; Schwarz et al., 2013; Niu et al., 2017a). For our estimation, we used the MACBC 7.5 m2 g−1 to calculate BC absorption.
Results and discussion
4.
The chemical speciation of WSOC in snow and ice
4.1.
Statistical analyses were conducted to determine the general concentration characteristics of WSOC in snow and ice of glacier on Mt. Yulong. Fig. 2 presents the mean WSOC concentrations and the corresponding standard deviations of the five groups of snow, ice, and meltwater samples. Among the mean WSOC concentrations in the five groups of samples, glacial stream water had the lowest mean WSOC concentrations of 0.39 ± 0.08 mg L−1, whereas snow meltwater had the highest average WSOC concentrations at 0.83 ± 0.18 mg L−1. Higher mean WSOC concentrations in snow meltwater could be due to the deposition and accumulation of organic matter from the surface meltwater of the snow and granular ice on glaciers, and the elution (or percolation) effects played a notable role in contributing the higher WSOC contents in snow meltwater (Niu et al., 2017b). In addition, many types of organic compounds have been found to exist at high levels in the Arctic snowpack and to actively participate in snow photochemistry (Anderson et al., 2008). The direct photolysis in the upper layers of snowpack is probably responsible for the oxidation of organic compounds that have been deposited into the snow and glacier (Sumner and Shepson, 1999; Grannas et al., 2004). The photochemical activity of organic compounds somewhat constitutes an artifact in the budget of organic matter since part of it might have been photo-dissociated and re-emitted as gas phase in the atmosphere.
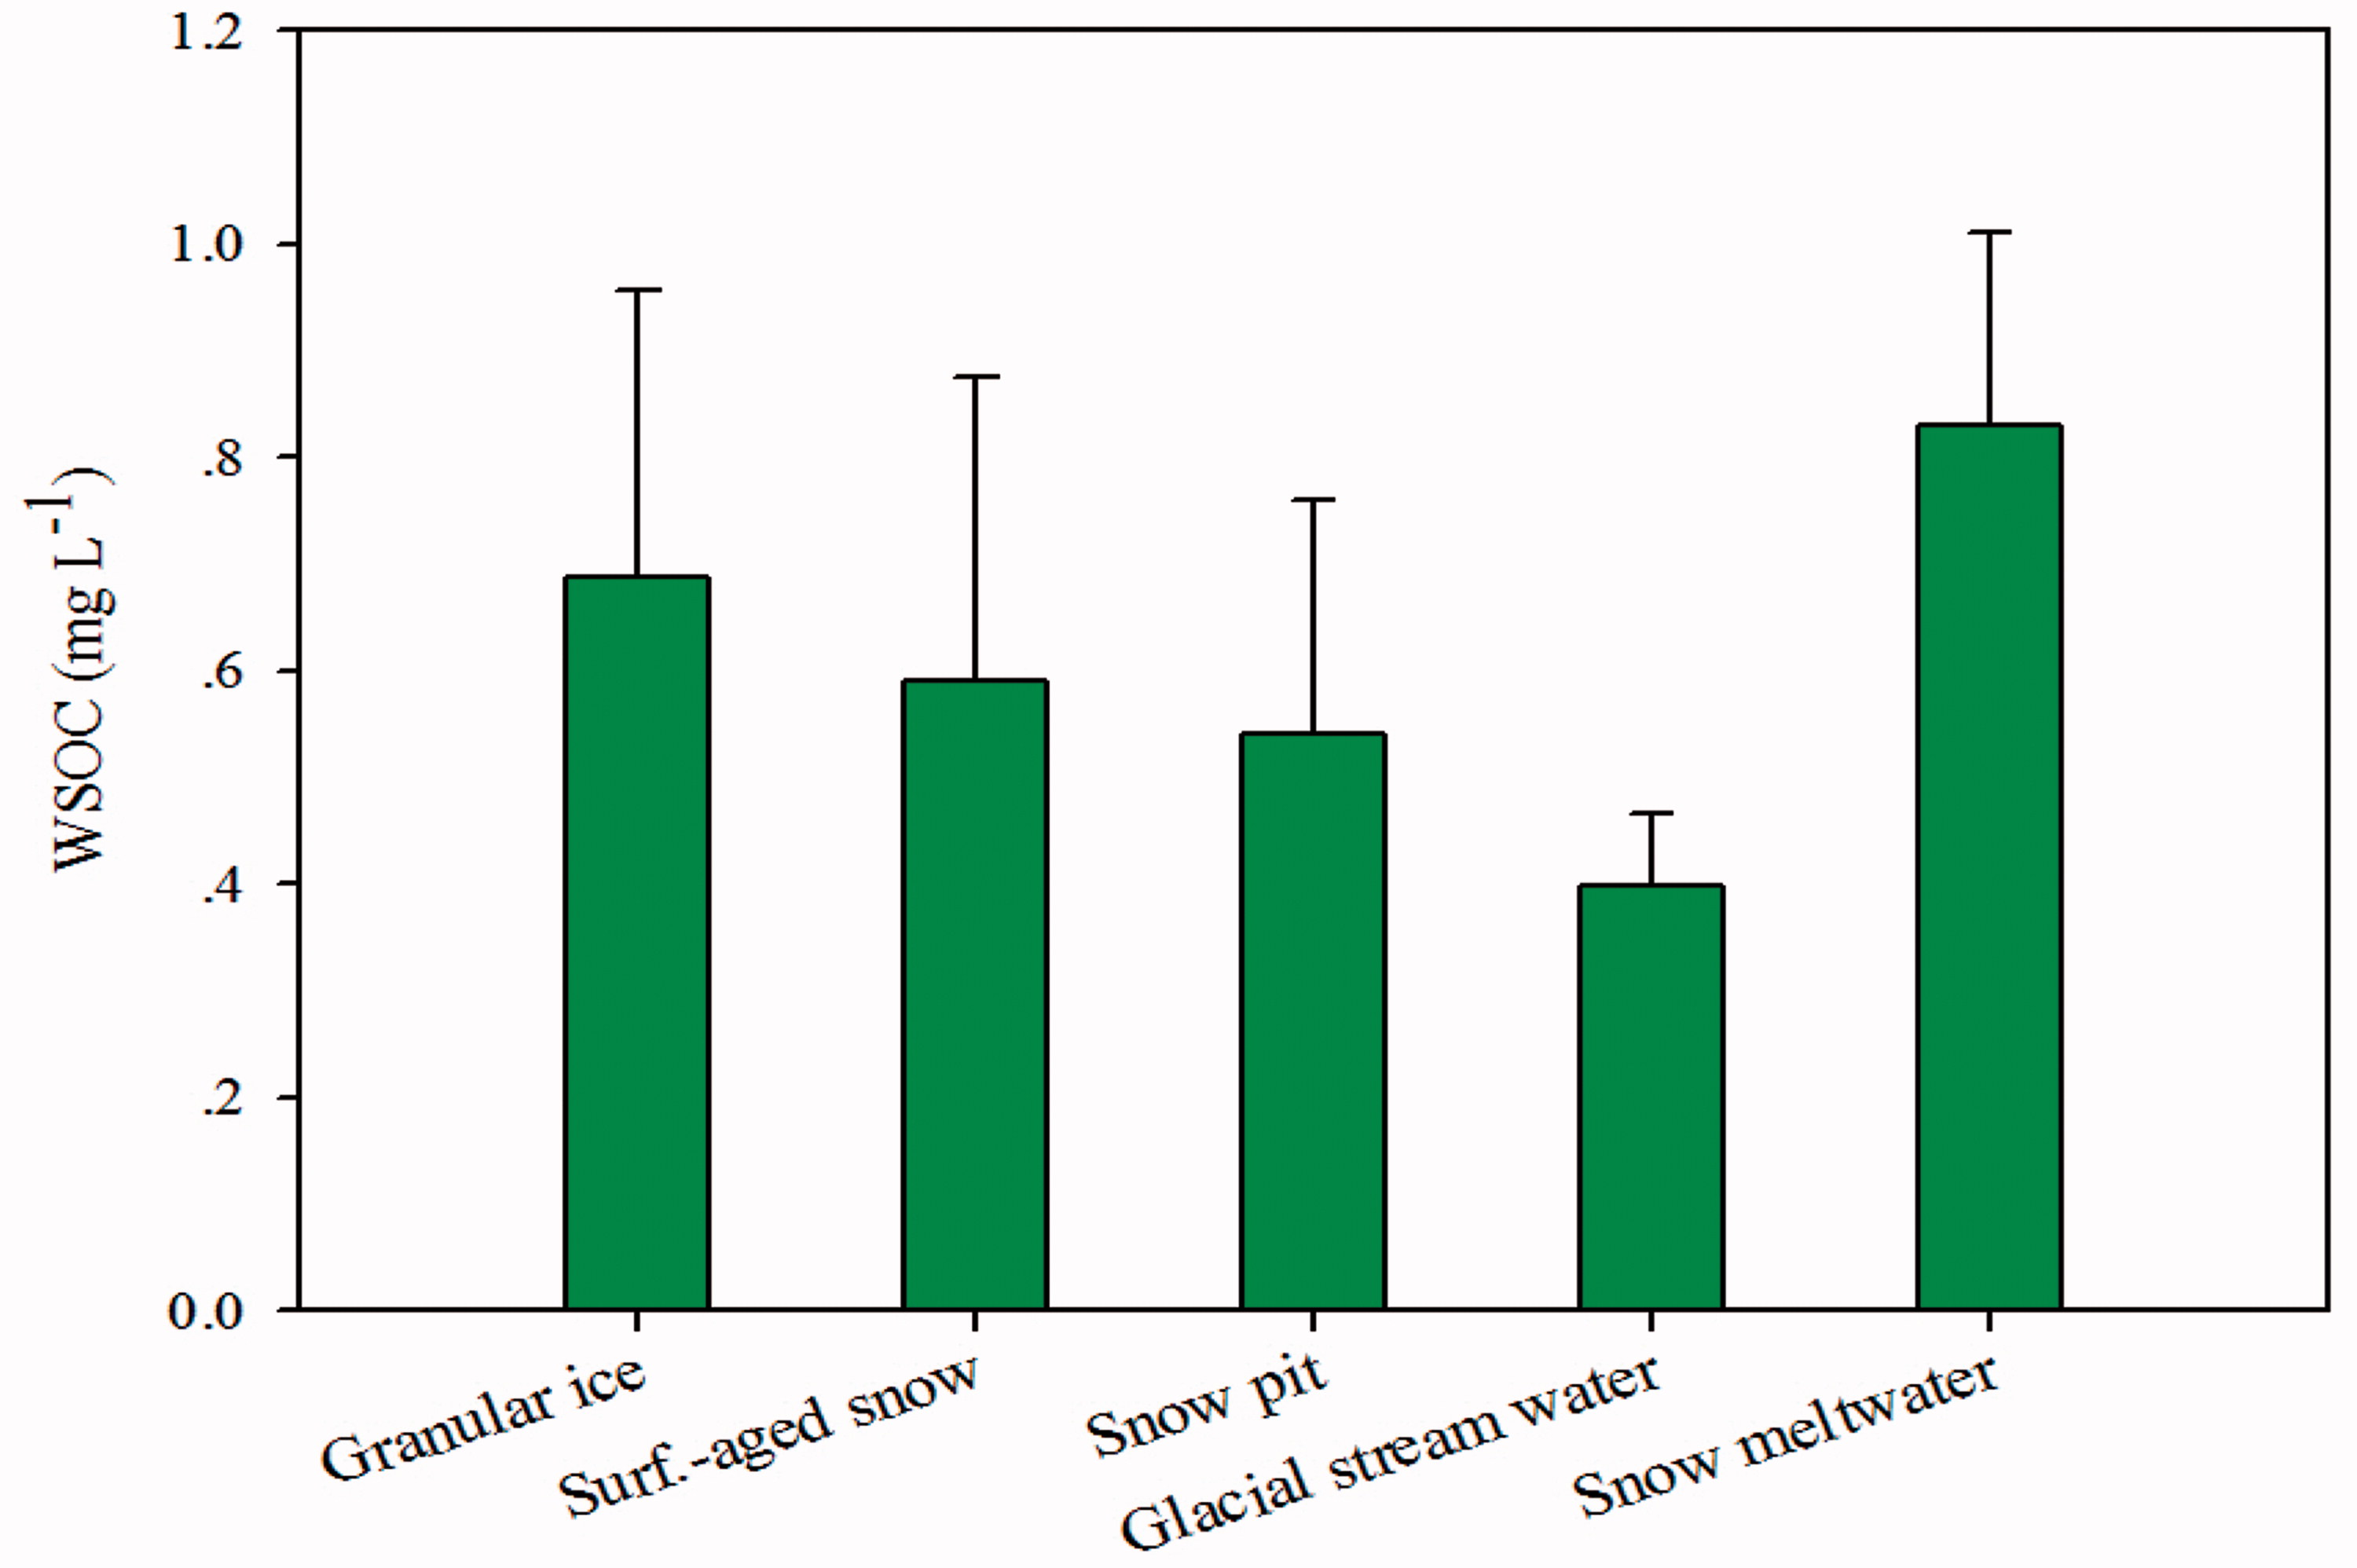
Fig. 2.
Average WSOC concentrations in snow, ice, and meltwater from Baishui glacier.
Compared with other glacial regions in the world, our average values (0.61 ± 0.21 mg L−1) are comparable with the WSOC concentrations in snow of the Zhadang glacier (0.37 ± 0.28 mg L−1) (Li et al., 2016b) on the TP and the Mendenhall glacier in Alaska (0.29 ± 0.02 mg L−1) (Stubbins and Dittmar 2012). Our findings are also comparable to the results found in LHG glacier (0.42 ± 0.29 mg L−1) (Yan et al., 2016) and the Antarctic ice sheet (0.46 ± 0.12 mg L−1) (Hood et al., 2015) (Table 2). In addition, the IPC concentrations in snow (0.94 ± 0.09) on Mt. Yulong were, taking into the large SD at the two latter sites, comparable to that found in the snow on Zhadang (0.64 ± 0.45) and LHG (1.01 ± 0.47) glaciers (Li et al., 2016a), which was due to the large fraction of carbonaceous matter and dust deposition in these areas, primarily transported from South Asia (Lüthi et al., 2014; Cong et al., 2015a, b; Li et al., 2016c) and local motor vehicle emissions (Niu et al., 2017b). It was also reported that high WSOC concentrations in ice were mainly due to contributions from the living biosphere (approximately 85%) (Legrand et al., 2013b), and 15% of WSOC was related to the elevated fossil fuel emissions. Based on the WSOC and IPC concentrations, the calculated WSOC/TC ratios were also presented in Table 2. Results indicated that WSOC accounted for a large fraction of TC in snow and ice with an average value of 26.9%, which was almost comparable with the results found in the TP, e.g. LHG (29%), Zhadang (37%) (Li et al., 2016a). Yet, in ice core drilled from glaciers in Europe, WSOC accounted for absolutely high percentage of the TC, with the average WSOC/TC of 86% (Legrand et al., 2013b) and 57% (Pio et al., 2007), this was primarily contributed by the abundant biogenic volatile organic compounds (Legrand et al., 2013b; Kirillova et al., 2013). Moreover, in very remote places, i.e. Alpine, Greenland, and Antarctic sites, insoluble OC (WinOC) is not expected to dominate the WSOC budget and the WinOC/WSOC ratio was close to 10% at summit (Hagler et al., 2007; Legrand et al., 2013b; Niu et al., 2017b).
Table 2.
Water-soluble organic carbon (WSOC) and insoluble particulate carbon (IPC) concentrations (mg L−1) and WSOC/TC in snow, ice, and meltwater on Mt. Yulong and the comparison of WSOC, IPC concentrations with those from other glacial regions.
Depletion and leaching of WSOC in the snowpack
4.2.
It is known that organic compounds deposited on glaciers will experience a series of depletion processes and photochemical reactions (Grannas et al., 2004; Antony et al., 2011; Niu et al., 2017b). Depletion process of WSOC in surface aged snow was investigated based on successive in-situ observations, the results indicated that WSOC concentrations were dramatically decreased with the time extension during the entire monsoon season (Fig. 3), although with sporadic fluctuations. The decreased trend of WSOC concentrations in surface aged snow was due to extensive glacial (or snow) melting and scavenging effects by meltwater, similar results were also found in our previous study (Niu et al., 2017b). In addition, photochemical reaction and photolysis of WSOC (Grannas et al., 2004), air-snow exchange processes, leaching processes, or washout by the snow meltwater, or WSOC in surface snow was re-emitted in the atmosphere when snow is aging, all of those factors might result in the decreasing trend of WSOC concentrations in surface aged snow on glaciers during the entire monsoon season. Moreover, since a large portion of glacier-derived WSOC has proven to be highly bioavailable (Hood et al., 2009; Singer et al., 2012; Legrand et al., 2013a; Spencer et al., 2014), WSOC content was exponentially decreased during the period of in situ observations (biodegradation experiment) (Yan et al., 2016).
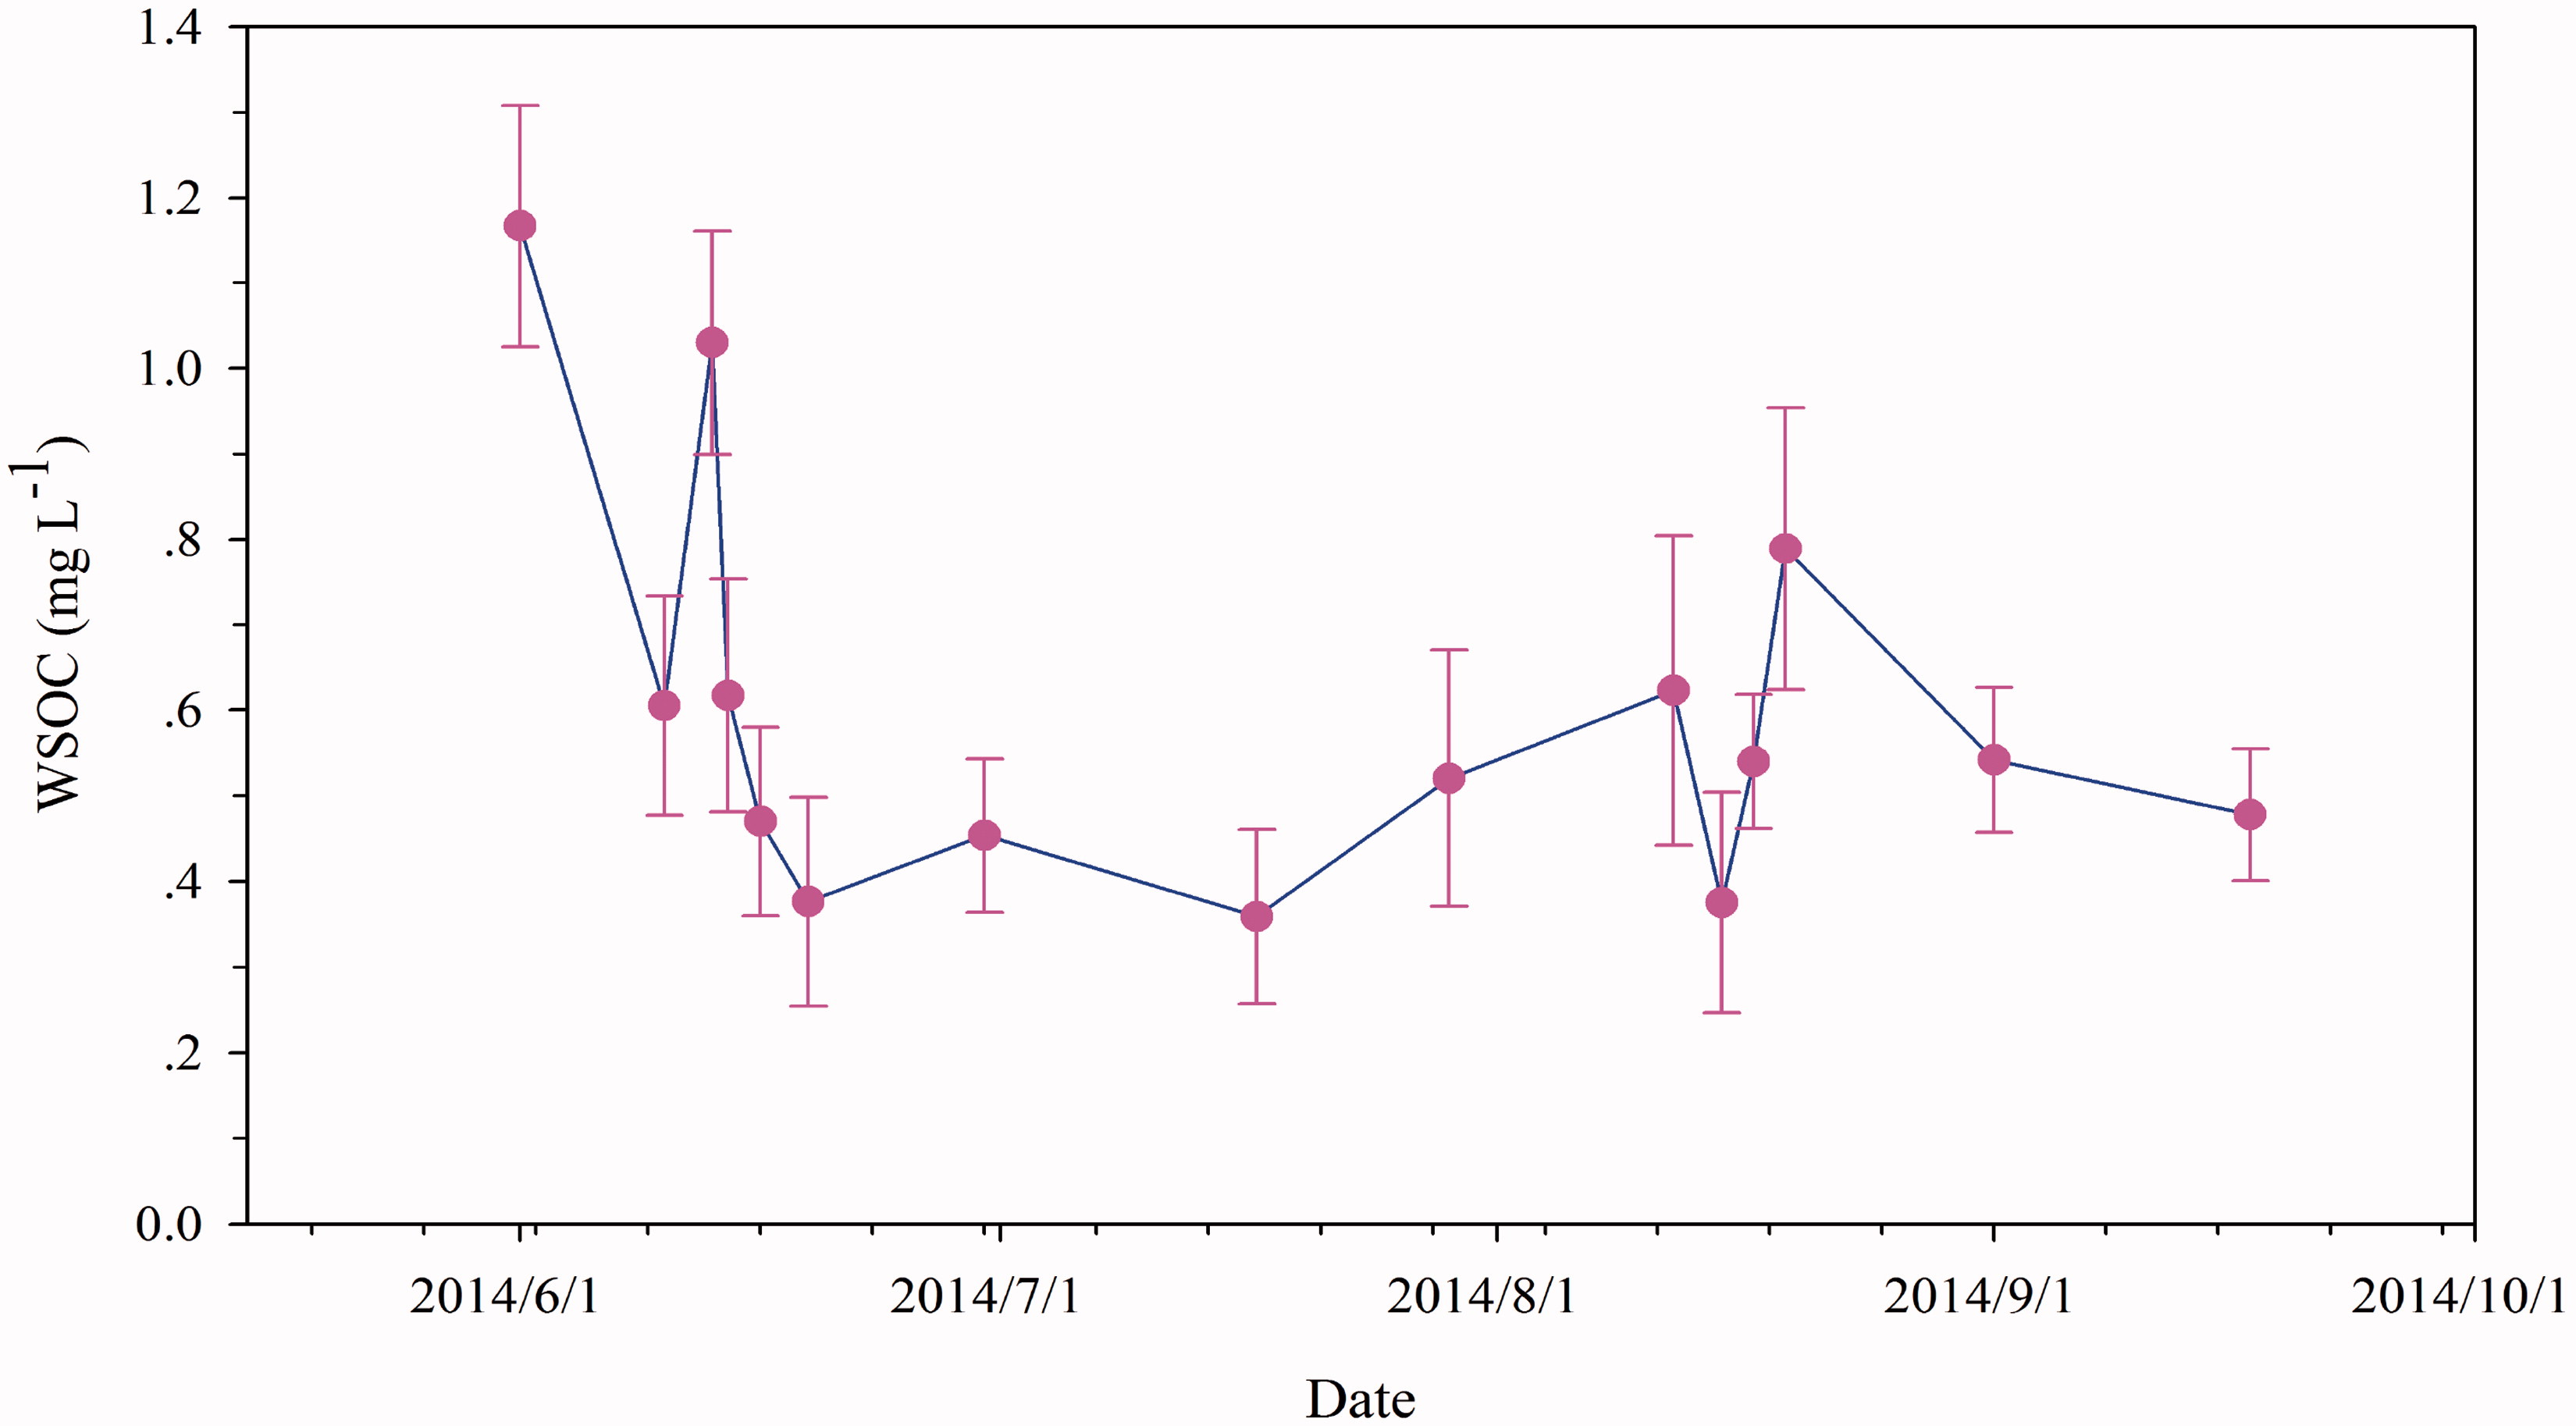
Fig. 3.
Depletion of WSOC concentrations in surface aged snow during the monsoon season.
To clarify the physico-chemical processes and leaching effect of the WSOC concentrations in snow pits, we analyzed the vertical distribution of WSOC concentrations. The trends of WSOC concentrations in the profiles of snow pits were generally consistent (Fig. 4), but the concentration curve of the second snow pit (excavated on 10 June 2014) was obviously smoothed. Particularly, at the time of excavating the second snow pit, the snowpack was thinned considerably (approximately 0.3 m) during the past several days. Therefore, snow quick-melt effects (Niu et al., 2017b) and the leaching processes in snow pit substantially affected the vertical distribution of WSOC concentrations, this point is somewhat consistent with the trend of WSOC in surface aged snow (Fig. 3). Furthermore, Hagler et al. (2007) found the concentrations of particulate organic carbon in surface snow to be much greater than those in shallow snow pits, suggesting that the snowpack loses a significant fraction of the carbon mass originally deposited.
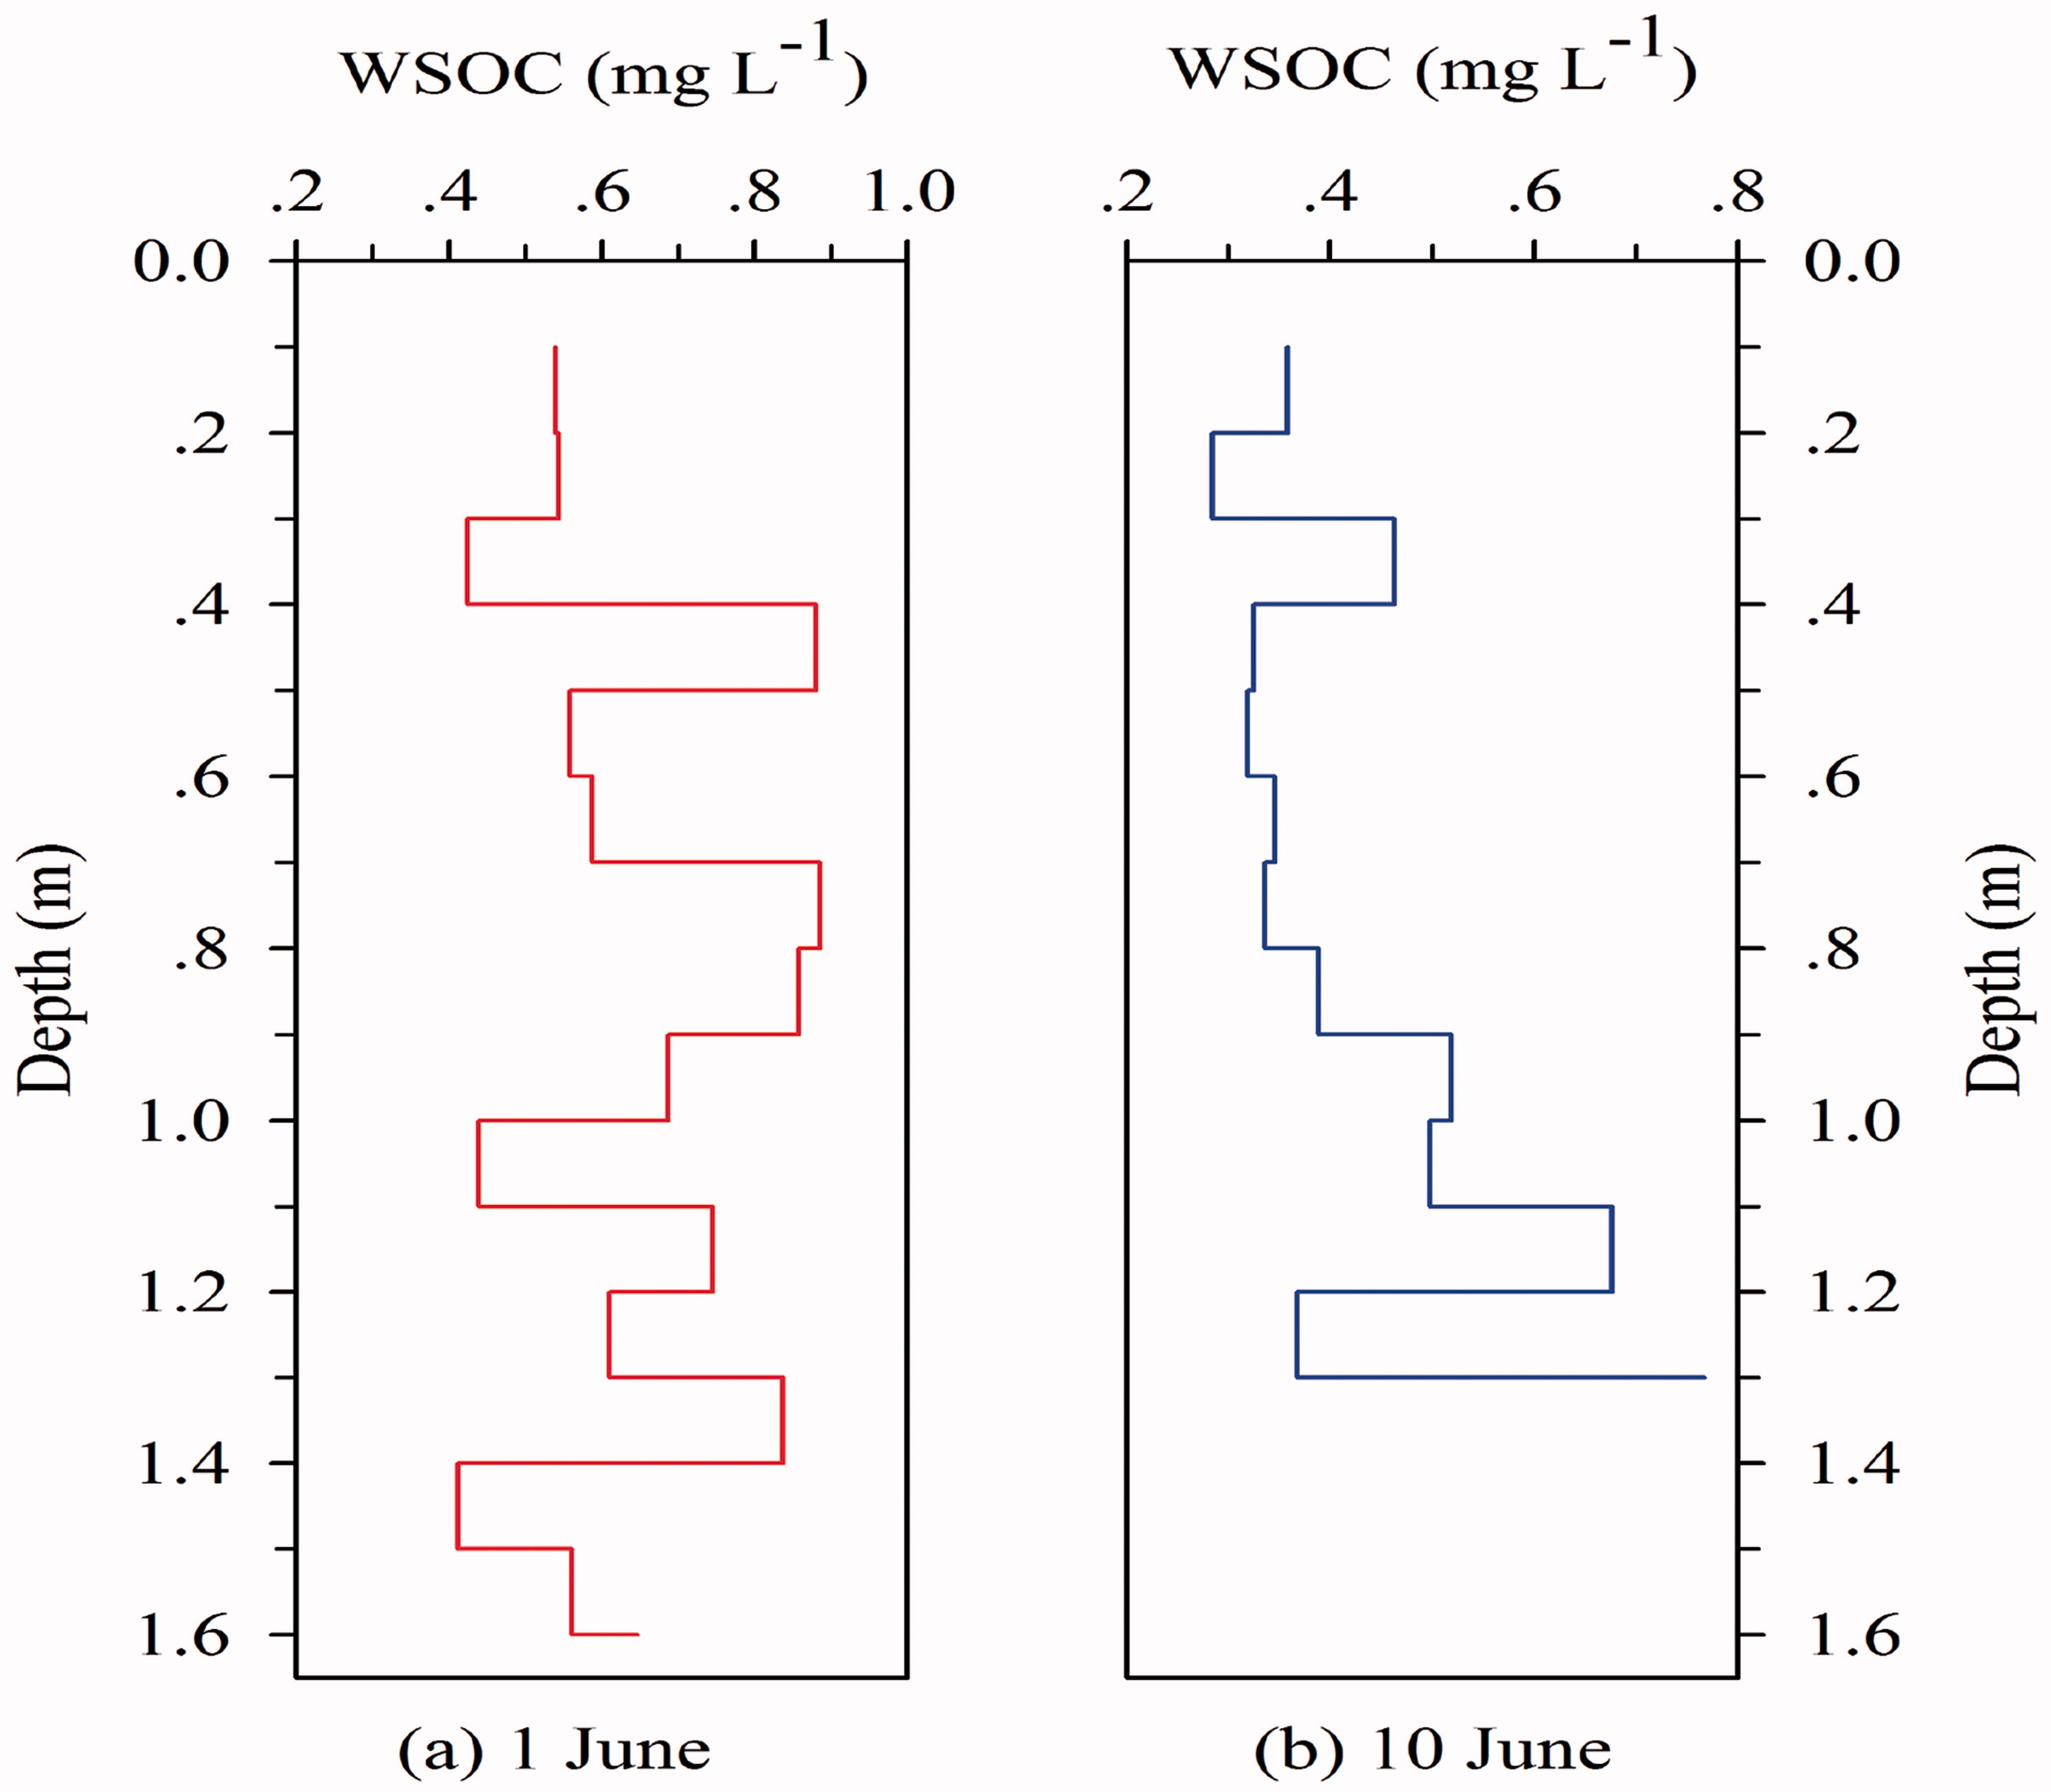
Fig. 4.
Vertical distribution of the WSOC concentrations in snow pits (excavated on (a) 1 June and (b) 10 June, 2014).
Light absorption property of WSOC
4.3.
MAC values of WSOC (MACwsoc ) and the spectral dependence
4.3.1.
The mass absorption cross section at 365 nm for WSOC is an important parameter for the radiative forcing calculation. The MAC values of WSOC calculated at 365 nm by Equation (1) was 5.23 ± 0.34 m2 g−1 in snow pit, 8.59 ± 0.27 m2 g−1 in granular ice, and 5.10 ± 0.41 m2 g−1 in surface aged snow on Baishui glacier (Table 3), with an average value of 6.31 ± 0.34 m2 g−1 on Mt. Yulong. The results indicated that the high MACwsoc values for low WSOC concentrations are located at the surface samples of snow pits (0–20 cm), which have a considerable effect on the energy budget of the snow pack. Granular ice had the highest MACwsoc values among the three types of snow and ice samples, higher MACwsoc values in granular ice was due to direct exposure to solar radiation (Yan et al., 2016). MACwsoc values of snow and ice on Mt. Yulong glacier were higher than those from the glaciers in other regions, such as Barrow, Alaska (Voisin et al., 2012) and LHG glacier in the TP (Yan et al., 2016) (Table 3). The MAC values of WSOC from different sources vary widely. Typically, the MAC of WSOC at the wavelength of 365 nm derived from motor vehicle emissions can reach 5 m2 g−1 (Kirchstetter et al., 2004). In addition, it was reported that mineral-dust originated WSOC had high MACwsoc values (Yan et al., 2016).
Table 3.
Mass absorption cross section (MAC) of WSOC and absorption Ångström exponent (AAE330–400) of snow and ice from Mt. Yulong and of carbonaceous aerosols from other regions. λ represents the wavelength at which MAC of WSOC was measured.
Spectral dependence of MACwsoc was systematically determined in this study, the results suggested that there exists distinct spectral dependence of MACwsoc with the wavelength ranged from 260 to 700 nm (Fig. 5), all MACwsoc in granular ice, snow pit, surface aged snow were considerably decreased within the wavelength range. The variation trends of light absorbing property of WSOC in the three types of snow and ice samples were consistent with each other, but different with the results found in LHG glacier (Yan et al., 2016). The MAC spectrum is very different at LHG glacier: absorption of WSOC is weaker, and the inflection of the curve is less pronounced. The three measurements at Mt. Yulong show similar patterns and only the magnitude of the absorption is different, that could be due to the concentration. The variations of MACwsoc with wavelengths at Mt. Yulong have similar features at 450 nm, 600 nm, and 650 nm, which were not visible at LHG (Fig. 5). The stronger spectral dependence was the result of enhanced light absorption at wavelengths shorter than 600 nm (Kirchstetter et al., 2004). Moreover, the difference in light absorbing property (particularly for wavelengths larger than 400 nm) among snow and ice samples from Baishui and LHG glaciers indicated their different sources. Intensive exhaust emissions from tourism vehicles were the main local sources of atmospheric pollutants in the Mt. Yulong region and Baishui glacier. Biomass-burning emissions released from South Asia could penetrate into the inland of the TP (Xu et al., 2009; Cong et al., 2015a, b). Since LGH glacier is located in the Qilian mountain and is close to the desert areas in northern China, the light absorption properties of WSOC in snow of glaciers varied considerably in different sites.
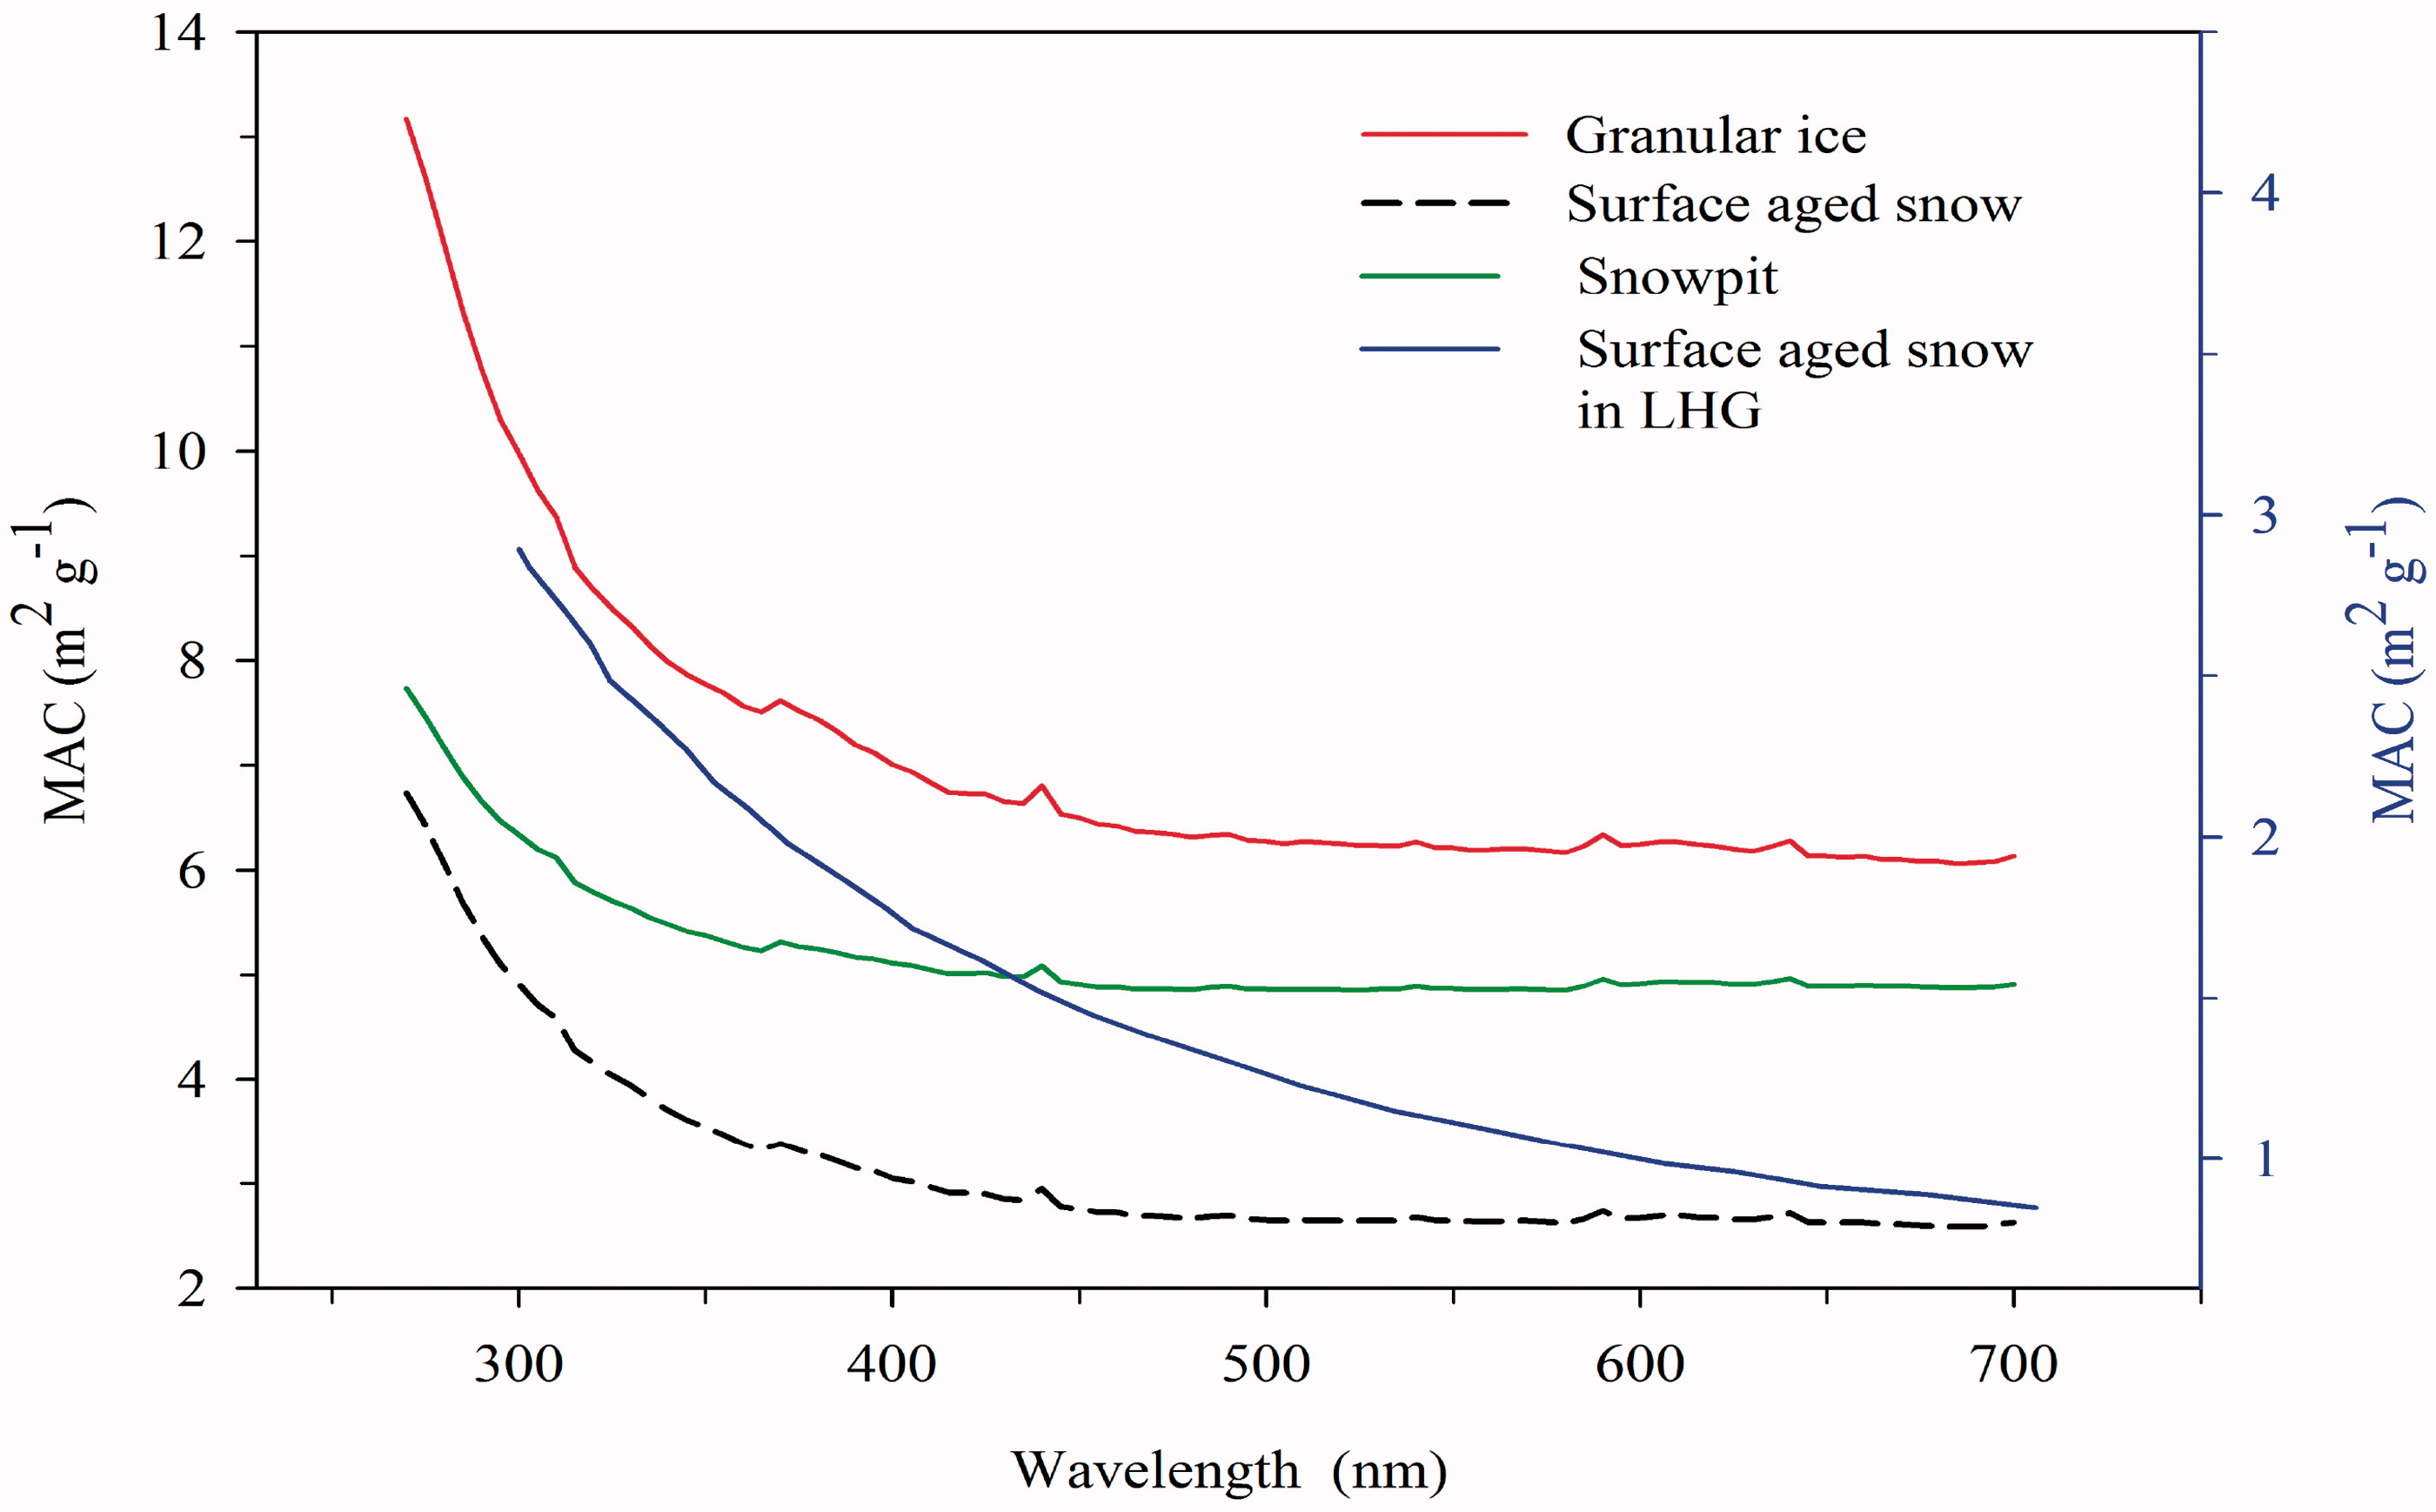
Fig. 5.
Correlations of wavelength and MACwsoc in snow and ice on Baishui glacier and LHG glacier.
Principal component analysis (PCA) of chemical data is performed to tag the potential sources of WSOC by investigating the relationship between WSOC and water-soluble inorganic ions. Factor loading or PCA decomposition provides objective representations of multivariate data through the analysis of the covariance structure of its variants (e.g. Meeker et al., 1995; Niu et al., 2014). Generally, it is deemed that Ca2+ and Mg2+ in glacial regions are mainly from crustal sources (Yao et al., 1995; Kang et al., 2010); K+ is emitted from biomass burning such as heating and cooking (use wood and crop straw) of local residents (Legrand et al., 2013a; Niu et al., 2014, 2016); SO4 2− and NO3 − are primarily generated from fossil fuel combustion (Li et al., 2016a); and NH4 + is derived mainly from biogenic emissions (Pio et al., 2007; Kirillova et al., 2014a). Three factors explained over 80% of the total variance (Table 4). The first factor (F1) largely loaded with major ions (NO3 −, SO4 2−, NH4 +, and K+) can be attributed to crustal sources, agricultural activities (ammonium salt NH4NO3, from fertilizer use) and biomass burning (K+, 97%). The second factor (F2) was heavily loading with WSOC (89%) and Ca2+ (66%), as previously discussed/reported, the TP glaciers are severely affected by dust storms during the non-monsoon period (Thompson et al., 2000). In addition, the third factor (F3) was loading with IPC (64%) and Mg2+ (78%), reflecting IPC is likely associated with continental contribution.
Table 4.
Results of principle component analysis (PCA) carried out on WSOC and major water-soluble inorganic ions in snow pits samples: factor loading (F1, F2, F3), eigenvalues and percentual explained variance. The numbers in the table represent the percent of variance associated with each major ion. Negative values indicate an inverse relationship.
AAE
4.3.2.
AAE is a parameter reflecting the wavelength dependence of the light absorption of WSOC, and can provide important input data in calculating light absorption of WSOC. The fitted AAE330–400 value was 0.63 ± 0.22 for snow pit, and 0.77 ± 0.46 for surface aged snow on Mt. Yulong (Table 3). The AAE330–400 values for snow and ice samples on Mt. Yulong were definitely lower than those found in other regions, such as Barrow, Alaska (Voisin et al., 2012) with the value of 6.1, New Delhi with 3.1–9.3 (Kirillova et al., 2014b), and Beijing, China with 7.2 (Cheng et al., 2011). The lower AAE330–400 values in snow and ice of glacier on Mt. Yulong suggested that the WSOC had experienced extensive photobleaching, photolysis, strong melting, and leaching processes. The very low AAE330–400 values also indicate that the light absorption of WSOC is more spectrally neutral. Prior studies have proposed that the AAE values of brown carbon in aged aerosols (Andreae and Gelencser, 2006; Lüthi et al., 2015) and secondary organic aerosols (Nie et al., 2012; Lambe et al., 2013) were much lower than their respective primary. The great discrepancy in AAE values also suggests diverse compositions of WSOC (Yan et al., 2016). The low AAE330–400 values and the high MACwsoc values for low concentration indicate WSOC in snow and ice absorbing a lot of light.
In addition, BC and OC concentrations in snow and ice samples from Mt. Yulong were systematically determined. The averaged BC concentration were 698 ± 124 ng g−1 and 2752 ± 98.4 ng g−1 in surface aged snow and granular ice, respectively. While the mean OC concentration in surface aged snow and granular ice was 2090 ± 568 ng g−1 and 4304 ± 358 ng g−1, respectively. BC and OC deposited on the snow and glaciers were widely considered as insoluble light-absorbing impurities (ILAIs) (Wang et al., 2017; Niu et al., 2018). ILAIs combined with WSOC in snow and glacier can be defined as light-absorbing matter (LAM), which considerably reduces snow spectral albedo, absorbs large amount of solar energy, and accelerates the retreat of glaciers.
Relative light absorbance of WSOC and BC
4.4.
Based on our extensively determined WSOC and BC concentrations, and MACwsoc values in snow and ice of Baishui glacier, combined with Equation (3), the associated light absorbance of WSOC relative to BC (p) is 3.99 ± 0.76. In other words, the relative absorption of WSOC to BC is almost 4 times higher, on an average. This result indicated that WSOC is more absorptive than BC (in the wavelength range of 330–400 nm) in surface aged snow of glaciers (Fig. 6). Generally, the AAE of BC is low, and often taken to be unity in models since they assume a flat absorption spectrum for BC. Strong light absorbance (in the wavelength range of 330–400 nm) of WSOC is primarily due to its higher concentrations in snow of glaciers. However, approximately 25% of light absorption of WSOC less than that of BC is due to relatively low WSOC concentrations (within 0.5 mg L−1) (Fig. 6).
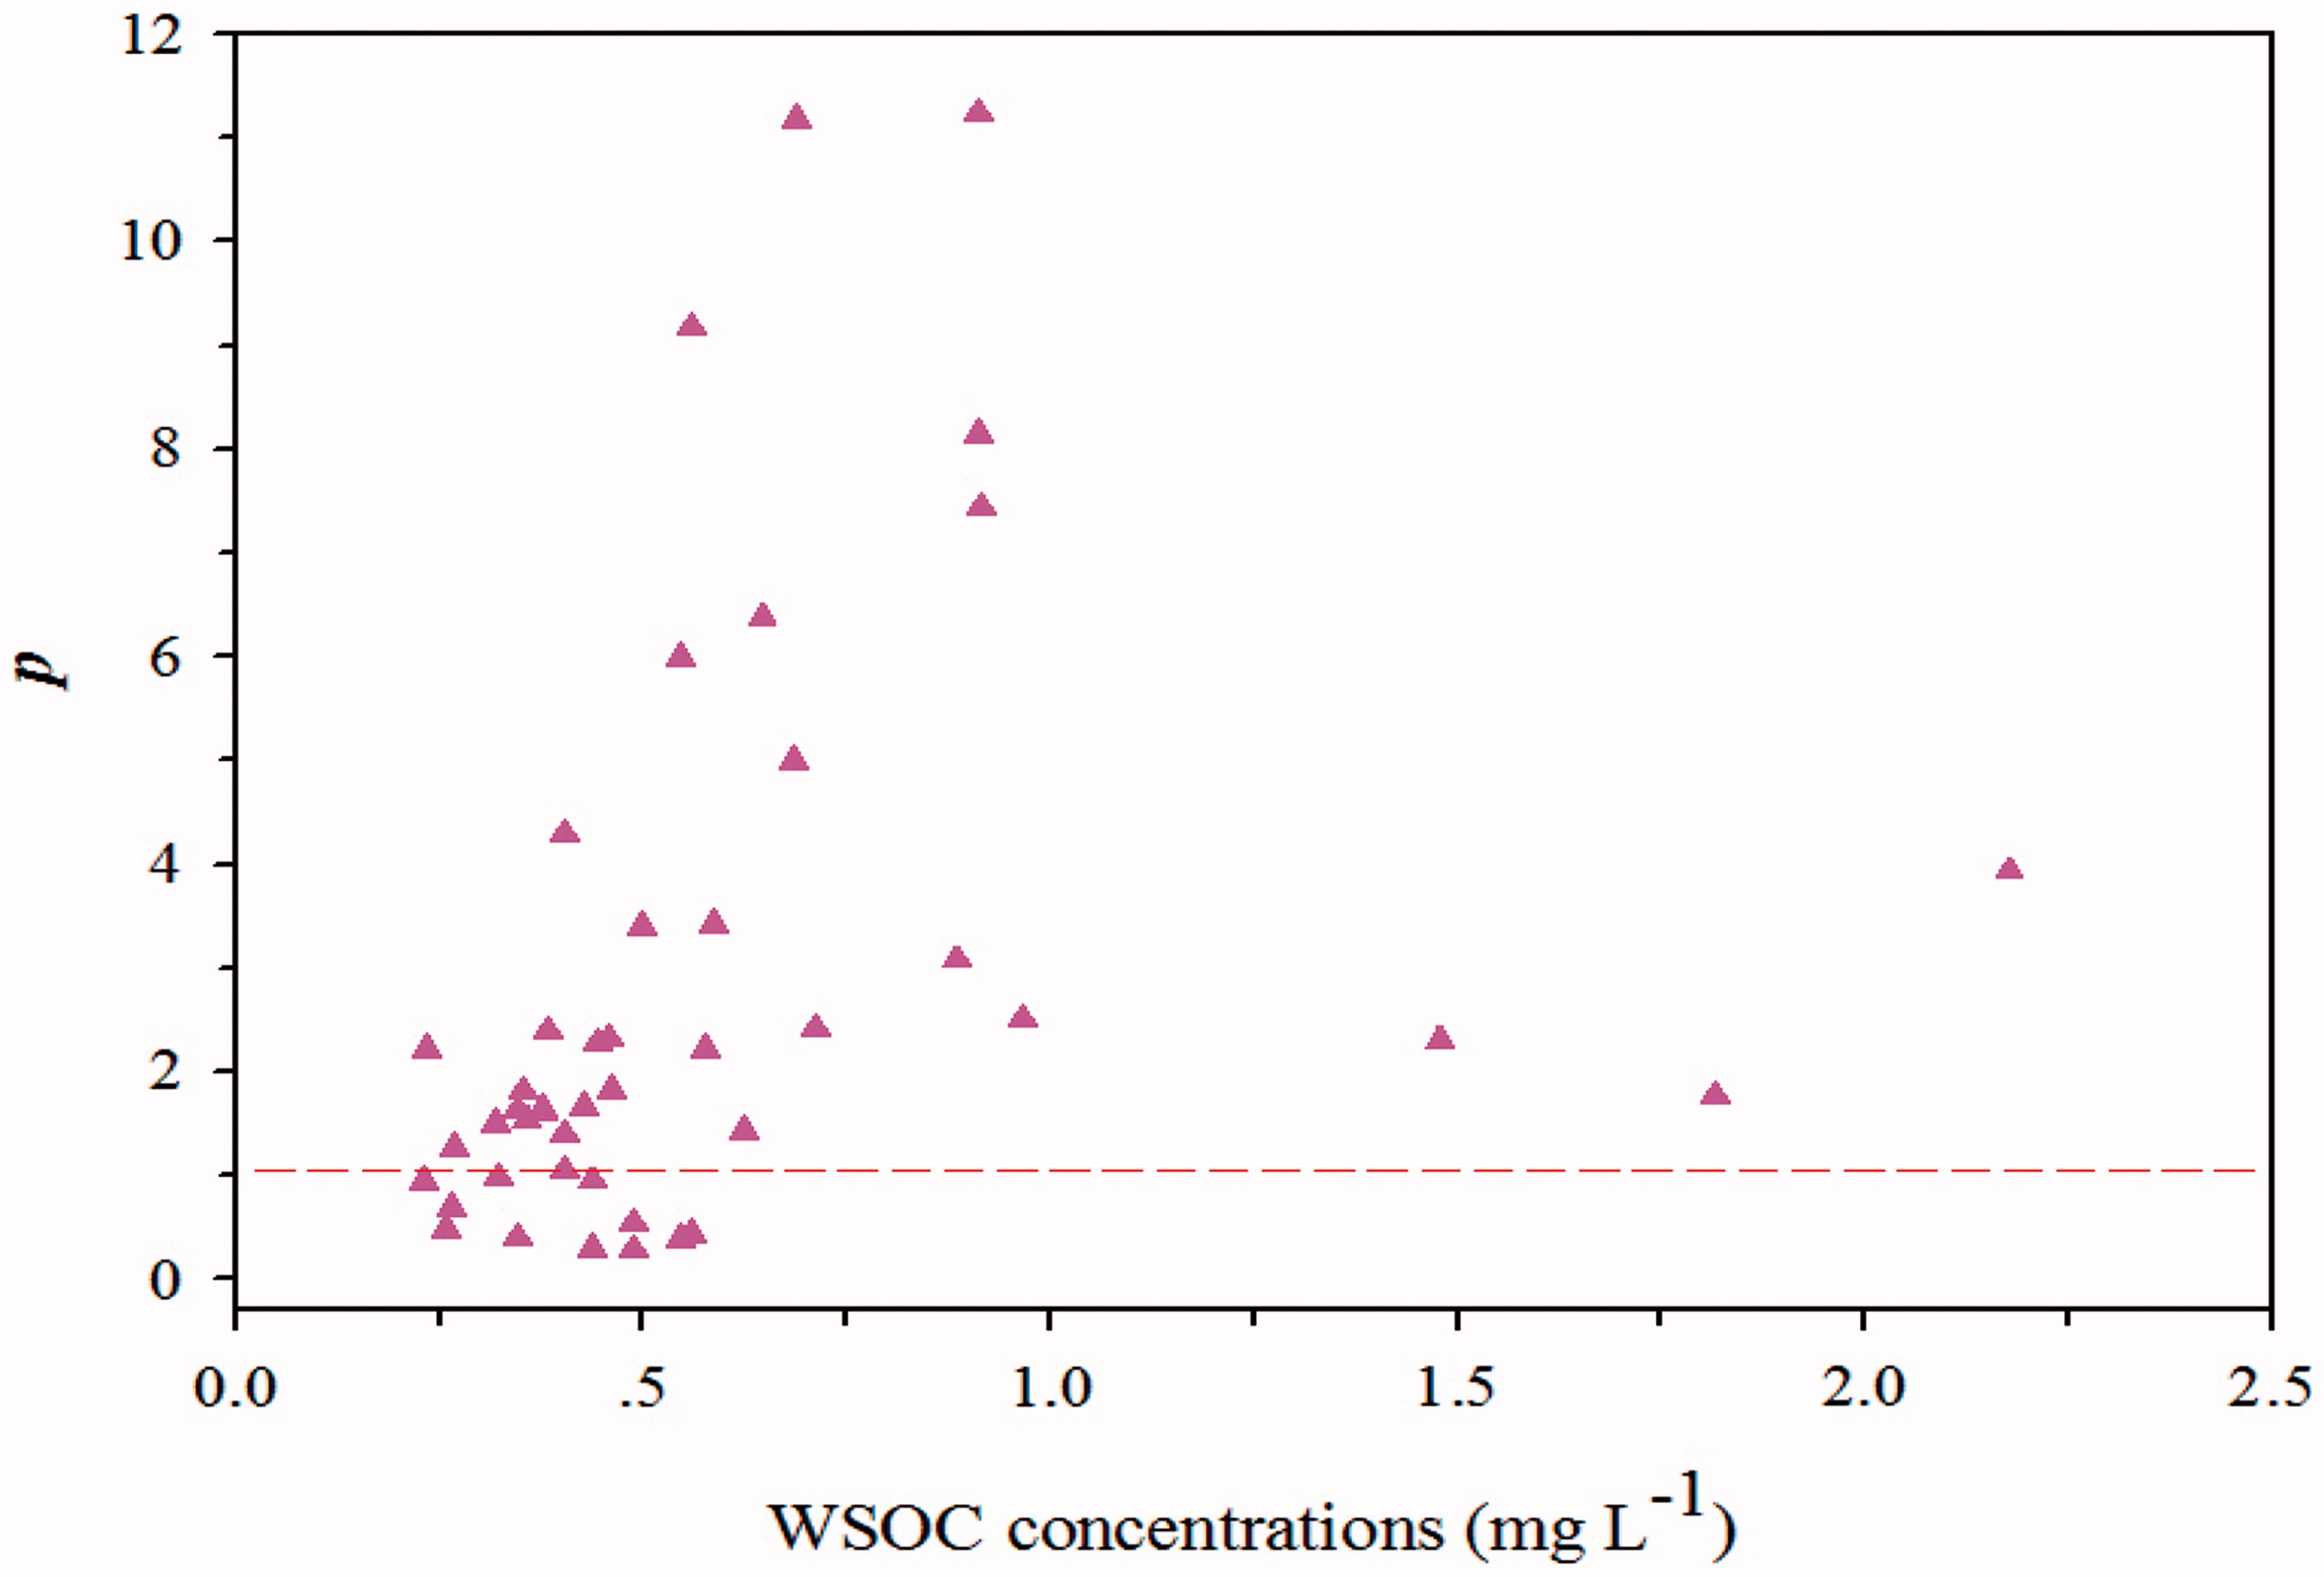
Fig. 6.
Relative light absorbance of WSOC and BC (p) versus WSOC concentrations.
Moreover, there was uncertainty of relative absorbance between WSOC and BC. Actually, several factors can cause the large uncertainty of WSOC and BC absorbance, which includes (1) the exact MAC values for BC; (2) the mixture conditions among BC and other IPC components in snow and ice of glaciers (external or internal mixture); (3) the enrichment forms of BC at the glacier’s surface (Kaspari et al., 2014; Niu et al., 2017a). More work is needed to diagnose the relative absorption of WSOC and BC in snow and ice of glaciers, which is crucial to quantitatively evaluate the solar energy absorbance of WSOC and IPC in snow of glaciers.
Carbonaceous compound flux and glacial retreat
4.5.
The carbonaceous compound flux in glaciers due to precipitation and melting plays an important role in carbon cycle of the earth. The fluxes of carbonaceous compounds of a specific glacier can be determined by the concentrations of carbonaceous matter in glacier and precipitation amount. The annual WSOC flux in Baishui glacier has been estimated based on the averaged WSOC concentrations (Table 2) in snow and granular ice of Baishui glacier, and the precipitation amounts in Mt. Yulong, which were recorded by automatic weather stations installed in the glacier areas (at an elevation of 4800 m asl).
The flux of WSOC in Baishui glacier was 0.99 gC m−2 yr−1, comparable to the result (0.11 ± 0.49 gC m−2 yr−1) proposed in Li et al. (2016a) for six glaciers in the TP, but lower than the fluxes of typical polluted areas in North and South Korea (1.9 gC m−2 yr−1) (Yan and Kim, 2012; Park et al., 2015). Similar method was used to determine the flux of IPC in Baishui glacier, and the flux of IPC was 4.77 gC m−2 yr−1, indicating a large fraction of IPC, as well as WSOC have contributed to dynamic carbon cycle in glaciers.
Total WSOC storage in the Baishui glacier was estimated to be 1.5 tone C (1 tone =106 g) based on the average WSOC flux and the Baishui glacier size (1.52 km2) (Li et al., 2010) of Mt. Yulong, while the total IPC storage in the Baishui glacier has been estimated to be 7.25 tone C. However, these estimations were somewhat overestimated because during the recent years (Kang et al., 2001, 2015; Du et al., 2013, 2015), dramatic glacial melting in this region have been observed.
In addition to the impacts of the rising temperature (You et al., 2010; Yasunari et al., 2010) and decreasing precipitation trend (low glacial accumulation) (Yao et al., 2012b), large number of studies demonstrated that deposition and enrichment of the LAM onto glaciers can substantially accelerate glacial melting (Xu et al., 2009; Doherty et al., 2013; Ming et al., 2013; Qu et al., 2014; Dong et al., 2017; Li et al., 2017; Niu et al., 2017b) and triggers an earlier spring melt (Flanner et al., 2007, 2009; Niu et al., 2017b). Particularly, if the impurities were exposed at the glacier’s surface during the melting season, glacial melting would be further accelerated. This could occur if snow melting resulted in the exposure of ILAIs at the glacier’s surface and/or if the melting season was reinforced and expanded due to a warming climate (Fujita 2007; Fujita et al., 2011). It was observed that for elevations lower than 4800 m asl on Baishui glacier, there was no snow cover area on glacier's surface during the summer, so those ILAIs remained exposed throughout the summer (Niu et al., 2017b). Therefore, the melting of Baishui glacier is definitely accelerated by the LAM deposited onto snow and glacier’s surface. Furthermore, based on the continuous field hydrological observations, the average velocity of Baishui River in summer season was 0.41 m s−1 in 2011, and it was increased to 0.52 m s−1 during the entire monsoon season in 2014, and the annual runoff was approximately 4.22 × 10⁶ m3, glacial melting is further reinforced by the LAM in glaciers (Li et al., 2017; Niu et al., 2017a). In a word, Baishui glacier as a typical temperate glacier in the southeast TP, can be regarded as a fraction of carbon source on the earth under the scenario of a warming climate.
Conclusions
5.
This study first comprehensively evaluated WSOC and IPC concentrations in snow and granular ice of a typical temperate glacier on Mt. Yulong. We investigated the depletion and leaching of WSOC in the snowpack, light absorption property of WSOC and the relative solar energy absorbance of WSOC and BC (p). Finally, we discussed carbonaceous matter and the implications for glacial retreat.
Statistical results demonstrated that the average concentrations of WSOC concentrations were 0.61 ± 0.21 mg L−1 in Baishui glacier on Mt. Yulong, are comparable with the results found in other glaciers in the TP. WSOC concentrations in surface aged snow were dramatically decreased with the time extension during the entire monsoon season due to extensive glacial melting and scavenging effects by meltwater. Snow quick-melt effects and the leaching processes substantially affected the vertical distribution of WSOC in the snow pit.
The MAC values of WSOC calculated at wavelength of 365 nm was 6.31 ± 0.34 m2 g−1 on Mt. Yulong, and there exists distinct spectral dependence of MACwsoc , all MACwsoc values in granular ice, snow pit, surface aged snow were considerably decreased within the wavelength range (260–700 nm). The AAE330–400 values in snow and ice of Baishui glacier were low and exists a great discrepancy in AAE values between this study and results from other studies, suggesting diverse constitutes of WSOC in snow and ice of glaciers, and the light absorption of WSOC is more spectrally neutral. The low AAE330–400 values and the high MACwsoc values for low concentration indicate WSOC in snow and ice absorbing a lot of light. Light absorbance of WSOC relative to BC (p) was 3.99 ± 0.76, suggesting that WSOC (wavelength in the range of 330–400 nm) is more absorptive than BC in surface aged snow of glaciers.
The flux of WSOC in Baishui glacier was determined and its value was found to be 0.99 gC m−2 yr−1, while the IPC flux was 4.77 gC m−2 yr−1. Total WSOC storage in the Baishui glacier was estimated to be 1.5 tone C and total IPC storage was 7.25 tone C. Therefore, large amount of WSOC and IPC actively contributed to carbon cycles in glaciers. Moreover, glacial melting is reinforced by the LAM in glaciers and rising temperature, Baishui glacier can be considered as a fraction of carbon source under the scenario of a warming climate.
We also express our sincere appreciations to Dr. Gallet J.C., editor Annica Ekman, and another anonymous reviewer for their constructive comments on our paper.
Disclosure statement
No potential conflict of interest was reported by the authors.