
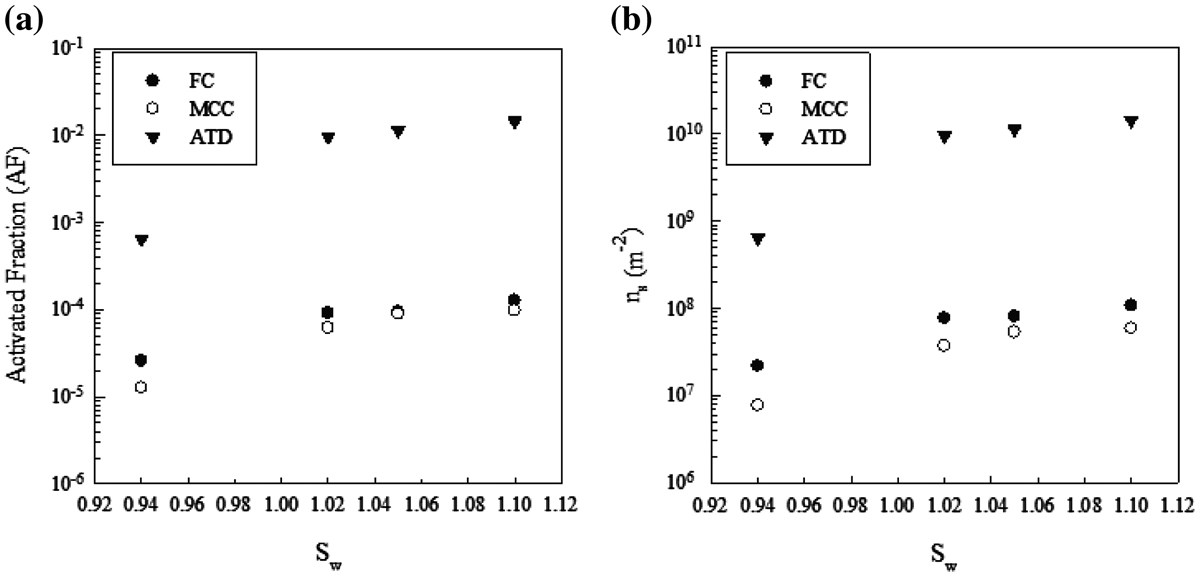
Fig. 1.
Activated fraction AF (a) and n s (b) vs. saturation ratio S w for FC, MCC and ATD.
Table 1.
Percentage variation of AF vs. saturation ratio S w for FC, MCC and ATD.
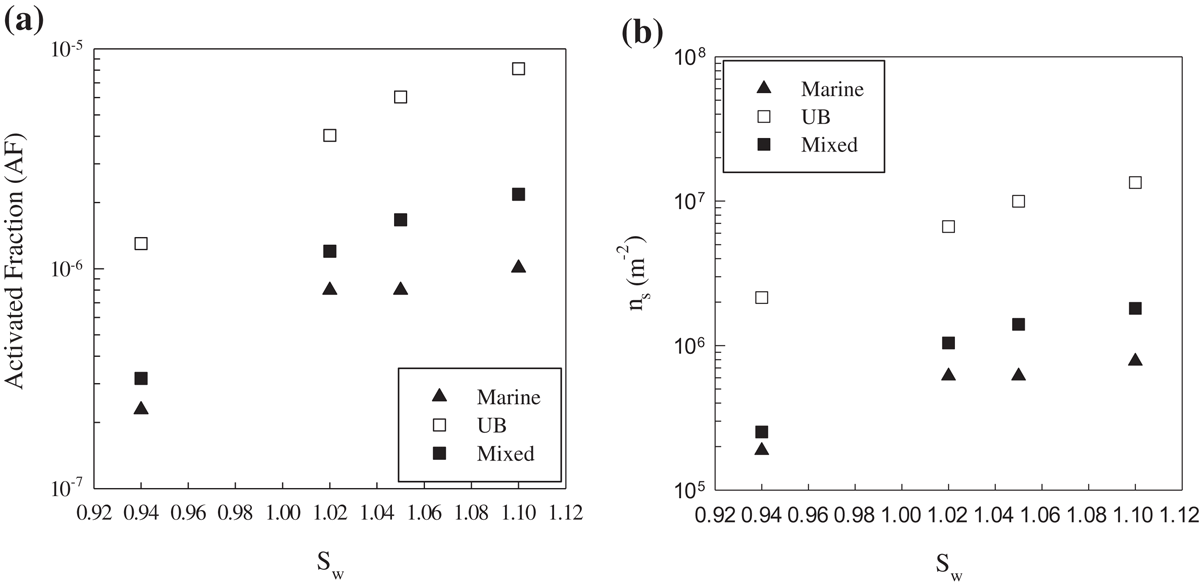
Fig. 2.
Activated fraction AF (a) and n s (b) vs. saturation ratio S w for marine, urban background (UB) and mixed PM10 aerosol.
Table 2.
Percentage variation of AF vs. saturation ratio S w for marine, urban background (UB) and mixed PM10 aerosol.
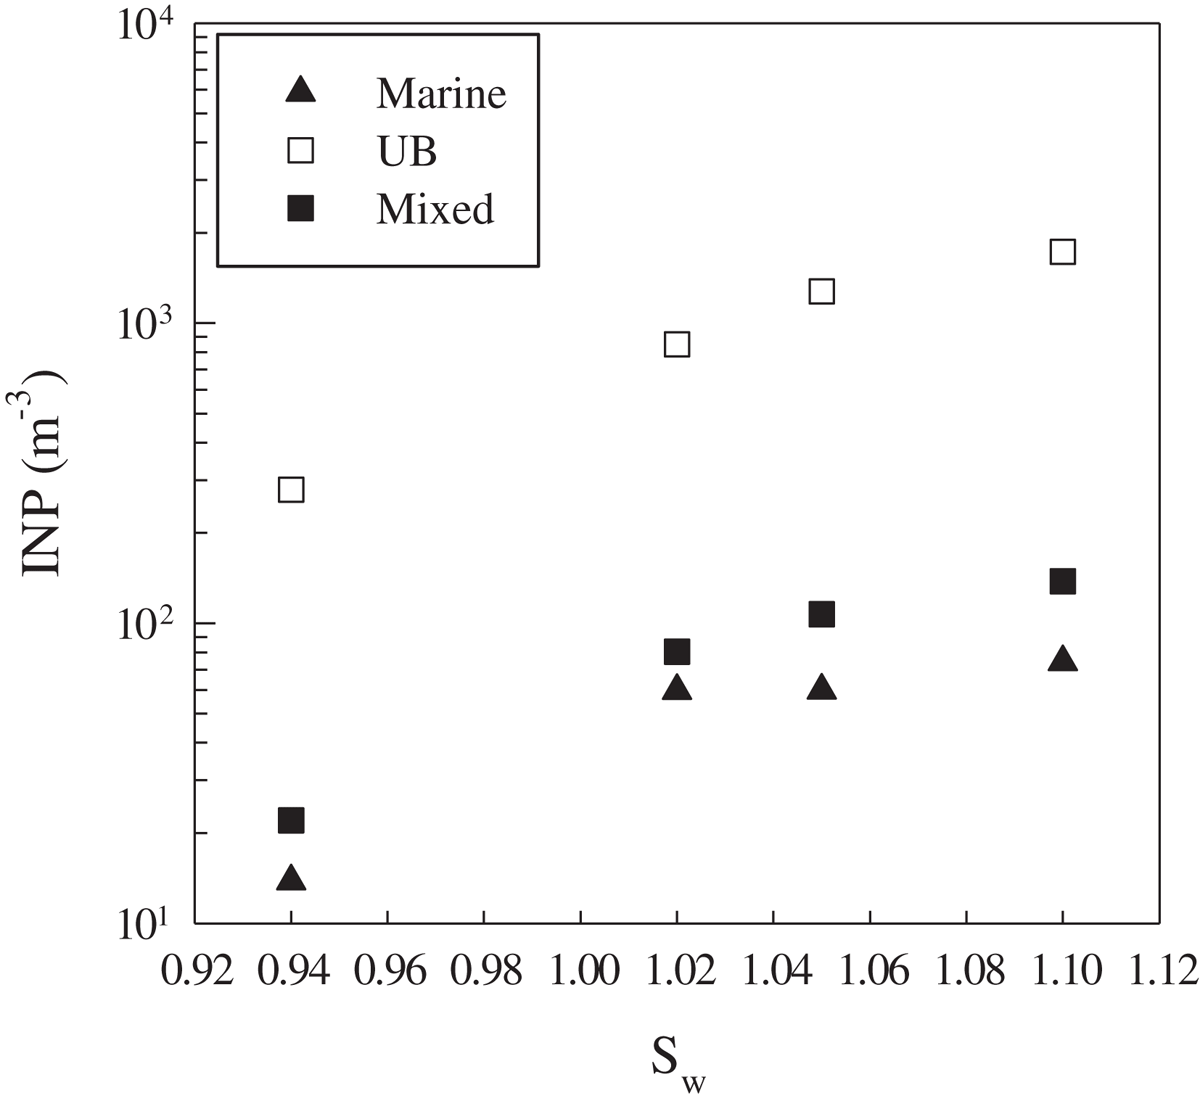
Fig. 3.
Average INP concentration vs. saturation ratio S w for marine, urban background (UB) and mixed PM10 aerosol.
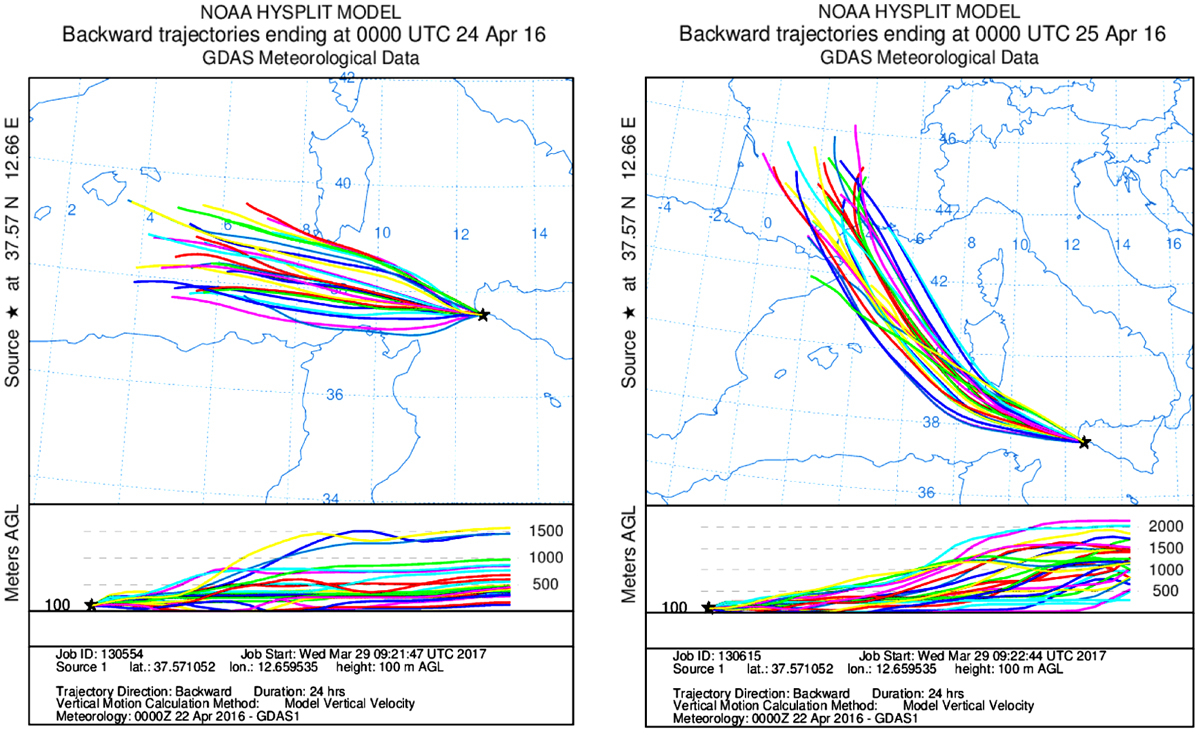
Fig. 4.
24 h back-trajectories on 24 (left) and 25 April (right) 2016 at CG at 00:00 UTC.
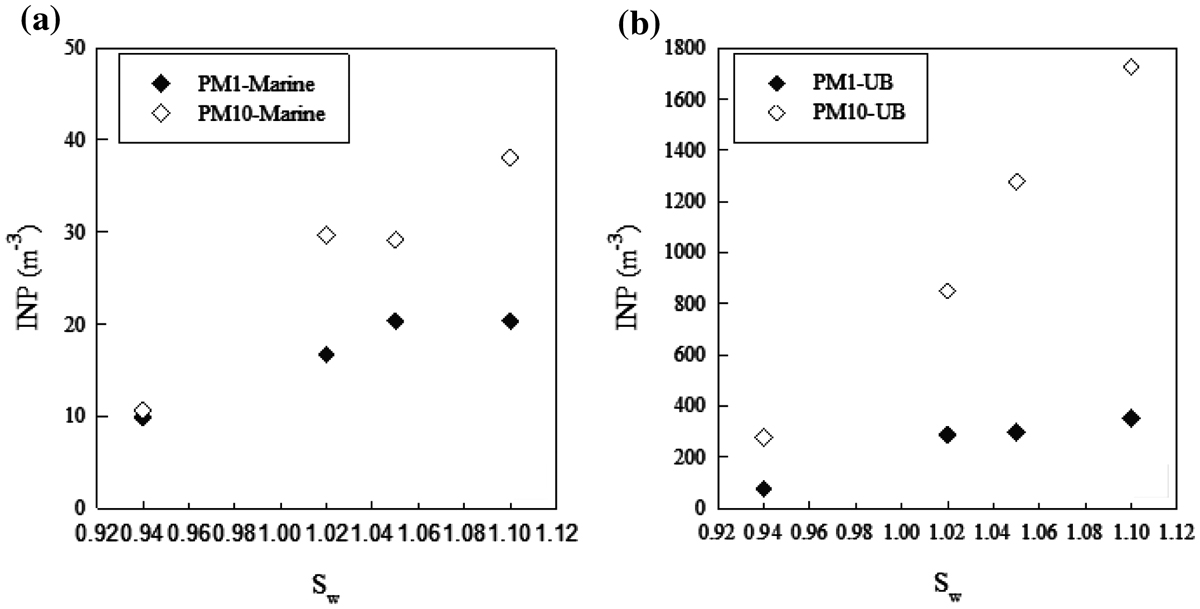
Fig. 5.
INP concentration vs. saturation ratio S w for PM1 and PM10: (a) marine; (b) UB.
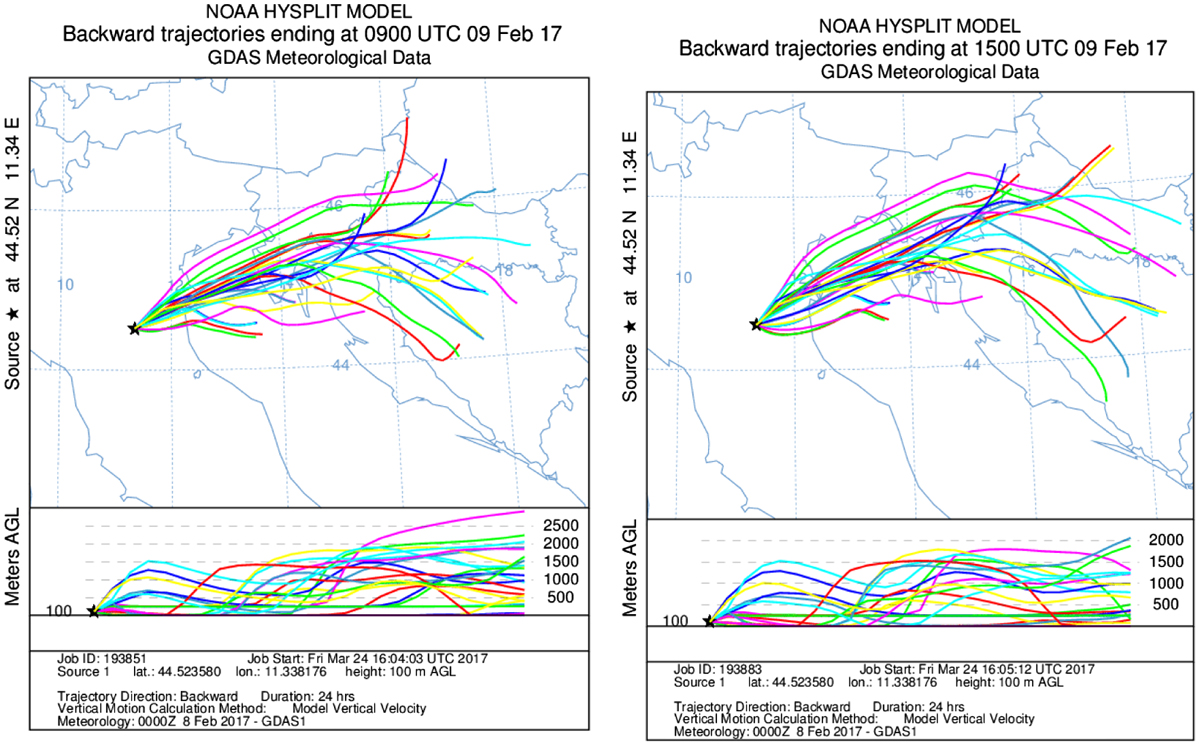
Fig. 6.
24 h back-trajectories on 09 February 2017 at Bologna at: (left) 09:00 UTC and (right) 15:00 UTC.
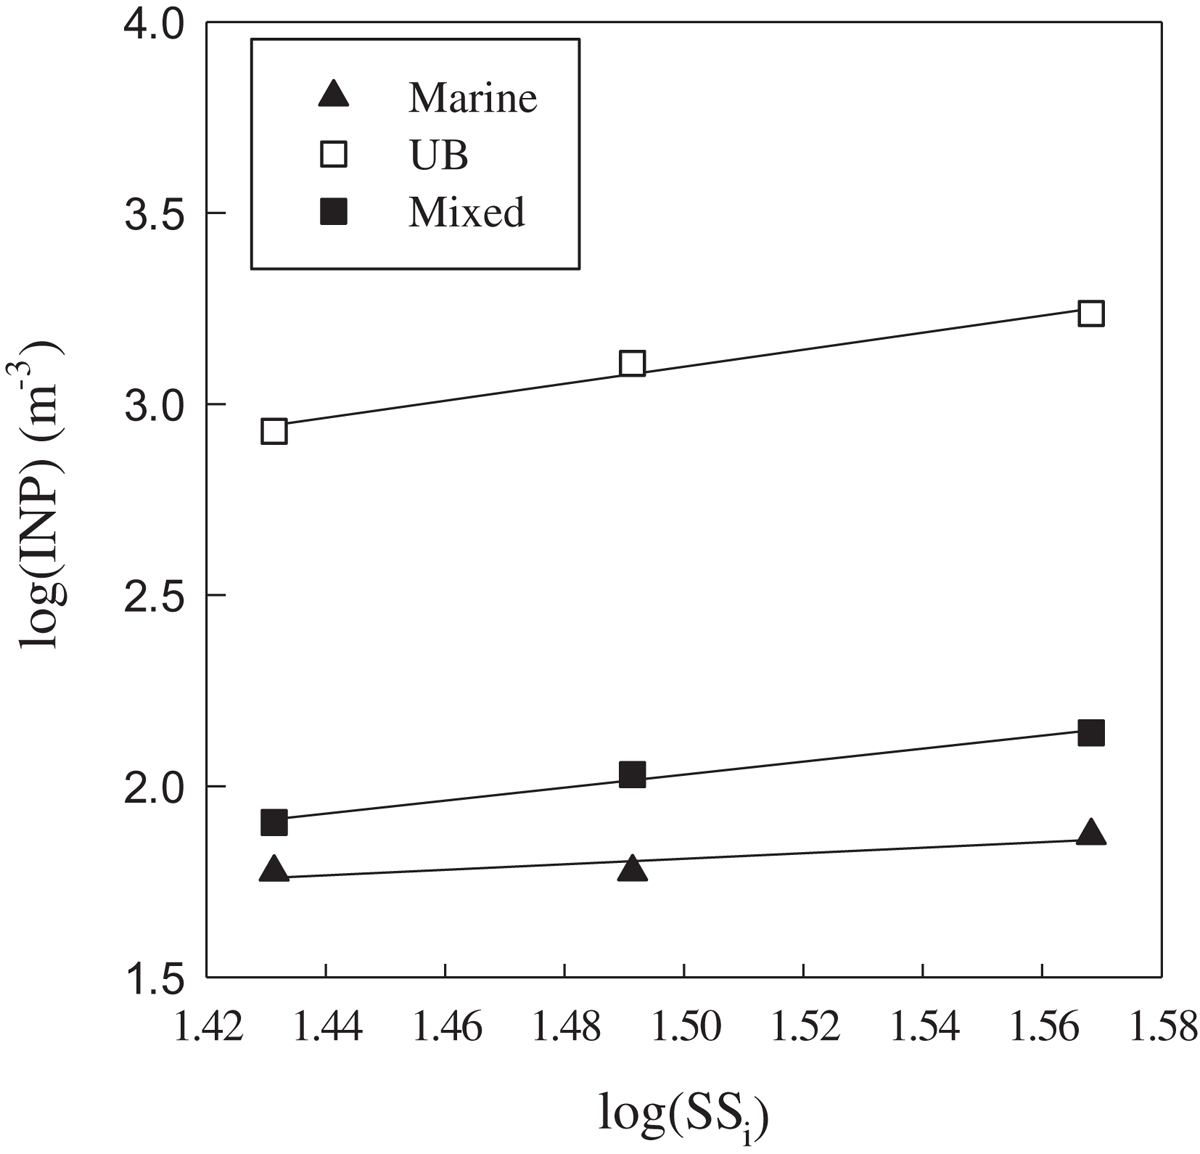
Fig. 7.
Log-log plot of INP concentration versus ice supersaturation for PM10 aerosol fraction.