
Introduction
1.
Most precipitation in middle and high latitude comes from cold clouds containing ice particles (Heymsfield, 2005; Welti et al., 2009; DeMott et al., 2010).
The ice phase in clouds can form through primary processes (nucleation from the liquid or water vapor phases), homogeneously, or heterogeneously in the presence of aerosol called ice nucleating particles (INP). Secondary ice formation processes can derive from ice splinter formation during riming, shattering of cloud drops during freezing in free fall, etc. (Hallett and Mossop, 1974; Leisner et al., 2014). Homogeneous freezing of pure water or solution can only occur at temperatures lower than about −35 °C, depending on the diameter of the droplet and solute concentration, whereas heterogeneous freezing occurs at lower supersaturation and higher temperatures. Four heterogeneous nucleation mechanisms have been identified for atmospheric ice formation: deposition, condensation-freezing, inside-out and outside contact-freezing, and immersion-freezing. The remaining parameters being the same (e.g. chemical-physical properties of the aerosol), deposition and condensation freezing are sensitive to the magnitude of sub- or supersaturated water conditions (Pruppacher and Klett, 1997). Instead, the immersion freezing nucleation process is mainly driven by the temperature of the water drops, with no explicit dependence on water vapour supersaturation (Connolly et al., 2009). Discrepancies between INP and ice crystals number concentrations measured in mixed clouds have sometimes been observed, even when only primary ice nucleation processes occurred. One factor suggested for the observed discrepancies is the high water vapor supersaturation in supercooled cloud pockets (Hobbs and Rangno, 1990; Rangno and Hobbs, 1991; Rogers et al., 1994; Welti and Kanji, 2014). These sites of high supersaturation ratio with respect to water (S w) can be formed during freezing of large water drops (the drop temperature quickly rises to 0 °C), collision–coalescence of droplets in a rising parcel, and riming (Fukuta and Lee, 1986; Rangno and Hobbs, 1991). Peak S w can be reached even in the updrafts in continental and maritime air masses (Rosinski and Morgan, 1988). Numerical models forecast high S w values up to about 1.1 in clouds (Hall, 1980; DeMott et al., 1992; Fukuta, 1993). There is a general consensus that the INP concentration increases when S w rises from 0.95 to 1.01–1.02, a value typically associated with clouds (Pruppacher and Klett, 1997; DeMott et al., 2011).
INP measurement methods could be classified primarily into off-line and on-line techniques. Off-line techniques, aside from immersion freezing nucleation measurements, include filter development in a static diffusion chamber or in a dynamic filter chamber (Langer and Rodgers, 1975). On-line techniques include the AIDA chamber (Möhler et al., 2001) and the continuous flow thermal gradient diffusion chamber (CFDC, Rogers, 1988). Using a dynamic filter processing chamber (DFPC), Rosinski and Lecinski (1983), Stein and Georgii (1985) and Rosinski and Morgan (1988) found that for natural continental aerosol an increase in S w in the range from 1.005 to 1.06 produces a slight increase in INP concentration. However, Berezinskiy and Stepanov (1986) and Saunders and Al-Juboory (1988) found a clear and continuous power law dependence of INP concentration up to S w = 1.03. Saunders and Al-Juboory’s results were consistent with a simultaneously operating CFDC.
Using a CFDC, Al-Naimi and Saunders (1985) measured INP concentration in city air and showed that the activation rate of deposition nuclei decreases as water saturation is reached, indicating that most deposition nuclei are activated below water saturation. The occurrence of deposition nucleation, which is widely prevalent at S w < 1, even at S w ≥ 1, was confirmed by Meyers et al., 1992; Pruppacher and Klett, 1997; Rogers et al., 2001.
Rogers (1993) performed INP measurements with a CFDC in continental air masses finding that the concentration of ice nuclei was closely related to the ice supersaturation (SSi) for humidity both below and above water saturation over the temperature range −7 to −20 °C. Measurements were made up to S w = 1.05. Mizuno and Fukuta (1995) used a CFDC to measure natural ice nuclei (continental air masses, summer of 1993, Salt Lake City) up to S w = 1.1 from −20 to −24 °C. The ratio of INP concentration (N) to that at water saturation (N 0) was estimated. At T = −20 °C a 10% in supersaturation raised the N/N 0 ratio by as much as a factor or two or more. In experiments with soot from natural gas pyrolysis from burning aviation kerosene and engine, Koehler et al., (2009) found an increased nucleation fraction at T = −40 °C and T = −51 °C until S w = 1.05 and afterwards no increase until S w = 1.1.
The International Workshop on Comparing Ice Nucleation Measuring Systems (ICIS 2007) also addressed the problem of the increase in INP concentration versus S w. A spread of four to five INP active fractions between individual instruments at single S w values above 1.02 was obtained for Saharan dusts (DeMott et al., 2011). The source of this discrepancy remains partially unaccountable. However, for individual instruments an increase in INP concentration was observed by increasing relative humidity (r.h.).
Experimental
2.
INP concentration as a function of the saturation ratio with respect to water was investigated for three laboratory-generated aerosol types and for atmospheric aerosol. Aerosol particles were generated with a dry technique obtained by means of a self-built flask dust generator. Three materials were considered: two biological, Microcrystalline Cellulose (MCC, 435236 Aldrich) and Fibrous Cellulose (FC, C6288 Sigma), and one mineral, Arizona test dust (ATD, Powder Technology Inc., 0–3 μm diameter). ATD is composed of a mixture of different minerals, mainly silicates, calcite, and clay minerals (Möhler et al., 2005) and can be considered a proxy for natural mineral dusts of desert origin, which are efficient INP (Prospero et al., 1987; DeMott et al., 2003; Kulkarni et al., 2009; Welti et al., 2009; Kulkarni and Dobbie, 2010).
Cellulose and ATD aerosol particles for ice nuclei assessment were sampled on cellulose nitrate filters (Millipore HABG04700, nominal porosity 0.45 μm) at a sampling flow rate of 2 l min−1. In addition, a cyclone impactor (SCC 1.828, BGI, Inc.) was used in the ATD sampling to remove particles larger than about 1 μm. An optical particle counter (OPC, Grimm, mod. 1.108) was used in parallel to measure the aerosol size distribution.
Atmospheric aerosol was sampled in two different Italian sites: a coastal site in southwest Sicily (CG) and an urban background site at the CNR research area of Bologna. Capo Granitola Climate Observatory (37°34′N; 12°39′E) is located along the southern coast of Sicily facing the Strait of Sicily, 12 km from the municipality of Mazara del Vallo in a N–W direction.
The campaign was carried out in the framework of the Air-Sea Lab: Climate air-pollution interaction research project (ISAC-CNR). The project aims to study the interactions between air pollution and climate in the coastal environment, with a focus on aerosol physical and chemical properties, aerosol–cloud interactions and the nearby coastal boundary layer structure and dynamics. Sampling took place in the period 8–25 April 2016 twice a day (00:00 and 12:00 UTC) and lasted one hour. Meteorological data and aerosol number concentrations were obtained from Capo Granitola Observatory (I-AMICA Project). We chose seven cases in this study and considered one by one events with a prevalent contribution of marine aerosol and those with a concomitant contribution of marine and continental aerosol (hereafter ‘mixed’).
At the CNR research area of Bologna (44°31′N; 11°20′E) measurements were carried out on 9 February 2017 (09:30 UTC, 11:30 UTC and at 15:00 UTC) and lasted 8 min. Bologna is a large city in the Po Valley, an area recognized to have some of the highest levels for many atmospheric pollutants in Europe. The main sources identified were mixed combustion, crustal dust, traffic and ammonium nitrate (Tositti et al., 2014). We will refer to aerosol sampled in Bologna as urban background (UB) aerosol.
At both sites, PM1 and PM10 aerosol fractions were sampled simultaneously on cellulose nitrate filters at 10 and 50 m above ground level at CG and at the CNR area. The mean flow rate was about 38.3 lpm (Bravo H Plus, TCR Tecora). Aerosol fractions were sampled by inserting different sampling heads (1 μm, and 10 μm cut-point-Standard EN 12341, TCR Tecora). Particle number concentration in different size classes starting from diameters larger than 0.3 μm was measured at CG (FAI OPC Multichannel Monitor) and at CNR research area (Optical Spectrometer, Mod.1.108, Grimm Aerosol Technik GmbH).
After sampling, the filters were treated with Vaseline according to Santachiara et al. (2010) and then inserted into the DFPC, a replica of the Langer dynamic developing chamber, for INP concentration measurements in deposition and condensation ice freezing modes.
Air enters the chamber through a nozzle, then flows into a cooling coil placed inside the minced ice to increase the contact time between ice and air. At the end of the coil air spreads into the ice bed and becomes saturated with respect to ice. The temperature of the air is measured just in front of the nozzle aiming the air at the sample to make certain it is the same as the ice. The supersaturations are calculated theoretically from the ice and filter temperatures, and vapour pressure saturation of ice and water (Buck, 1981). Taking into account the accuracy of the air and sample temperature sensors, and the temperature control system, an experimental uncertainty of about 10% for S w was estimated. Increasing the r.h. on the filter inserted into the DFPC causes a transition from deposition to condensation freezing, and the activation through immersion freezing does not happen as the aerosol particle is not immersed in a supercooled aqueous droplet.
Different supersaturations with respect to ice and water can be obtained by controlling the temperatures of the filter and the air flowing continuously grazing the filter. This allows the dependence of the INP concentration to be studied as a function of the saturation ratio with respect to water. In particular, four S w values were chosen: 0.94, 1.02, 1.05 and 1.1. The procedure for both laboratory and atmospheric aerosol can be summarized as follows: each filter was inserted inside the DFPC at a saturation ratio of 0.94 for 15 min. This time allows the ice crystals to grow and become visible so that photography can be taken by a digital microscope and the crystals subsequently counted. The filter was then removed from the chamber, which was set to progressively higher supersaturation conditions.
Results and discussion
3.
Laboratory measurements
3.1
Laboratory measurements concern ATD, FC, and MCC. Fig. 1 shows the variation of AF (a) and ice nucleation active surface site density n s (b) vs. saturation ratio, and Table 1 shows the related percentage variation of AF from 0.94 to 1.1 as S w.
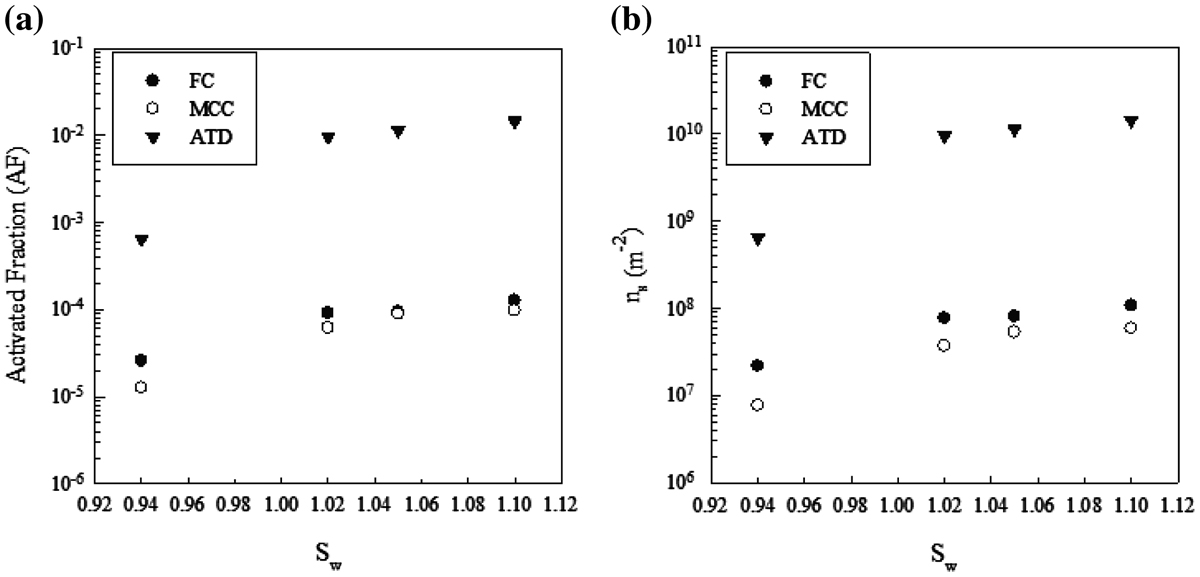
Fig. 1.
Activated fraction AF (a) and n s (b) vs. saturation ratio S w for FC, MCC and ATD.
Table 1.
Percentage variation of AF vs. saturation ratio S w for FC, MCC and ATD.
The AF is given by
where INPconc is the ice nucleating particle number concentration and n a > 0.3 is the number concentration of particles larger than 0.3 μm;
and the INAS density n s
where A aer is the average surface area of the particles larger than 0.3 μm.
The percentage variation of AF at S w = 1.02 with respect to S w = 0.94 was defined as:
Similar expressions are given for the other cases.
Fig. 1 and Table 1 show that the highest increase in AF is related to a change from subsaturated conditions to S w = 1.02, with the highest value for ATD, while the increase in AF from S w = 1.02 to S w = 1.1 is comparable for the aerosols considered. It is known that the increase in S w from subsaturated to supersaturated conditions implies a change from deposition to condensation freezing.
Several papers have been published on the nucleation capability of ATD using different devices, nucleation modes, particle sizes and generation modes. It is known that ice formation is dependent on the composition and size of aerosol, relative humidity and temperature. In addition, when investigated in the laboratory, factors such as aerosol preparation and preconditioning as well as particle detection method and observation time become potentially important (Kanji et al., 2011). Koehler et al. (2007) found that generating Owen Lake aerosol from an aqueous suspension led to no size dependency for onset of ice nucleation, whereas this was not the case when the aerosols were dry-generated. A review of the published papers can be found in Hoose and Möhler (2012). The reported data vary widely: Cziczo et al. (2009) measured an AF of 0.01 at T = −22 °C and S w = 0.98. With ATD particle diameter of 0.8 μm, Welti et al. (2009) obtained an AF of about 3 × 10⁻⁴ at S w = 0.95 and T = −25 °C, about 6 × 10⁻² at S w = 1.02, and about 8 × 10⁻² at S w = 1.09. No activation was measured at T = −20 °C, for S w < 1. Kanji and Abbatt (2010) obtained an AF 10−2 ÷ 10−3 at T = −20 °C for 0.1 μm particle diameter at water saturation.
During ICIS 2007, Kanji et al. (2011) measured an AF of 10−3 at T = −22 °C and S w = 1.05 using a University of Toronto CFDC with ATD dry-generated in the size range 0.02–2.00 μm. An increase in AF up to S w = 1.05 also was measured by DeMott et al. (2011) and Jones et al. (2011).
For uncoated ATD at T = −25 °C, Kulkarni et al. (2014) measured an exponential increase from S w = 0.85 to water saturation with an AF of 7 × 10⁻³ at S w = 0.95. A discontinuous increase in the activated fraction was observed as water saturation was reached. This is most likely due to the onset of condensation freezing in addition to deposition nucleation. The AF was 7 × 10⁻² at S w = 1.02, and 3 × 10⁻¹ at S w = 1.05. The ratio between AF at S w = 1.02 and S w = 0.95 was about 10. These values are higher than those obtained in the present study by about a factor of 10. Instead, the results of Niemand et al. (2012) at T = −21 °C in immersion freezing (reported AF 4 × 10⁻³ and ns 1010 m−2) are comparable with our findings.
Concerning cellulose aerosols, the AF and ns in our experiments were much lower than ATD, and higher in the case of FC with respect to MCC. The ns of FC measured at S w = 1.1 (1.07 × 10⁸ m−2) is comparable with the value (2.35 × 10⁸ m−2) obtained from the immersion mode parameterization of Niemand et al. (2012) for desert dust particles. If FC could be considered a proxy of atmospheric cellulose, the relevance of cellulose in atmospheric INP might be comparable with that of natural mineral dust and one-two orders of magnitude lower than K-feldspar provided they have the same concentrations (Hiranuma et al., 2015).
Field campaigns
3.2
Field campaigns were performed at CG and Bologna. Examining the origin of the air masses, by considering back-trajectories, calculated with the NOAA HYSPLIT model, and wind directions at CG, we inferred that aerosol was prevalently marine in three cases (18/04/2016; 24/04/2016; 25/04/2016) and mixed in the other four cases. Fig. 2 shows the variation of AF (a) and n s (b) vs. saturation ratio for the PM10 aerosol fraction, while Table 2 shows the related percentage variation of AF with respect to S w, by separating marine events and mixed events at CG, and samplings performed in the (UB) area of Bologna.
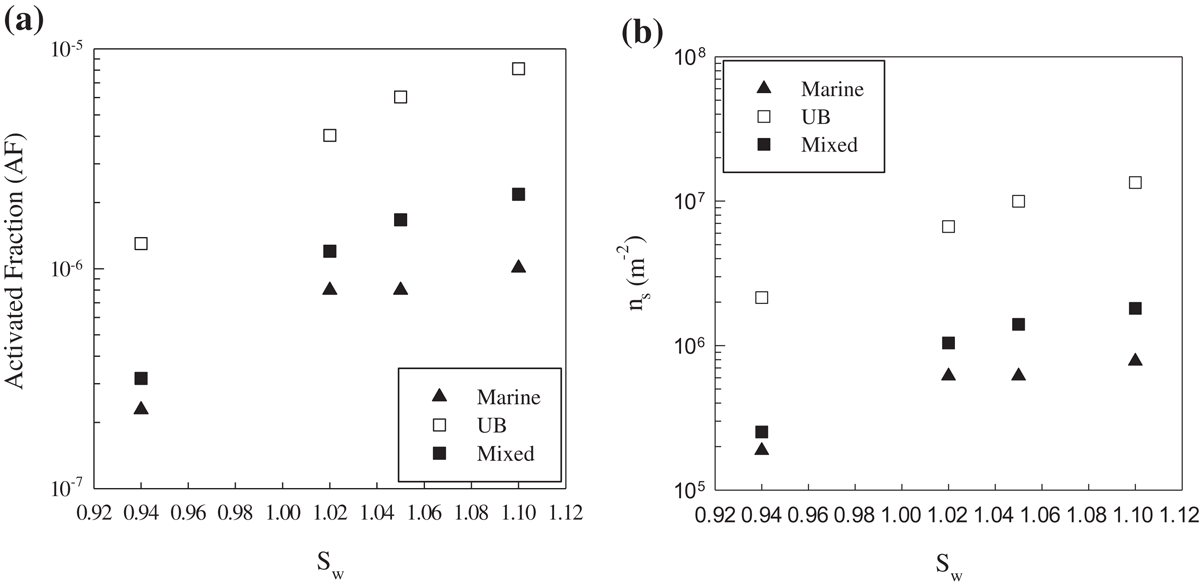
Fig. 2.
Activated fraction AF (a) and n s (b) vs. saturation ratio S w for marine, urban background (UB) and mixed PM10 aerosol.
Table 2.
Percentage variation of AF vs. saturation ratio S w for marine, urban background (UB) and mixed PM10 aerosol.
Generally speaking, there is an increase of INP concentrations, AF and ns from water subsaturated conditions to S w = 1.02 both for laboratory and field campaigns. The percentage increase in AF from subsaturated conditions to S w = 1.02 for marine and mixed aerosol appears comparable with the values obtained from laboratory experiments for FC and MCC, but much lower than ATD. Fig. 3 shows the average INP concentrations in the PM10 aerosol fraction vs. the saturation ratio for marine, UB and mixed aerosol. The percentage increase in INP concentration from S w = 1.02 to S w = 1.1 is about a factor of two, in agreement with Mizuno and Fukuta (1995).
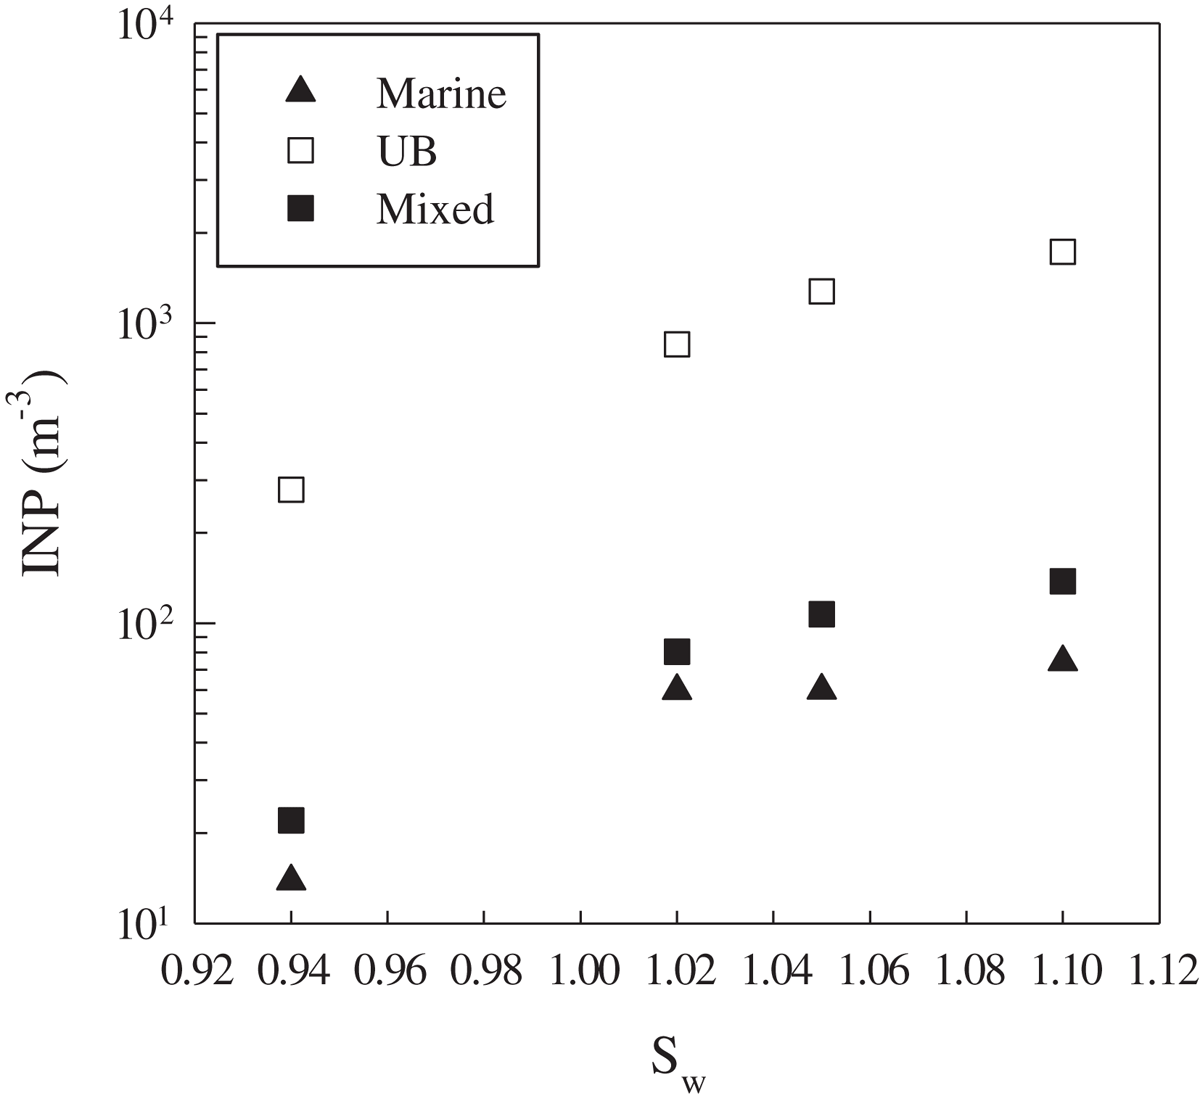
Fig. 3.
Average INP concentration vs. saturation ratio S w for marine, urban background (UB) and mixed PM10 aerosol.
On average, INP concentrations for marine air masses appear lower than mixed air masses and much lower with respect to urban air masses. The lowest INP value was measured at CG on 24 April, 12:00 UTC. At S w = 0.94 INP concentration was 11 m−3, and from S w = 1.02 to 1.1 the INP concentration varied from 30 to 38 m−3. At the sampling site wind was from the West and wind speed was 7.7 m s−1. Fig. 4 shows the back-trajectories. Air masses during the last 24 h travelled through the sea and moved at a low height, about 100 m before arriving at the sampling site (Fig. 4 left). Therefore, a low concentration of crustal insoluble aerosol and mixed soluble/insoluble aerosol should be present.
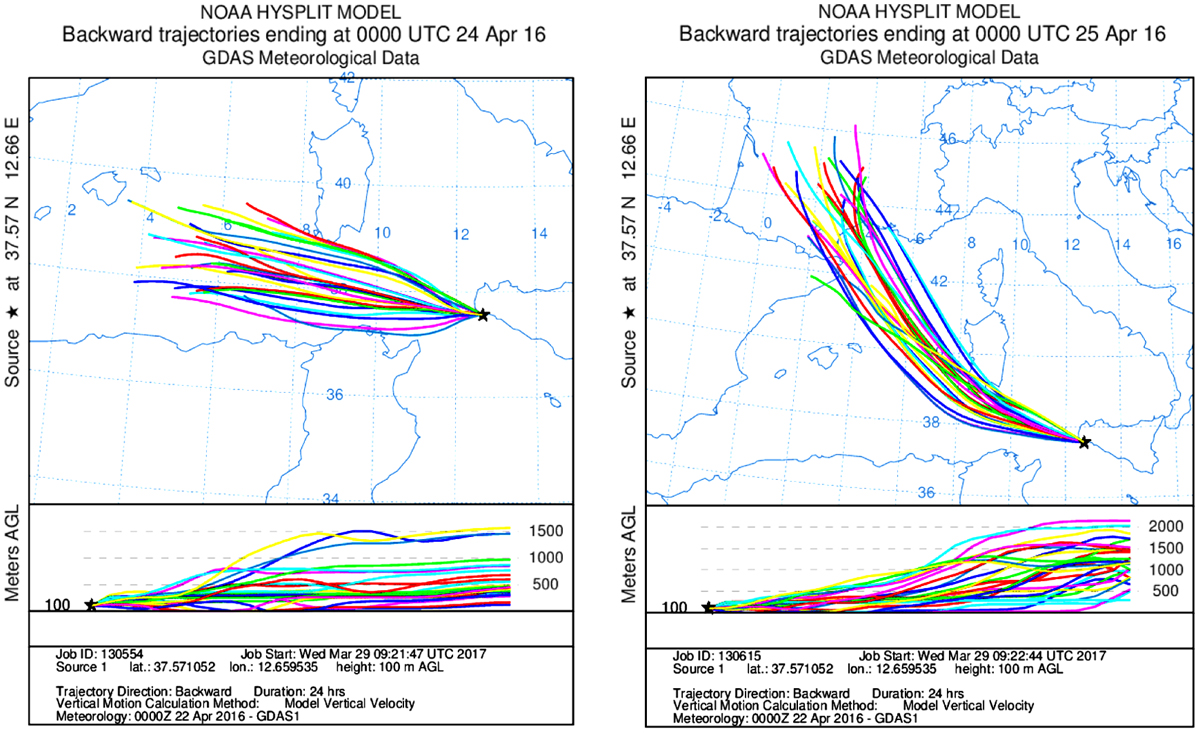
Fig. 4.
24 h back-trajectories on 24 (left) and 25 April (right) 2016 at CG at 00:00 UTC.
On 25/04/2016 the wind speed was higher (~11.7 m s−1), and therefore air masses travelled for a shorter time through the marine area with respect to the case of 24/04/2016 (Fig. 4 right). Higher wind speed determined a higher aerosol generation from the sea, as confirmed by our measurements made with the OPC. The particle concentration with diameter between 0.3 and 10 μm was lower on 24 April (3.9 × 10⁷ m−3) than 25 April (6.4 × 10⁷ m−3). Several papers report an increase in aerosol concentration with wind speed in the marine environment (Prodi et al., 1983; O’Dowd and Smith, 1993; Pant et al., 2008; Huang et al., 2010).
By considering the samplings performed in the UB area of Bologna, Fig. 5a shows the average concentration of INP vs. S w for PM1 and PM10 aerosol fraction, obtained from measurements in the morning, midday and afternoon on 9 February 2017.
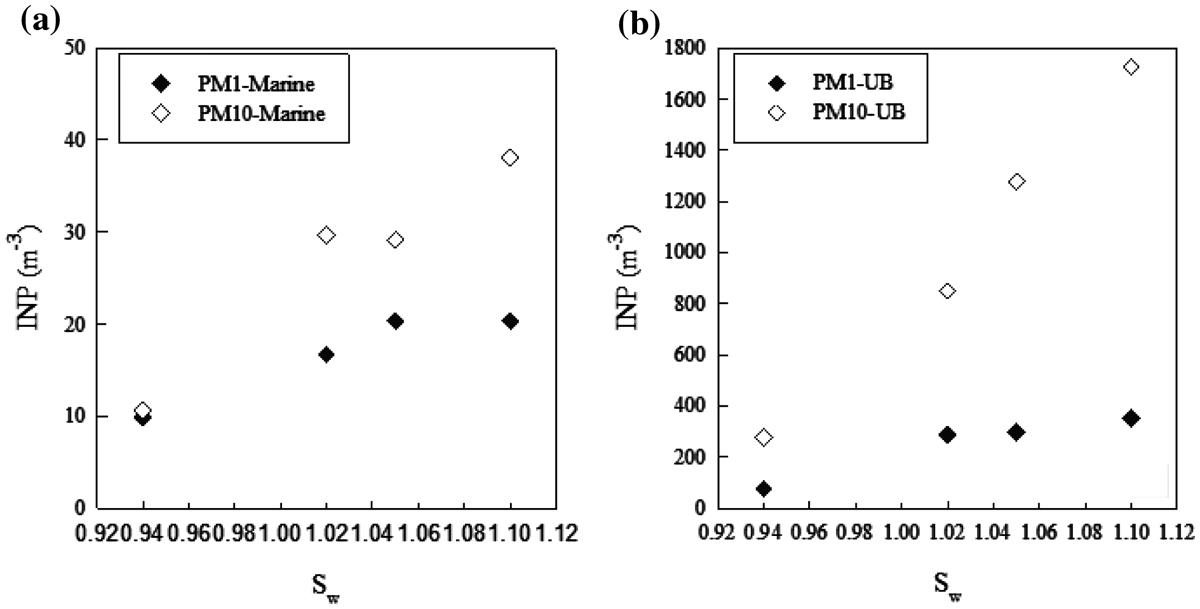
Fig. 5.
INP concentration vs. saturation ratio S w for PM1 and PM10: (a) marine; (b) UB.
There was a high increase in the average INP concentration from PM1 and PM10, even if the average ratio between the aerosol concentration in the PM1 and coarse particles (particle diameter larger than 1 μm) was very high (about 6 × 10²). Therefore, these data confirm the results of published papers, i.e. that the ice nucleation efficiency increases with increasing particle size, and that a large contribution of coarse-mode insoluble aerosol to the overall INP population is provided, both in condensation and immersion freezing (Welti et al., 2009; Santachiara et al., 2010; Kupiszewski et al., 2016; Mason et al., 2016). The operational conditions (T and S w) in our experiments allow the activation of prevalently insoluble particles.
Considering the sampling of PM1 and PM10 at CG (24 April 2016; 00:00 UTC), the ratio between aerosol concentration in the PM1 and coarse particles was much lower than for UB aerosol (~75), but in this case there is a negligible increase in INP, i.e. pure soluble coarse particles do not contribute to INP (Fig. 5b).
Fig. 6 shows the back-trajectories of 9 February 2017 at the CNR research area in Bologna at 09:00 UTC and 15:00 UTC. Air masses throughout the day came from the East.
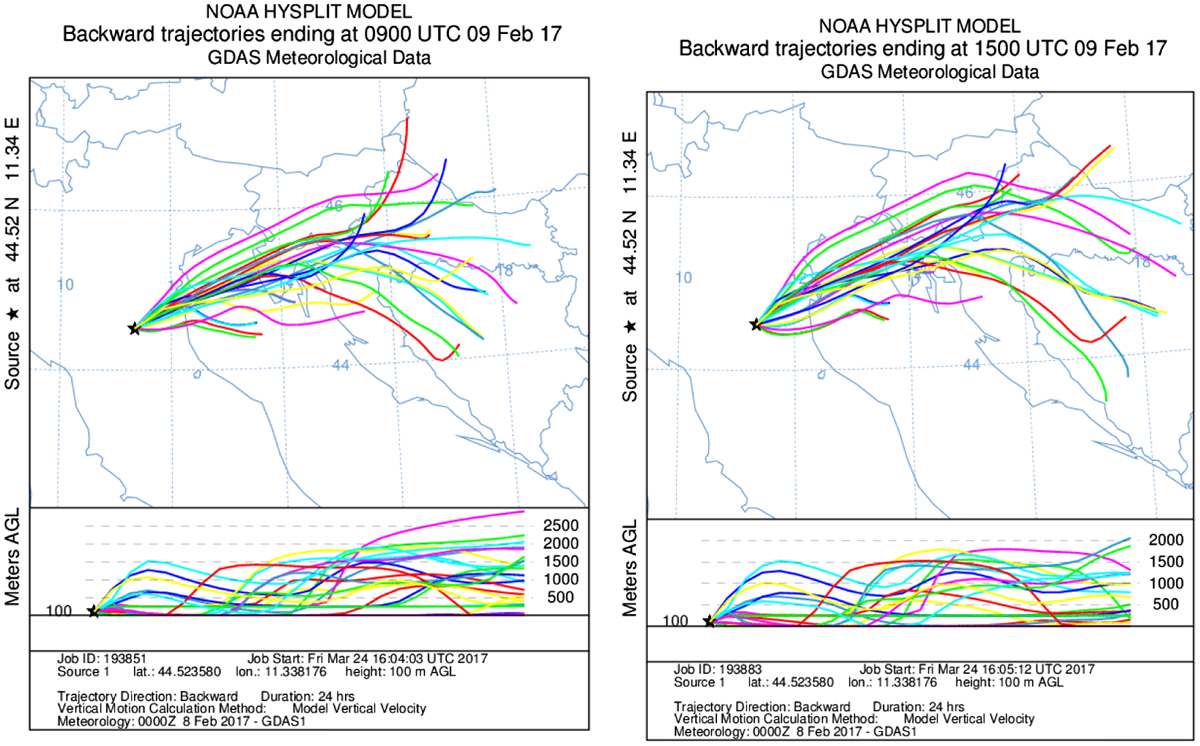
Fig. 6.
24 h back-trajectories on 09 February 2017 at Bologna at: (left) 09:00 UTC and (right) 15:00 UTC.
Parameterization
4.
Our measurements addressed deposition and condensation freezing of marine, mixed and UB aerosol from S w = 0.94 to S w = 1.1 at T = −22 °C. Fig. 7 shows the log–log plot of INP concentration versus ice supersaturation (SSi, %) and the power law fittings in the PM10 aerosol fraction for the supersaturated conditions. Data follow a power law, with the highest slope (2.23 with R 2 = 0.98) for UB aerosol and the lowest (0.72 with R 2 = 0.82) for the marine environment. The mixed case has a slope of 1.70 with R 2 of 0.99.
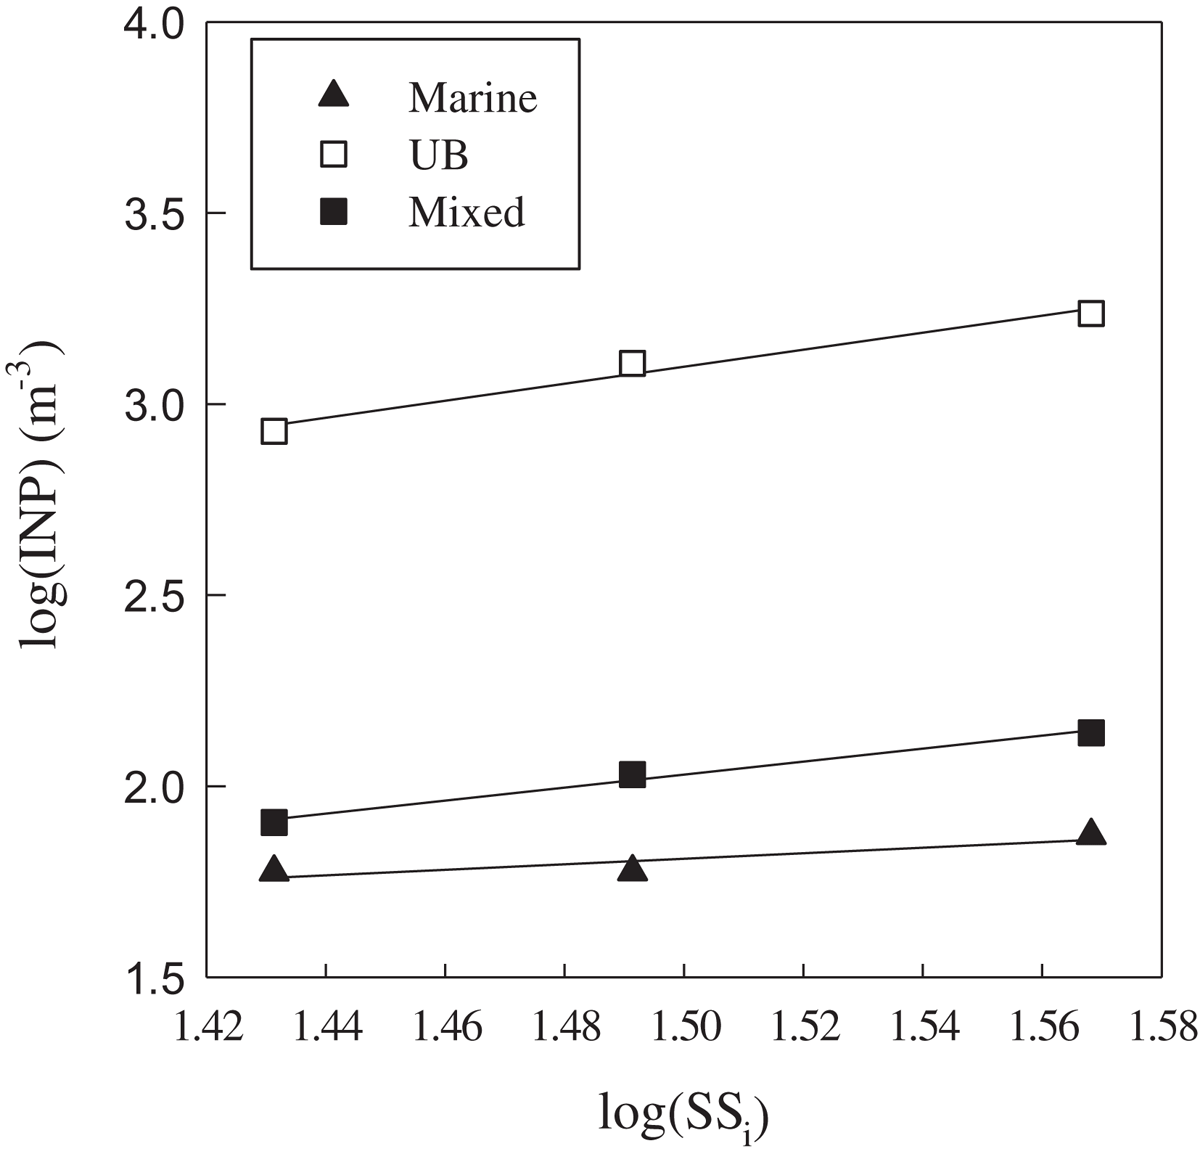
Fig. 7.
Log-log plot of INP concentration versus ice supersaturation for PM10 aerosol fraction.
Several parameterization equations are reported for INP concentrations vs. temperature and supersaturation. Parameterization vs. temperature mainly concerns immersion freezing (Ardon-Dreyer et al., 2011; Niemand et al., 2012), while the dependence on supersaturation and/or temperature concerns deposition and condensation freezing.
A number of parameterizations have been suggested for deposition and/or condensation freezing including an exponential dependence of INP concentration on temperature and/or ice supersaturation (Fletcher, 1962; Cooper, 1986; Meyers et al., 1992; Jiang et al., 2014). Several attempts have also been made to derive INP concentrations simultaneously as a function of temperature and ice supersaturation (Berezinskiy and Stepanov, 1986; Cotton et al., 1986; López and Ávila, 2013). Rogers (1993) suggested deposition freezing depends on both water subsaturation and supersaturation, while condensation freezing depends on temperature.
The cited parameterizations were obtained by fitting the spectrum of the INP concentration in field campaigns, and therefore the empirical regression parameters change with sites, due to the variable concentration and chemical–physical properties of the aerosol. For example, the formulation of Meyers et al. (1992) obtained from measurements of Rogers (1982) and Al-Naimi and Saunders (1985) will overpredict ice crystal concentrations in the Arctic, where low number concentration of particles can act as INP (Prenni et al., 2007).
Concerning subsaturated conditions, our results can be compared with those obtained by Huffman (1973) who gave a power law parameterization equation to estimate the INP concentration as a function of ice supersaturation independent of temperature between −7 and −20 °C. By considering the Huffman parameterization (INP = c , with c and α empirical parameters), the normalized INP value at S w = 0.94 (SSi = 17%) with respect to S w = 1.02, i.e. at approximately water saturation, is 0.25, by choosing α = 3 (the value suggested for rural sites). This value is comparable with our experimental results for marine and mixed aerosol (0.23 and 0.27, respectively). For UB aerosol the normalized concentration is higher than the Huffman equation, for α in the range 3 ÷ 8 value (range suggested for rural and urban sites).
By combining field measurements from a variety of locations around the globe in supersaturated conditions, DeMott et al. (2010) suggested an INP number concentration parameterization in mixed-phase cloud, related to temperature and the number concentrations of particles larger than 0.5 μm. By considering the urban sampling, the INP concentration expected from DeMott et al. (2010) is higher (12 × 103 m−3) by about one order with respect to our measurements (0.8 × 10³ m−3 at S w = 1.02 and 1.7 × 10³ m−3 at S w = 1.1).
This factor of about one order is still found with the expected results from the parameterization proposed by Tobo et al. (2013) which generally describes the size and temperature dependence of various composition-specific types of INPs and is a modified version of the DeMott et al. (2010) parameterization.
Prevalently, the parameterizations reported above give higher INP concentrations than our results, both at water subsaturation and supersaturation. Instead, Bowdle et al. (1985) measured ice nucleus spectra from an aircraft at various locations over the High Plains of the United States during spring and summer 1975 and 1976, obtaining results comparable with our urban site. The characteristic INP spectrum was represented by INP (l−1) = 2 × 10⁻⁴ exp(−0.3 ΔT), where ΔT is the supercooling. Filter samples were examined using the Langer and Rodgers technique (1975).
Conclusions
5.
The INP concentration in cold clouds is important for precipitation formation in middle and high latitude and for radiative properties of clouds. To understand ice nucleation even at high supersaturation, we performed experiments from water subsaturated conditions (S w = 0.94) to saturation ratio S w = 1.1 (10% water supersaturation). The DFPC was used to explore the ice nucleation of the tested aerosol in the deposition and condensation freezing modes. We investigated the ice nucleating behaviour as a function of the water saturated ratio for three dry-generated aerosol types, and atmospheric aerosol sampled on filters in two different sites: CG (a coastal site in southwest Sicily) and a UB site (Bologna). The aerosols tested were cellulose (microcrystalline and fibrous) and Arizona Test Dust composed of a mixture of different minerals. The field campaigns considered PM1 and PM10 aerosol fractions, but only the PM1 fraction for laboratory-generated aerosol.
Our results showed that for cellulose aerosol, the AF and ice-active surface site density ns are much lower than ATD, and higher in the case of FC with respect to MCC. The ns of FC measured at S w = 1.1 was 1.07 × 10⁸ m−2, comparable with the value (2.35 × 10⁸ m−2) obtained from the immersion mode parameterization of Niemand et al. (2012).
Generally speaking, there was an increase in INP concentrations, AF and ns from water sub-saturated conditions to S w = 1.02 both for laboratory and field campaigns. This increase is due to the transition from deposition nucleation to condensation freezing.
The percentage increase in AF from subsaturated conditions to S w = 1.02 for marine and mixed aerosol appears comparable with the values obtained from laboratory experiments for FC and MCC, but much lower than ATD.
The highest increase in AF and ns from S w = 1.02 to S w = 1.1 was obtained for UB and mixed aerosol and the lowest for marine aerosol. The power law fit of AF from S w = 1.02 to S w = 1.1 for continental and mixed aerosol shows a correlation coefficient R 2 = 0.98 and 0.99, respectively. These data highlight the atmospheric interest in performing measurements of ice nucleation for continental aerosol even at supersaturation higher than 2%, a value typically associated with clouds.
In the case of marine aerosol, the increase in the average INP concentration from PM1 and PM10 is small, whereas in the UB area of Bologna the increase is very high. These data offer further evidence of the high contribution of insoluble coarse aerosol to INP concentration.
Disclosure statement
No potential conflict of interest was reported by the authors.
Funding
This work was supported by the BACCHUS (FP7-ENV-2013) [grant number 603445].
Acknowledgments
The Capo Granitola Observatory was set up in the framework of I-AMICA Project (Italian National Operation Program for Research and Competitiveness 2007-2013), while the field campaign was conducted as part of Air-Sea-Lab (CNR-Joint Lab projects, http://www.isac.cnr.it/airsealab) and Project BACCHUS (FP7-ENV-2013, grant number 603445). The Ice Nuclei research UnIT (INUIT) for scientific and technical discussions made amongst partners and the cellulose aerosol shared by the research consortium. Authors are grateful to Matteo Rinaldi (ISAC-CNR, Bologna) for field support during measurement campaign at Capo Granitola.