Have a personal or library account? Click to login
Laboratory study of H2SO4/H2O nucleation using a new technique – a laminar co-flow tube Cover

Laboratory study of H2SO4/H2O nucleation using a new technique – a laminar co-flow tube

Open Access
|Jan 2018

Figures & Tables

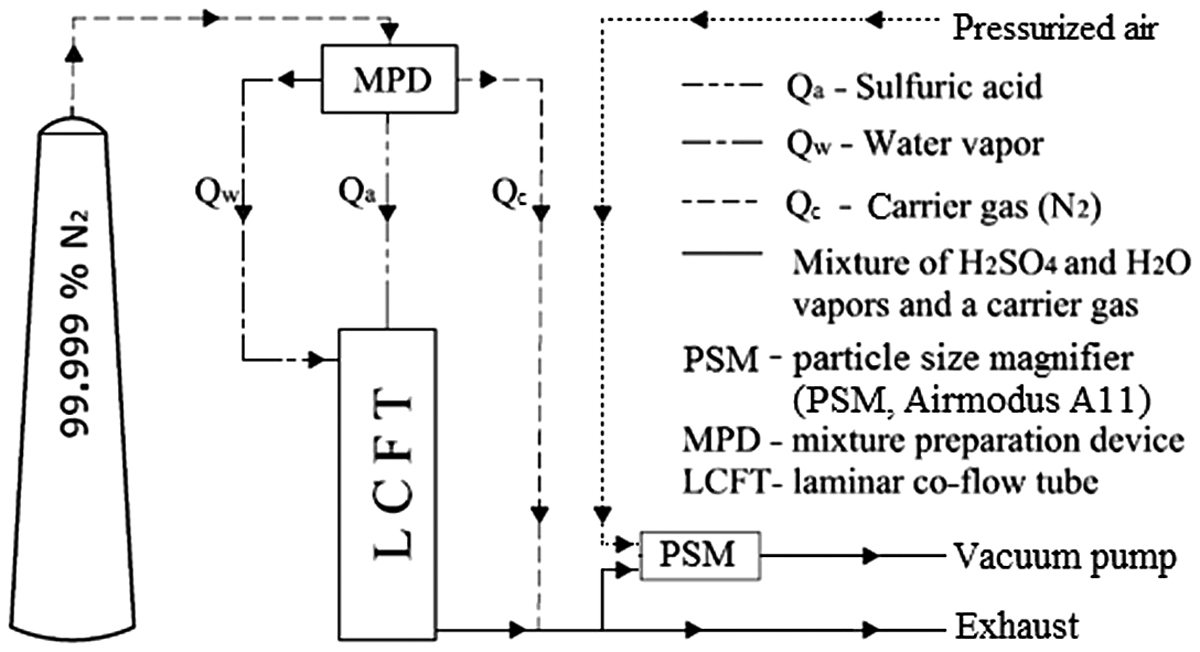
Fig. 1.

A schematic description of the experimental setup, including the laminar co-flow tube.
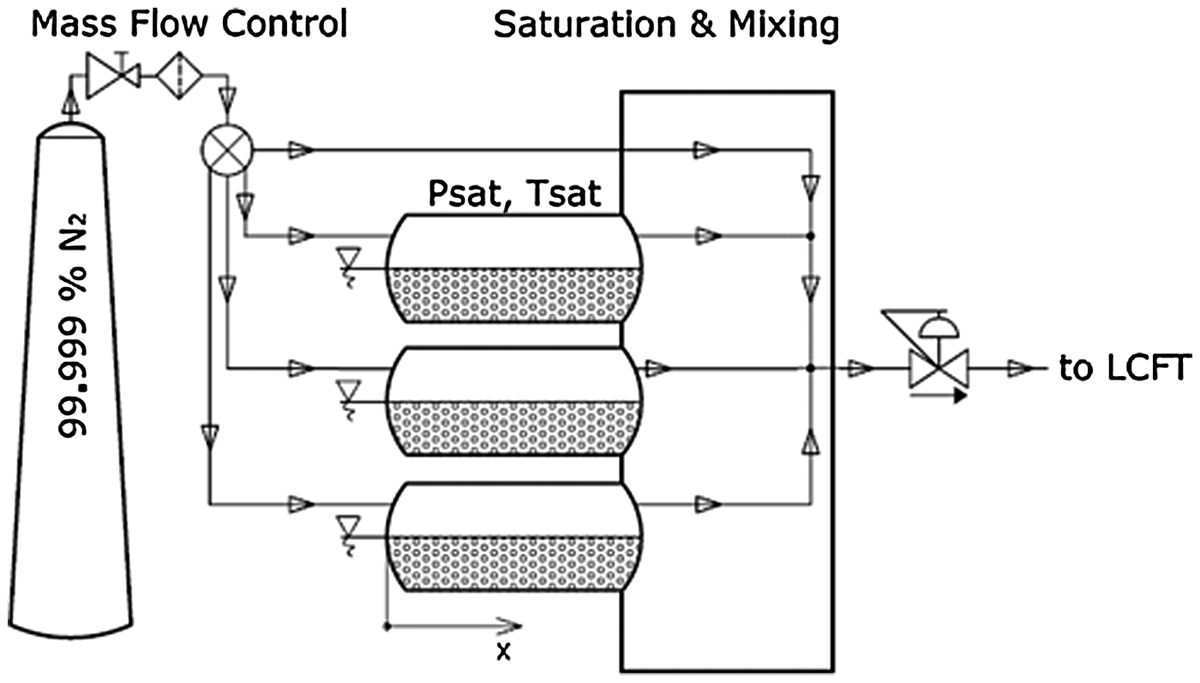
Fig. 2.

The mixture preparation device consists of three saturators where the stream of the carrier gas is saturated with the desired vapour.
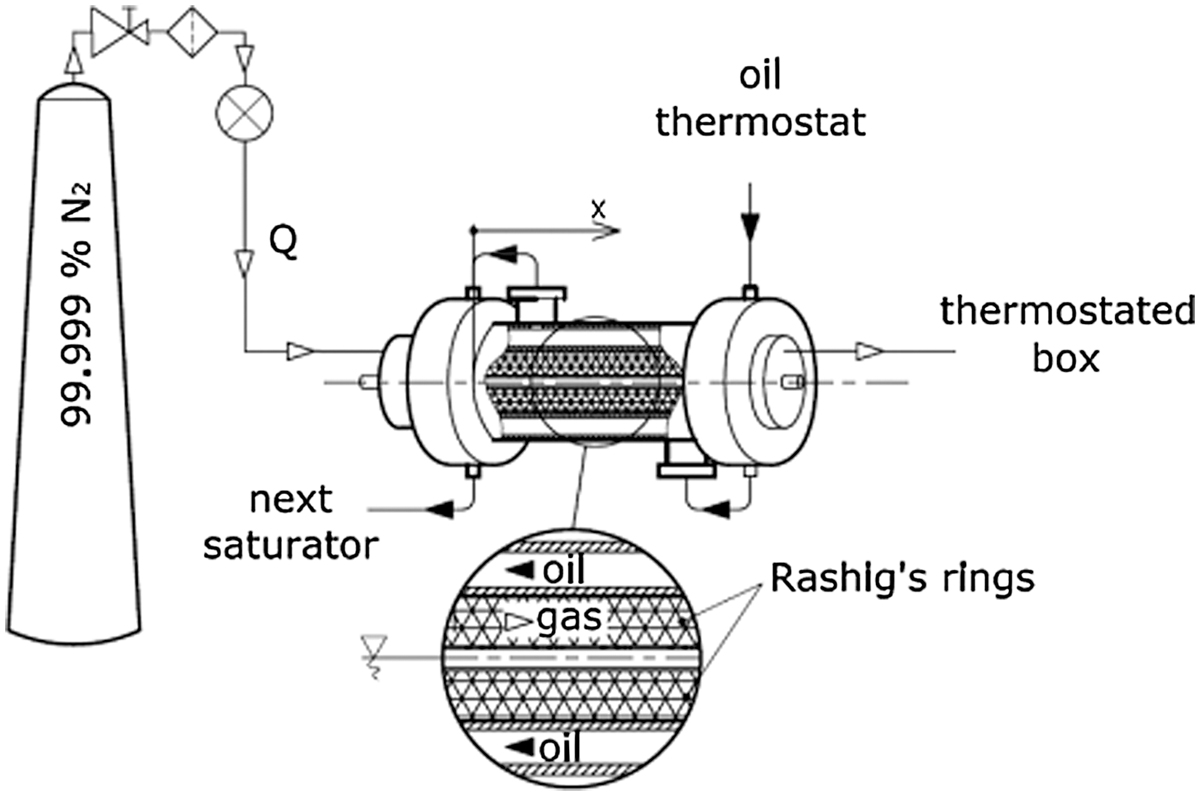
Fig. 3.

A detailed depiction of the inner layout in the saturators used in the mixture preparation device.

Table 1.

Verified temperature range and maximal flow rate allowing stable and repeatable saturated vapour generation in the saturator.
MediaQ˙ [l min−1]Tsat [°C]Water220 ÷ 65Sulphuric acid0.2520 ÷ 65

[i] Note: The temperature limits are related to used thermostating equipment, the saturator itself is designed for 100 °C.

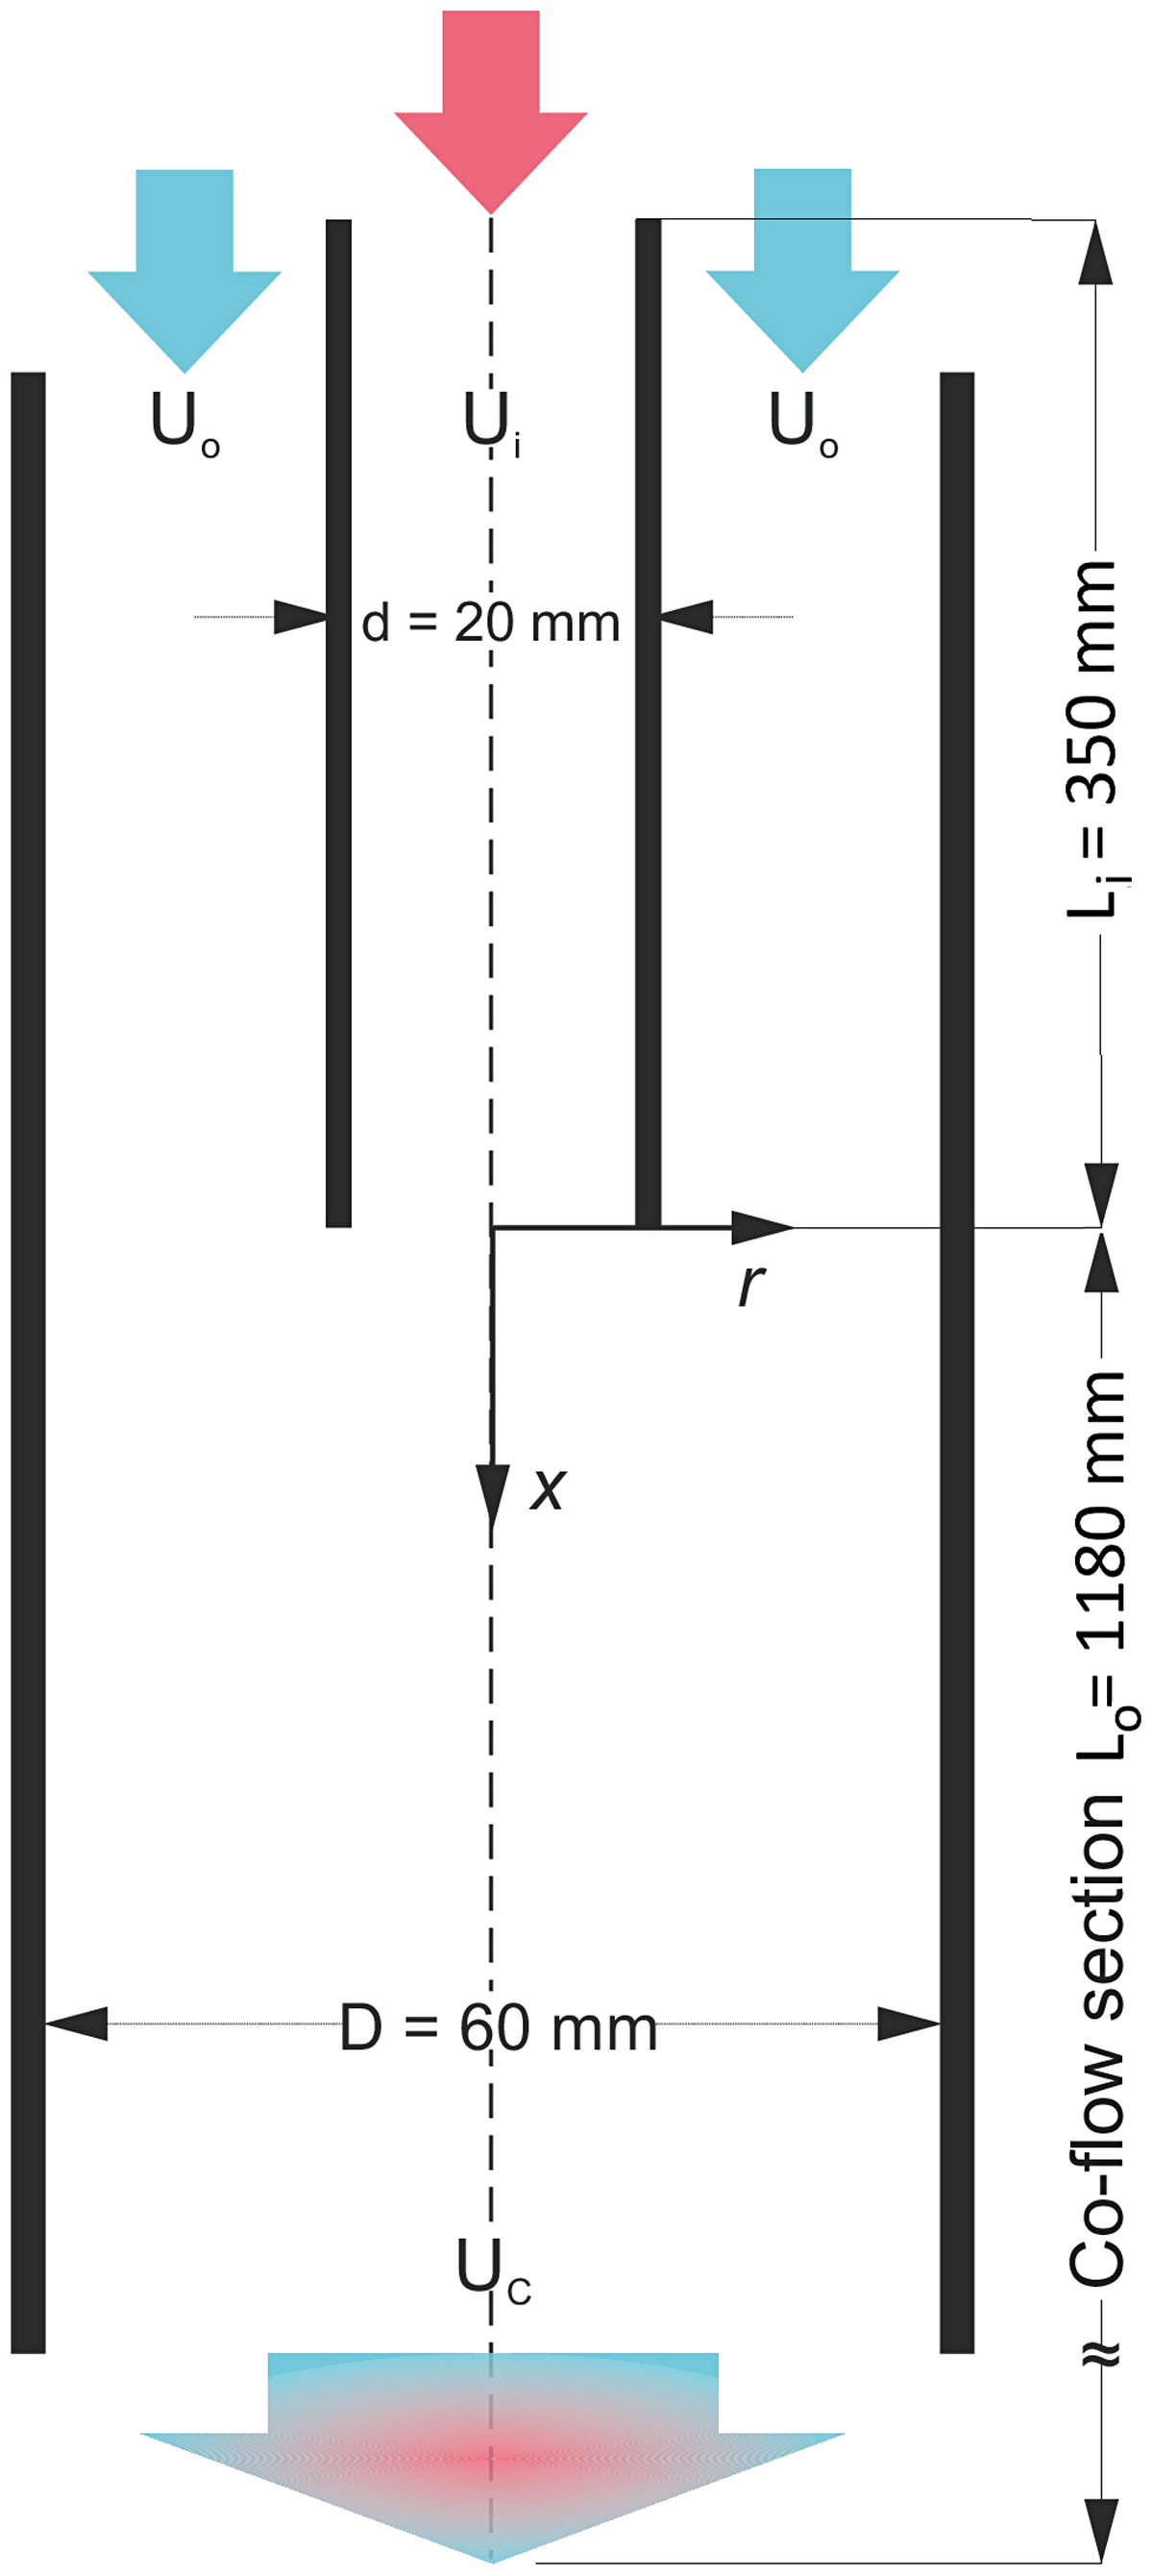
Fig. 4.

A detailed description of the design of the laminar co-flow tube.

Table 2.

Parameters used in the experimental set up and the corresponding results, p atm = 101.325 kPa.
Tsat [°C] Tchamb [°C] Q˙WQ˙SAN [# cm−3][l min−1][l min−1]22.53 24.78 0.780.254.7222.34 25.09 0.770.256.1722.36 24.49 0.760.256.5321.82 24.86 0.750.2516.7323.21 22.81 0.740.258.7322.88 25.13 0.730.2548.1723.50 24.82 0.720.2527.7022.11 24.76 0.710.258.8822.05 25.03 0.700.2512.1023.37 25.09 0.690.259.14
Fig. 5.

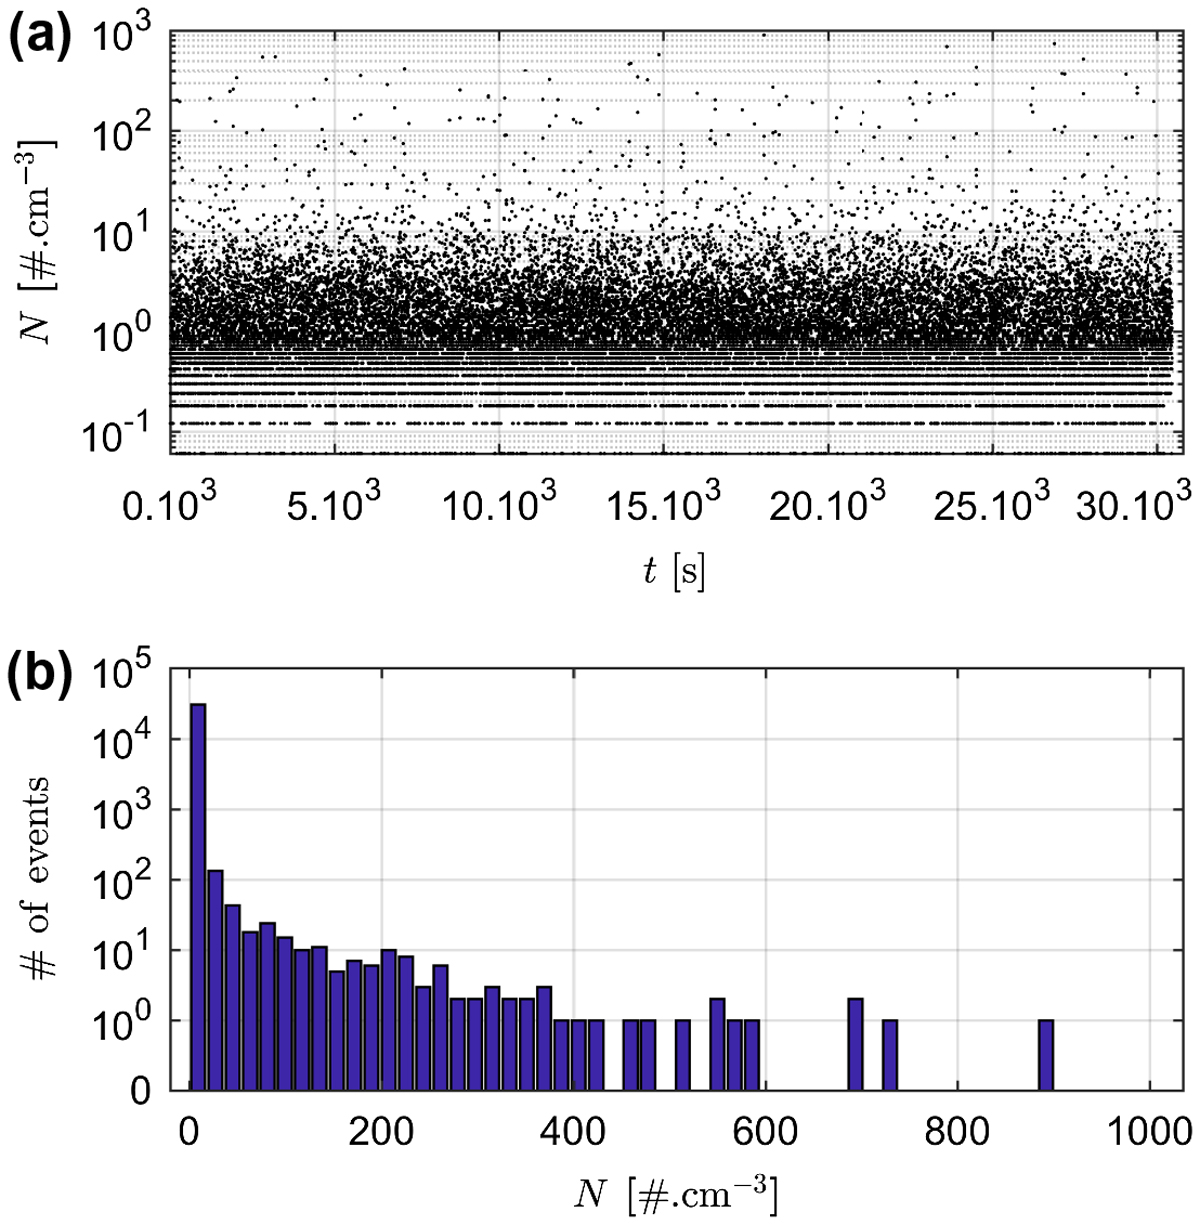
Postprocessing of measured concentrations, T sat = 22.47 [°C], Q˙W = 0.76 [l min–1], Q˙SA = 0.25 [l min–1].

Table 3.

Deviations caused by different setting of limit concentration N limit, T sat = 22.47 [°C], Q˙W = 0.76 [l min−1], Q˙SA = 0.25 [l min−1].

Nlimit [# cm−3]Naverage [# cm−3]Deviation from the whole data-set (Nlimit = 1000) [%]1004.67–28.552005.20–20.483005.72–12.534005.87–10.225005.97–8.616005.97–8.617006.31–3.408006.31–3.409006.31–3.4010006.530.00
Table 4.

Results obtained by CFD simulations, p atm = 101.325 kPa, coordinate of nucleation maximum on the axis of the co-flow section x = 0.53 cm.
Q˙WJtheormaxJexpmaxRaRh[H2SO4] Rh33JexpRh33[l min−1][cm−3 s−1][cm−3 s−1][–][–][cm−3][cm−3 s−1]0.782.80 × 10127.47 × 1010.620.453.38 × 10111.11 × 1010.777.25 × 10119.52 × 1010.580.443.37 × 10112.95 × 1010.764.73 × 10121.00 × 1020.630.463.40 × 10111.70 × 1010.752.43 × 10112.47 × 1020.550.422.41 × 10111.80 × 1000.742.43 × 10141.32 × 1020.750.503.42 × 10111.14 × 1010.732.63 × 10126.95 × 1020.610.453.56 × 10111.31 × 1020.723.20 × 10133.98 × 1020.690.483.94 × 10115.48 × 1010.718.47 × 10111.22 × 1020.590.443.28 × 10113.93 × 1010.703.56 × 10111.64 × 1020.560.432.65 × 10112.58 × 1000.696.88 × 10111.22 × 1020.580.432.95 × 10114.86 × 100
Fig. 6.

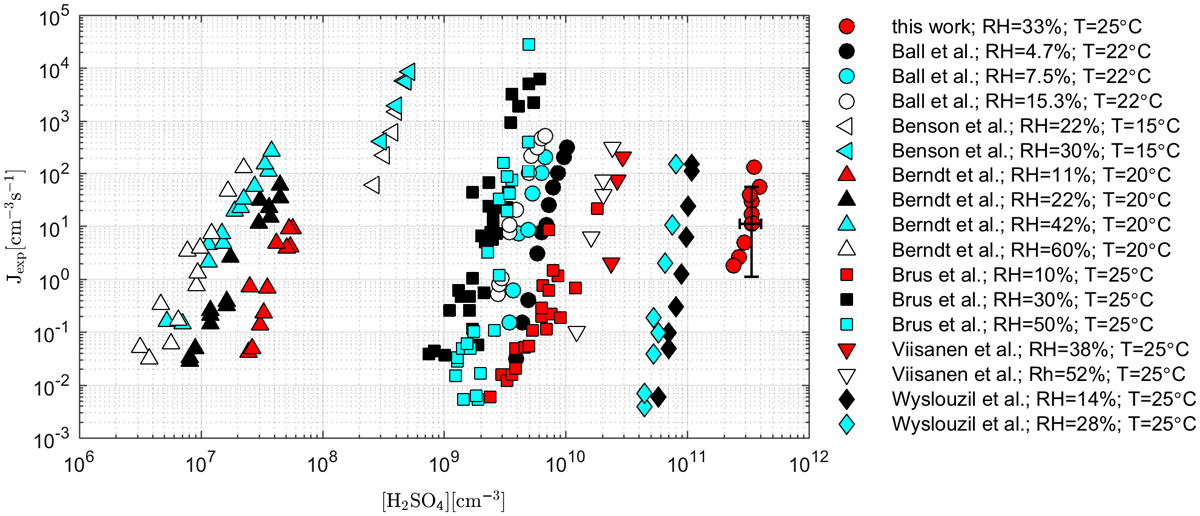
Comparison of our results with data obtained by other authors using different types of experimental devices. The dependence of the experimental nucleation rate on the concentration of sulphuric acid in the chamber during the constant value of Rh. Uncertainties of experimental data obtained by LCFT are marked.

Table 5.

Values of coefficients used in Equation (A2).

a = 19.301142b = 2892.3693c = 2.892736d = –4.9369728 × 10–3e = 5.606905 × 10–6f = –4.645869 × 10–9g = 3.7874 × 10–12
Table 6.

Properties of sulphuric acid.

M = 9.81 ⋅ 10–2[kg mol−1]DSA,N2=0.2094·10-4T298.151.75/p101.325Ayers et al. (1980)[m2 s−1]
Table 7.

Properties of water vapour.

M = 1.80 × 10–2[kg mol−1]DSA,N2=0.2061×10⁻⁴T273.152.031/p101.325O’Connell et al. (1969)[m2 s−1]
Table 8.

Properties of nitrogen T chamb = 25 °C and p atm = 101.325 kPa.

M = 2.80 × 10–2 [kg mol−1]R = 8.314 × 103 [J kmol−1 K−1]ρ = 1.145 [kg m−3]η = 17.9 × 10–6 [Pa s]
Language: English
Page range: 1446643 - 1446643
Submitted on: Jul 26, 2017
Accepted on: Feb 26, 2018
Published on: Jan 1, 2018
Published by: Stockholm University Press
In partnership with: Paradigm Publishing Services

© 2018 Tereza Trávníčková, Lenka Škrabalová, Jaromir Havlica, Petr Krejčí, Jan Hrubý, Vladimír Ždímal, published by Stockholm University Press
This work is licensed under the Creative Commons Attribution 4.0 License.