
Introduction
1.
Atmospheric nucleation is a process in which new particles are produced directly by gas to particle conversion from various gas phase compounds (Seinfeld and Pandis, 1998). This process is a key factor in controlling the particle number concentration of atmospheric aerosols and models suggest that it also contributes to a large fraction (15–55%) of the cloud condensation nuclei concentration on the global scale (Merikanto et al., 2009). Newly formed particles affect the global climate, cloud formation and the global radiation budget by scattering sunlight and by forming smaller, but more numerous, cloud droplets, which affect the optical properties of clouds and prolong cloud life time (Almeida et al., 2013). Despite its importance for the climate, atmospheric nucleation is still not well understood. The current inability to quantify atmospheric nucleation correctly causes huge uncertainties in climatic model assessments of the direct and indirect effects of aerosol particles on climate (Spracklen et al., 2006; Merikanto et al., 2009).
The key compound involved in atmospheric nucleation is sulphuric acid (Riipinen et al., 2007; Sipila et al., 2010; Brus et al., 2011; Brus et al., 2017), which originates in the atmosphere from the oxidation of sulphur dioxide. However, the maximum daytime H2SO4 concentrations in the boundary layer, which typically range from 106 to 107 # cm−3, were found to be insufficient for the binary nucleation of H2SO4 and H2O (Kirkby et al., 2011). The presence of additional chemical species such as ammonia (Ball et al., 1999; Merikanto et al., 2007), amines (Berndt et al., 2010), or organic species (Smith et al., 2008) stabilizes the clusters and decreases evaporation and, thus, enhances the nucleation of sulphuric acid particles. However, Kirkby et al. (2011) reported that typical atmospheric concentrations of ammonia and sulphuric acid are too low and cannot explain the particle formation rates observed in the boundary layer via H2SO4–NH3 nucleation. A recent study (Almeida et al., 2013) showed that even a very low concentration of amines (5 parts per trillion by volume) enhances particle formation rates up to 1000-fold compared to ammonia. However, which mechanism of atmospheric nucleation is dominant in the atmosphere still remains an open question (Kulmala, 2003).
Several experimental devices have been developed to determine the nucleation rates in both single and multicomponent systems in laboratory studies. The main difference between various devices is the mechanism used to achieve the supersaturated state of the system. The supersaturation can be reached by diffusion of the nucleating vapours (Ball et al., 1999; Benson et al., 2008; Benson et al., 2009; Berndt et al., 2010; Benson et al., 2011; Brus et al., 2011) or by cooling the vapours by either temperature gradient (Katz and Ostermier, 1967; Brus et al., 2005; Herrmann et al., 2010; Zollner et al., 2012; Travnickova et al., 2013) or adiabatic expansion (Wagner and Strey, 1981; Peters, 1982; Viisanen and Strey, 1994). The binary nucleation of H2SO4–H2O presents the most important atmospheric nucleation system (Benson et al., 2008). However, there is not only a limited number of studies on this system, but various reported laboratory measurements differ greatly in the measured nucleation rate J [cm−3 s−1] and its dependency on [H2SO4] (the number concentration of sulphuric acid molecules). In these experiments there are two main approaches to produce the gas phase sulphuric acid: H2SO4 vapour can be produced by passing the stream of a carrier gas over a liquid sample, or an in situ reaction of OH– radicals with SO2 can be used. In case of photochemical in situ production, the spatial H2SO4 profile is almost uniform and the growth of nucleated particles to detectable sizes is sufficient. On the contrary, in the case of a liquid sample as a point source, the H2SO4 concentration decreases rapidly with time owing to significant wall losses and particle growth is therefore limited. Different H2SO4 profiles in experimental devices make the comparisons of various studies difficult. Other challenges present in H2SO4–H2O nucleation experiments are the counting efficiency of the particle counter and ensuring sufficient residence time, which ensures that the nucleated particles grow to detectable sizes (Berndt et al., 2010). All these above mentioned experimental parameters directly influence the measured nucleation rate J and its dependence on [H2SO4] and contribute to the different J values reported from various studies (Viisanen et al., 1997; Ball et al., 1999; Benson et al., 2008; Young et al., 2008; Sipila et al., 2010; Brus et al., 2011; Berndt et al., 2014; Wyslouzil and Wölk, 2016).
Due to these differences between various experimental techniques, inexplicable at the current level of knowledge, it is essential, if possible, to get new data using other experimental methods and equipment. Mutual comparison of the obtained results, together with good understanding of individual methods, can significantly contribute to identifying and overcoming the weaknesses of various experimental techniques and accelerate their further development. This will lead to achieving more reliable results and, consequently, to better understanding the process of nucleation, whether it takes place in the laboratory or in the atmosphere.
In this work, we present a novel device for binary or ternary nucleation experiments – a laminar co-flow tube (LCFT) – which has been designed and constructed in collaboration of the Institute of Chemical Process Fundamentals and the Institute of Thermomechanics. The first set of experiments performed focused on the investigation of H2SO4–H2O nucleation. The primary objectives of this study were: (i) the detailed description of LCFT design and experimental set-up; (ii) the evaluation of LCFT performance; (iii) and the comparison of our experimental results with previously published data.
Experimental section
2.
A detailed description and the operational principle of the experimental set-up and the laminar co-flow tube are given here (Krejčí, 2010). The whole experimental set-up consists of three main parts: (i) the mixture preparation device (MPD); (ii) the laminar co-flow tube (LCFT), (iii) and the particle counter (in our experiments a Particle Size Magnifier, Airmodus). It is schematically depicted in Fig. 1.
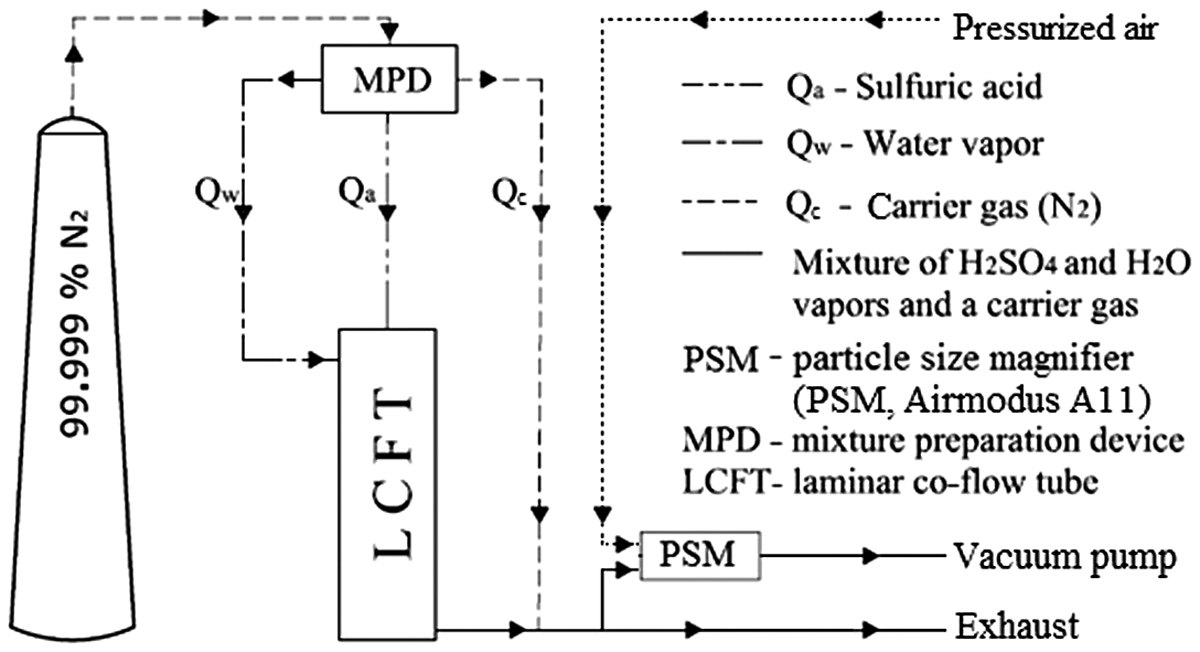
Fig. 1.
A schematic description of the experimental setup, including the laminar co-flow tube.
Mixture preparation device
2.1.
The first part of the experimental set-up is the mixture preparation device (MPD), which is a specially designed heat and mass exchanger allowing for the preparation of up to three vapour-saturated gas streams (Fig. 2).
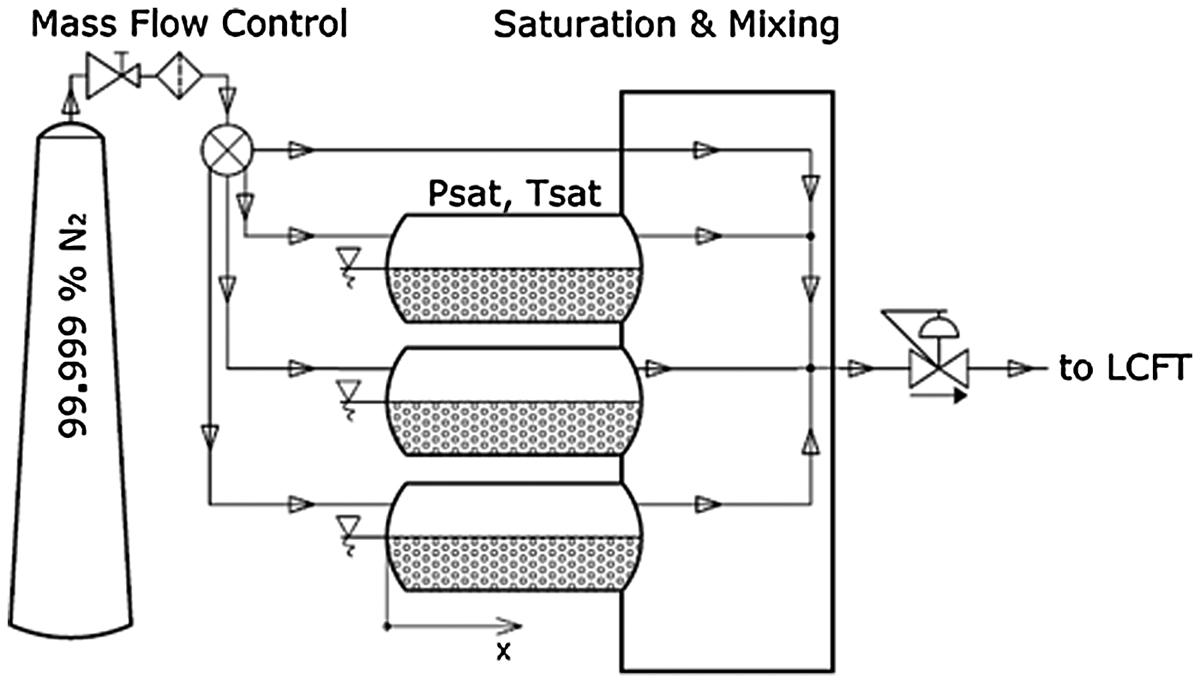
Fig. 2.
The mixture preparation device consists of three saturators where the stream of the carrier gas is saturated with the desired vapour.
The MPD consists of three horizontal steel cylinder saturators with Teflon coatings. The saturators are fully filled with Rashig’s rings to intensify the mass transport and to reach the saturation of the carrier gas with the vapour at the exit (Fig. 3). The whole MPD is thermally insulated and kept at a constant temperature by a liquid circulating bath. The temperatures inside the saturators are measured with Pt100 resistance thermometers. The flows of carrier gas entering the saturators are regulated using three electronic mass flow controllers (Bronkhorst), each with different flow rate ranges (0.5; 1.2 and 2.5 l min-1). The saturator flow rates are set to ensure that the carrier gas is fully saturated with water or sulphuric acid vapour while flowing above the liquid surface. Since the length of the saturator (surface area) is limited, behaviour of the saturator was tested in the range of flow rates vs. temperature vs. media (water, SA) to obtain suitable operational parameters. According to Krejčí (2010), the saturators allow stable and repeatable saturated vapour generation in the range of parameters defined in Table 1.
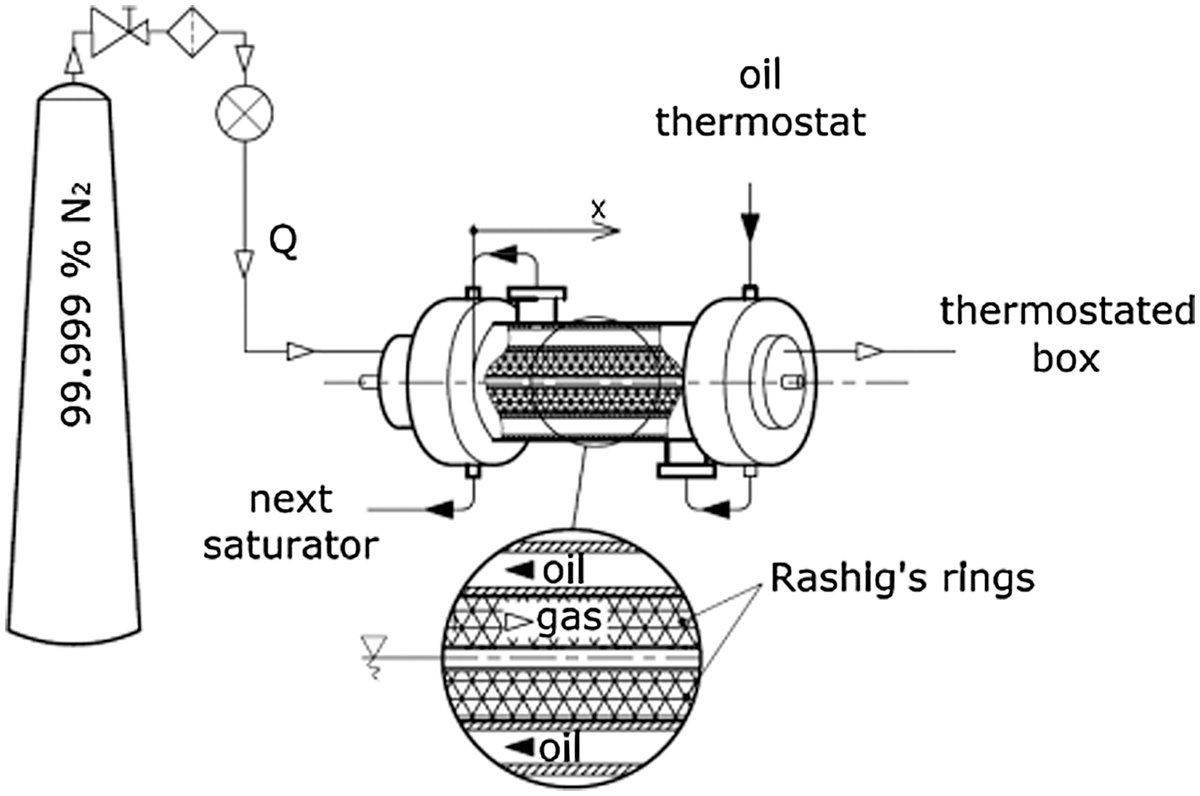
Fig. 3.
A detailed depiction of the inner layout in the saturators used in the mixture preparation device.
Table 1.
Verified temperature range and maximal flow rate allowing stable and repeatable saturated vapour generation in the saturator.
In the case of water, the verification of saturator functionality was based on humidity measurements in the saturated flow. The measured humidity was in good agreement with the humidity Rh calc calculated from dilution flow ratio of fully saturated Q w and dry Q D inert gas.
The Rh meas was obtained from parallel measurements of dew point and laboratory temperature T DP and T lab, which were then converted via known saturation vapour pressure equation of water (Wagner and Pruss, 2002) to the humidity Rh meas according to:
In the case of SA, the molar fraction of sulphuric acid was determined as molar concentration of sulphate from bubblers experiment. After passing through the saturator, see Fig. 3, the nitrogen saturated with SA vapour reaches cascade of two thermostated bubblers filled with 1 ppm solution of sodium hydroxide and reacts:
The molar fraction of sulphate anion in the liquid is determined via ion chromatography (IC), using the set-up made by Watrex, Ltd. with the anion column Transgenomic ICSep AN300 150 × 5.5 mm, and the conductivity detector SHODEX CD-5.2. Water saturator was filled with the reverse osmosis purified water, set-up ROWAPUR made by Watrex, Ltd. was used. The SA saturator was filled with 96.4 weight-% pure sulphuric acid prepared by Sigma-Aldrich Co.
The total error of bubblers experiment evaluated as average of 15 pairs of compared samples was ±20%. This error accounts: (1) Bubblers capture efficiency: Lisle and Sensenbaugh (1965) proved very good accuracy of NaOH capturing with uncertainty less than 5%, which is less than the evaluated accuracy of the IC detection method. Moreover, to evaluate bubblers capture effectivity, the sulphate concentration in the second bubbler and the background sulphate concentration in the pure water samples were also analysed. The levels of sulphate found were typically 1/100 of the concentration in the first bubbler or below detection limit of the IC – particular influence of bubbler capture efficiency on the uncertainty of the result is negligible; (2) Accuracy of saturator temperature measurement T sat: The temperature inside the saturator was evaluated as the 20 h average and so the most influencing were the day/night ambient temperature changes, which were 10 times higher than the accuracy of used thermometers (±0.1 K for PT100) or axial temperature profile difference with factor of 1 per thousand – since the following factors are more significant, the particular influence of temperature change ±1 K on the uncertainty of the result is negligible; (3) Accuracy of IC sample analysis (calibration as well as evaluation errors): Evaluation of particular contribution to the uncertainty of the results was estimated to 7%.
Connecting tubes
2.2.
The vapour-saturated carrier gas streams enter Teflon hoses maintained at temperatures several degrees higher than that of the saturators to prevent undesired condensation in the tubing. Then both streams are introduced into the laminar co-flow tube (LCFT), where stable clusters form by nucleation and grow by condensation.
Laminar co-flow tube
2.3.
The LCFT consists of two coaxial glass tubes with inner diameters of D = 60 mm (outer tube) and d = 20 mm (inner tube). In the case of sulphuric acid-water nucleation experiments, a stream of carrier gas with sulphuric acid vapour flows at a flow rate of U i in the inner tube and another stream of carrier gas with water vapour flows at a flow rate of U o in the annulus between the outer and inner tube. The inner tube ends approximately ¼ into the total length of the co-flow tube and then both streams flow at a flow rate of U c in the outer tube. The lengths of the inner tubes L i = 350 mm and L o = 1180 mm of the annular section, before the inner tube opening, are long enough to develop fully laminar flow (see Fig. 4). Connecting tube from LCFT to PSM with 4 mm diameter have two parts 200 and 250 mm long. The flow rates U i and U o of both carrier gas streams are kept at ratios and magnitudes that ensure the flow also remains laminar in the co-flow section. The range of flow rates for which flows of both streams remain laminar after their merging (Gore and Crowe, 1989) was verified experimentally by Trávníček et al. (2004, 2005) and Krejčí (2010). The LCFT is kept at a constant temperature during the measurements using a liquid circulating bath (LAUDA). The required temperature inside the LCFT is set several degrees above the temperature of the saturators (see Table 2) to avoid vapour condensation at the walls, and this temperature is measured by a thermocouple located in the axis of inner tube in such a way as not to significantly disturb the laminar flow. In the co-flow section, the water molecules diffuse into the inner stream with sulphuric acid vapour and vice versa. As a consequence of a higher diffusivity of water molecules in the carrier gas compared to the diffusivity of sulphuric acid molecules, the gaseous mixture becomes strongly supersaturated in the centre of the tube, leading to cluster nucleation and new particle formation by subsequent growth.
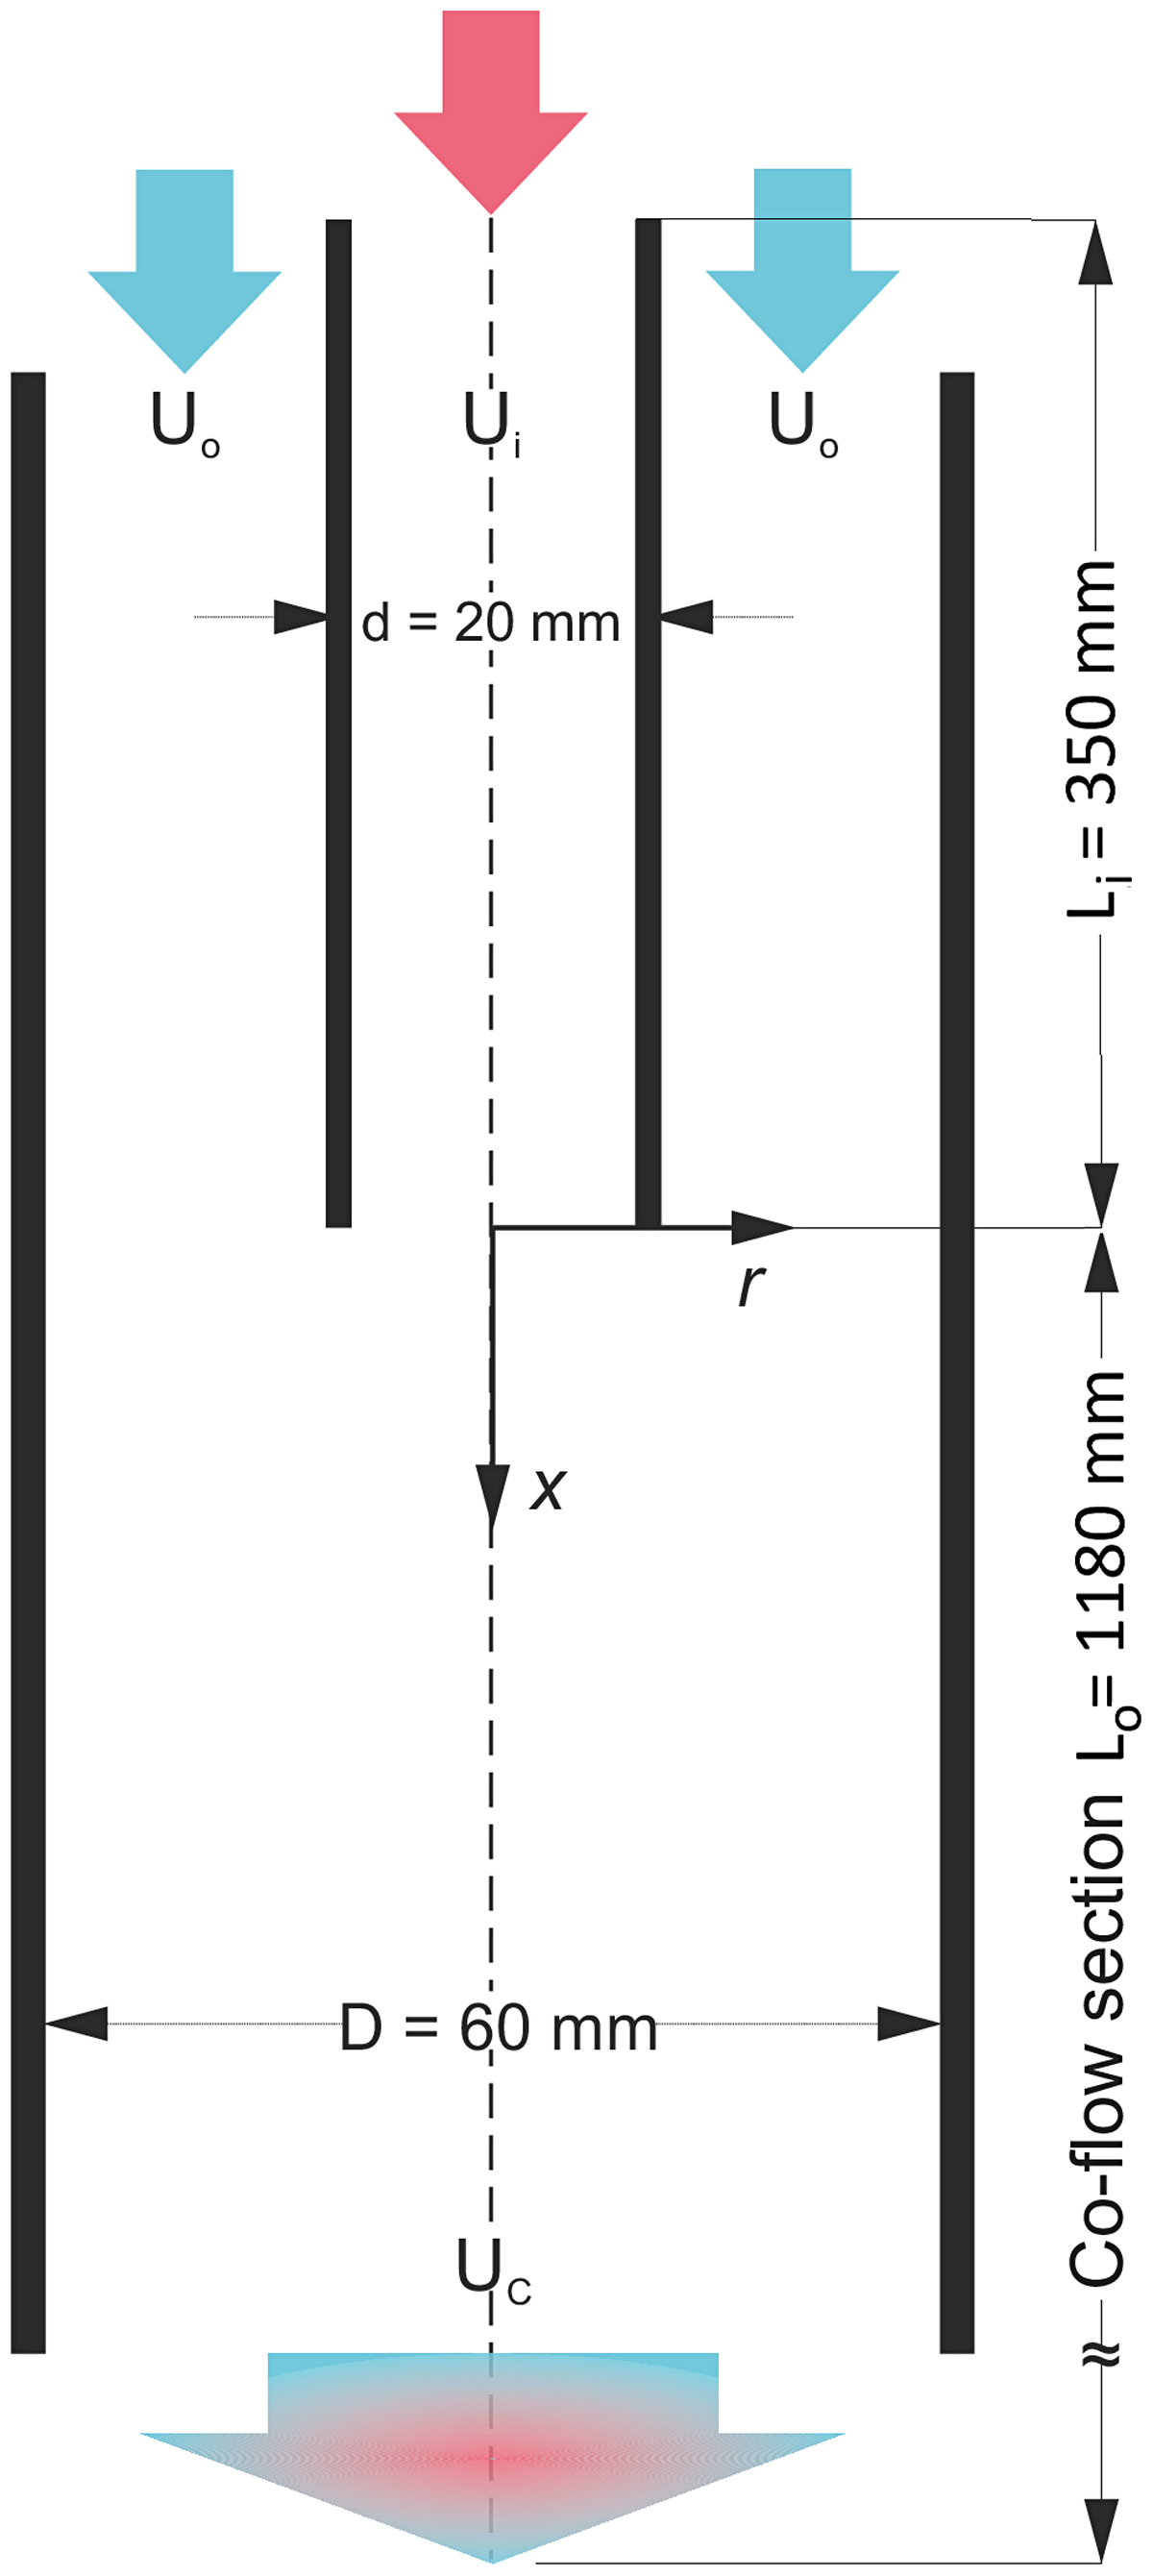
Fig. 4.
A detailed description of the design of the laminar co-flow tube.
Table 2.
Parameters used in the experimental set up and the corresponding results, p atm = 101.325 kPa.
Measurement of particle number concentration
2.4.
At the outlet of the co-flow tube the number concentrations of the produced particles were measured using a Particle Size Magnifier (PSM A11 nCNC, Airmodus) with D50 for particles with mobility diameters equal to approximately d mob ≈ 1.5 nm. The PSM is a recently developed device that enables the detection of particles as small as approximately 1.2 nm in mobility diameter (Vanhanen et al., 2011). The operational principle of a PSM is based on the turbulent mixing of a cool sample flow containing nanoparticles with a heated air flow saturated by the working fluid. This approach provides a high saturation ratio for the working fluid, activates the nano-sized particles, and magnifies them by condensation of the working fluid. In order to reach high saturation ratios, and thus detect magnified nanoparticles without an artefact of homogeneously nucleated droplets, diethylene glycol was chosen as the working fluid. The PSM enables the growth of the entering nanoparticles to a mean diameter of about 90 nm allowing detection by a condensation particle counter (b-CPC A20, Airmodus). The detection efficiency of the PSM (Airmodus A11) is 51% for d mob = 1.47 nm and 67% for d mob = 1.78 nm particles.
Materials used
2.5.
Nitrogen (purity 99.999%, Linde gas) was used as a carrier gas. The N2 flow from the high-pressure bottle was filtered using a Balston high pressure filter, model 9786, to ensure particle free gas flow when entering the MPD. The saturators were filled with high purity H2SO4 (95–98%, Sigma Aldrich, full composition of impurities can be found in the catalogue under Product Number 258105) and Rowapur/Ultrapur water (conductivity 0.05–0.1 μS cm−1 at 25 °C).
Discussion about wall loses of H2SO4
2.6.
The H2SO4 losses in the connecting tubing were neglected in our experiments for the following reasons. The flow of H2SO4 was kept constant for all settings of the experiment and during each experiment the gas streams were left flowing through the set-up for many hours (≈20 h) in order to achieve steady state operation. The concentration of the particles was recorded for the duration of the experiment by PSM to check if the average value had not changed due to the absorption/desorption of sulphuric acid on the walls of the connecting tubing and chamber. Owing to these long lasting experiments, we assume that the sorption equilibrium was reached in the tubing connecting the MPD to the LFCT. The LCFT was designed in such a way that the axial H2SO4 stream is sheathed by the water vapour stream. The difference between the diffusion coefficients of water in nitrogen and sulphuric acid in nitrogen is more than one order of magnitude. Moreover, during its flow along the chamber, several water molecules attach to each sulphuric acid molecule. As a result, the hydrated sulphuric acid clusters diffuse so slowly that they cannot reach the walls of the chamber during their available residence time, and thus wall losses are insignificant near the entrance within the co-flow section. However, at a greater distance from the beginning of co-flow section sulphuric acid can make it to the wall to a small extent and because the supersaturated vapour mixture is also present near the wall, the sulphuric acid will condense with water, wherein the vapour pressure of the sulphuric acid will be very low. A good approximation of this effect is the perfect sink assumption used for the mathematical model. However, these wall losses only affect the growth rate of already nucleated particles, not nucleation itself.
Loss of sulphuric acid on the walls on connecting tubes between LFDC and PSM due to diffusion can be calculated by penetration P, for example, according to Hinds (1998). The particle size obtained during our experiment was around 1.5 nm. For this size fraction, diffusion losses are about 60%. Taking into account the detection efficiency of PSM that is about 50% at 1.5 nm, the total losses can be about 80%.
Model for the description of LCFT
3.
In this section, we present the underlying fluid dynamics related to the design and function of the LCFT and a description of the mathematical model, which was derived to determine the nucleation rates under various experimental conditions. The model solves coupled mass and momentum transport in the three-component system (H2SO4(g), H2O(g), N2(g)). We assume a 2D axisymmetric system, steady state, and incompressible fluid. For the purpose of momentum transport, the ternary vapour–gas mixture is calculated as ideal. The nonidealities connected to the mass transport of the H2SO4 molecules in the mixture are accounted for in the value of the binary diffusion coefficient, which includes the presence of hydrates in the mixture. Also, thermal effects associated with mutual interactions between sulphuric acid and water molecules were neglected due to the overwhelming exceedance of the carrier gas that serves as thermostating agent. The model was solved using the commercial software Fluent 15.0. Particular components of the mixture enter the co-flow tube at temperature T chamb and atmospheric pressure p atm. At the inlet, the molar fraction x k corresponds to the saturation temperature T sat and is defined by:
where saturation vapour pressures were computed according to Katz and Ostermier (1967) and Kulmala and Laaksonen (1990) (see Appendix 1), and subscript k refers to sulphuric acid (SA) and water vapour (W), respectively.
On the basis of obtained simulation results we are able to compute:
where Ra and Rh are the relative acidity and relative humidity, respectively. To evaluate the theoretical value of the nucleation rate of sulphuric acid and water vapour, previously published data of nucleation rates [cm−3 s−1] were taken from Wyslouzil et al. (1991a). Data for the 25 °C isotherm were fitted with the following function:
Data interpretation
3.1.
The result of the measurements in the LCFT is the total number concentration of particles recorded by the PSM per unit time:
where J exp is the actual experimental nucleation rate at a particular location in the chamber, V is the volume of the nucleation zone, and is the volumetric flow rate.
Assuming that all the newly formed stable clusters are detectable by the particle counter and particles loss is negligible, we can use a relationship introduced by Wagner and Anisimov (1993) for evaluating the results from the laminar-flow diffusion chamber.
The theoretical values of the nucleation rate can be calculated according to Equation (6). Assuming that the position and shape of the maximum nucleation zone are predicted correctly, it is possible to distribute the measured number of droplets along the whole nucleation zone because the distribution curves of the theoretical and experimental nucleation rates are similar, even though they differ in absolute values.
The values of J theor and on the right side of Equation (8) can be obtained from (6) the Ra and Rh profiles defined by (4) and (5). The experimental nucleation rate can then be easily computed according to (7) and (8) as:
This experimental set-up does not allow for the measurement of the concentration of produced particles at a constant Rh, or Ra in LCFT. However, with model-obtained knowledge of the Rh and J theor profiles at each location in the LCFT it is possible to deduce the value of J theor for any value of Rh present inside the nucleation zone. Generally, using the similarity approximation Equation (9), J exp at a given Rh can be written as:
Simulation set up
3.2.
The size of the equipment used in the simulations is consistent with the dimensions of the real devices described in Section 2.3 Laminar co-flow tube. The volumetric flow rate of nitrogen in the acid stream was kept constant at a value of l min−1, at which the carrier gas was fully saturated by sulphuric acid (Krejčí, 2010). The volumetric flow rate of nitrogen in water vapour was changed from 0.69 to 0.78 l min−1. The saturation temperature was set to 22 °C and the temperature in the nucleation chamber was about 2–3 °C higher. Conditions under which the experiment was carried out are listed in the Table 2.
The measured number concentration of particles N in the last column was computed as an average value of the 104 s long steady state part of measurement.
The physical properties of the materials used in the mathematical models are listed in Tables 5–7 in the Appendix 1.
Results and discussion
4.
The direct result of the LCFT measurement is the time evolution of the number concentration of nuclei depending on the flow rate and temperature. An example of such a result is shown in Fig. 5a. From this figure it is obvious that there is a diversity of more than two orders of magnitude among concentration values for particular time intervals. In such cases it is essential to distinguish the number concentration of nuclei formed by nucleation of sulphuric acid with water from particles possibly formed by an undesired process, e. g., by homogeneously nucleating diethylenglycol in the PSM device. The detection limit of the PSM is determined by the Kelvin equation. With diethylenglycol the PSM is capable of detecting particles with diameters greater than 1.2 nm. If relatively large clusters of sulphuric acid and water are present in the supersaturated vapour of diethylenglycol, the vapour will condense on these nuclei. But if there is lack of these nuclei, diethylenglycol may nucleate homogeneously. However, homogeneous nuclei of diethylenglycol are very small, on the very edge of the measuring range of the device, and would be present in large quantities. During the processing of the measured data it is therefore necessary to decide which concentration values arise from the stochastic nature of the nucleation process itself and which are related to the undesired presence of homogeneous diethylenglycol nuclei. For this reason, a histogram (50 bins) of the frequency of nucleation events with the same concentration values was constructed (see Fig. 5b).
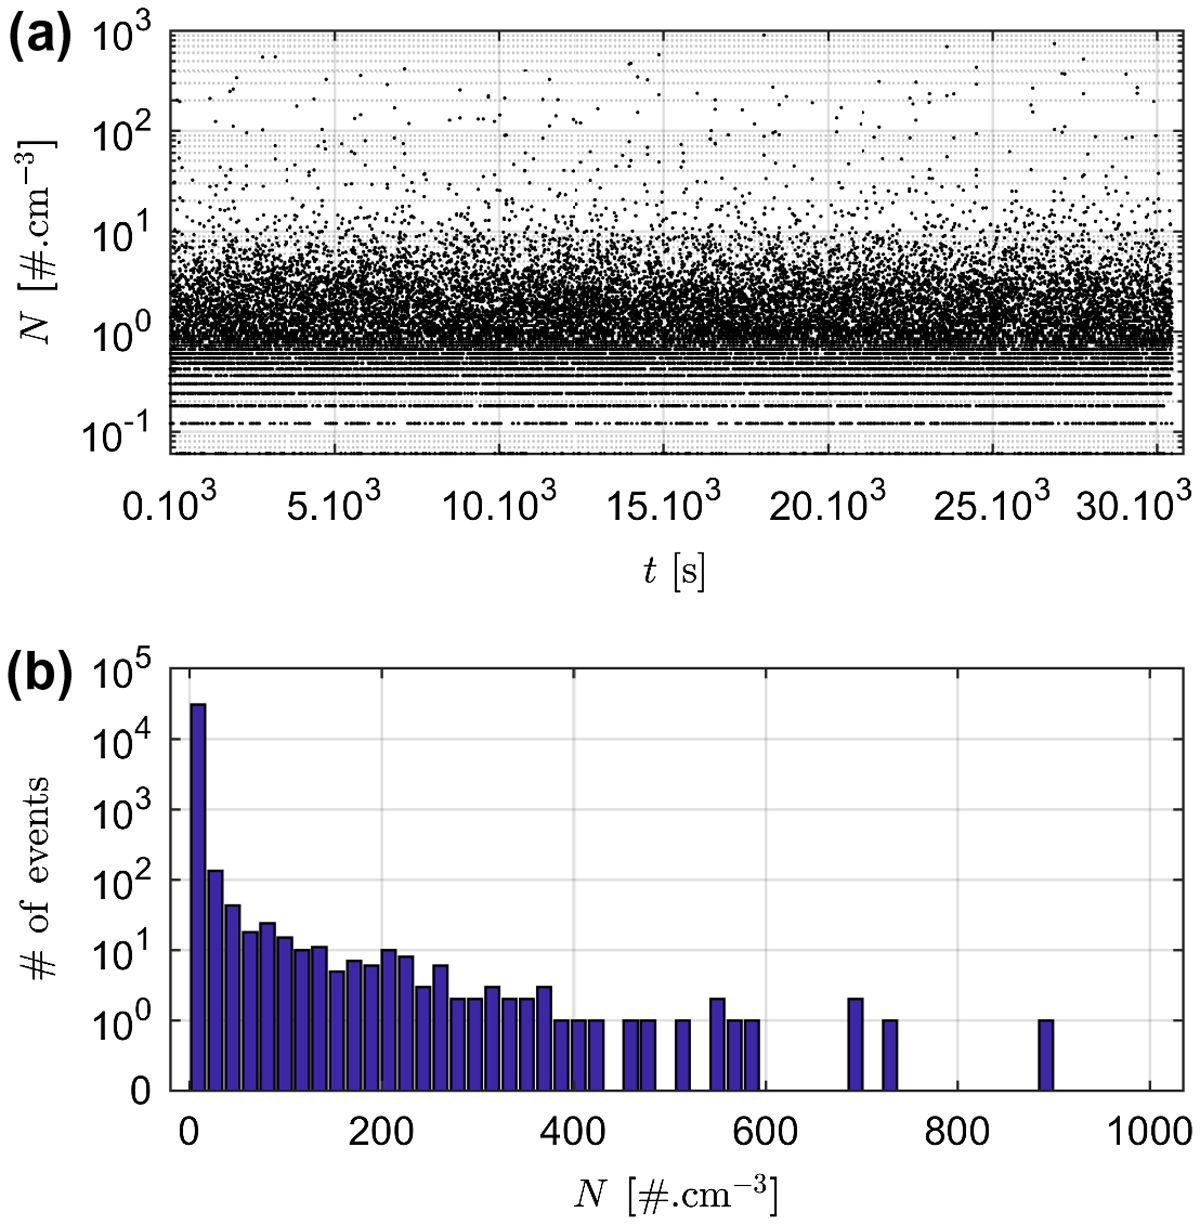
Fig. 5.
Postprocessing of measured concentrations, T sat = 22.47 [°C], = 0.76 [l min–1], = 0.25 [l min–1].
From Fig. 5b it is apparent that low concentrations of particles were detected with by far the highest frequency, while high concentrations were substantially less frequent. Events with a larger number of particles gradually diminished. If we assume that in the long term natural processes are continuous and monotonous, then the concentration dependence in Fig. 5b should be a more or less continuous function with a clear maximum value. If on this curve another local maximum would appear, it would indicate that another particle formation process could have taken place. The decreasing trend in the Fig. 5b describes the occurrence of concentrations resulting from nucleation of sulphuric acid with water. The rare occurrence of high numbers of particles is due to the stochastic nature of the nucleation process and the short duration of the experiment, but not due to the homogeneous nucleation in the PSM. This was verified by a dummy experiment where, under the same conditions, the PSM was connected to the flow of humid air through the HEPA filter. In this experiment, the random events with high number of particles did not occur.
For this reason, we decided that all measured events are correct and usable for the following computations. In Table 3 we show how sensitive the resulting average particle number concentration is to the choice of the concentration range from which the average value is computed. It can be seen that including the peak values of number concentrations has only a small effect on the result. Similarly, we tested the impact of the concentration scale resolution (number of bins) on the resulting average value and found it to be negligible as well. Because the experimental nucleation rate depends linearly on the average number of measured particles (see Equation (9)), the relative uncertainty of the nucleation rate resulting from the choice of N limit is equally negligible.
Table 3.
Deviations caused by different setting of limit concentration N limit, T sat = 22.47 [°C], = 0.76 [l min−1], = 0.25 [l min−1].
The values of the resulting nucleation rates computed from the measured concentrations and important properties in the maximum of the nucleation zone are recorded in Table 4.
Table 4.
Results obtained by CFD simulations, p atm = 101.325 kPa, coordinate of nucleation maximum on the axis of the co-flow section x = 0.53 cm.
It is interesting to compare these results with similar data measured by other authors using different devices (see Fig. 6). For this purpose, the Fig. 1 from the work of Brus et al. (2010) was used, which shows that the experimental nucleation rate depends on the concentration of sulphuric acid in the nucleation zone. The data on the left were measured under atmospheric conditions and show significant nucleation rates determined even at very low acid concentrations. This was mainly caused by the presence of free radicals produced during the chemical reactions of sulphuric acid, water, and possibly other components present in the atmosphere in the gaseous phase. Such a high number of nuclei under laboratory conditions was not achieved in the binary nucleation of pure components, as is shown by the curves in the right part of the figure. In comparison with other experiments carried out under laboratory conditions, our results are on the right side. For a higher sulphuric acid concentration in the chamber we obtained nucleation rates two orders of magnitude lower then Wyslouzil et al. (1991a, 1991b) in flow chamber with turbulent mixing. This may have been due to several factors. It was found (Kerminen et al., 2010; Zhang, 2010) that the nuclei of sulphuric acid and water are very small and do not easily form stable clusters. These clusters are, however, very well stabilized in the presence of various impurities normally occurring in the atmosphere, especially amines (Neitola et al., 2015; Duplissy et al., 2016; Rondo et al., 2016). Trace amounts of ammonia in ultrapure water cannot be excluded, even though its concentration determined by ion chromatography was below the detection limit. Similarly, there are also traces of ammonia present in nitrogen carrier gas. According to Berndt et al. (2010) the presence of ammonia ([NH3] = 1.2 × 10¹² molecule cm−3) and amines may increase the nucleation rate at RH = 13% by one to two orders of magnitude. In the case of higher RH = 47% this effect is lower and the nucleation rate is increased by a factor of 2–5. In the case of our experiments, we assume that our nucleation rates can be overestimated by presence of ammonia and amines maximally by one order of magnitude. We believe that low nucleation rates obtained by our experiment were achieved through the use of relatively pure chemicals and precise sealing of the chamber. Another reason may have been the accurate determination of the location and size of the nucleation zone used in the calculations of the nucleation rate, which, in the case of chambers with turbulent mixing, is not possible. The last reason why our results differ from other author’s data may be that, due to the special design of the LCFT, our data are less distorted by uncertain estimates of losses of sulphuric acid on the walls of the chamber.
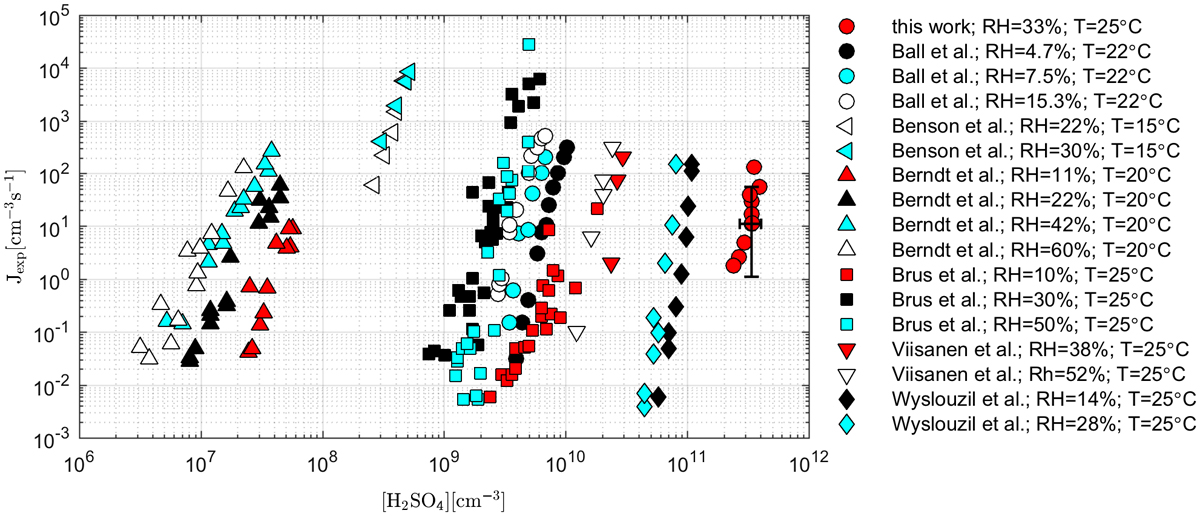
Fig. 6.
Comparison of our results with data obtained by other authors using different types of experimental devices. The dependence of the experimental nucleation rate on the concentration of sulphuric acid in the chamber during the constant value of Rh. Uncertainties of experimental data obtained by LCFT are marked.
Conclusions
5.
In this work, we present a new type of experimental device – a Laminar Co-Flow Tube designed to study the nucleation of binary and ternary mixtures. The equipment is designed in such a way that through a co-current flow arrangement of both nucleating components almost no losses of sulphuric acid on the walls of the device occur, at least between the beginning of the co-flow section and the nucleation zone. Due to the laminar character of the flow it is possible to accurately model the position and size of the nucleation zone, which are then used for computing the nucleation rate. Using this device, the first data were measured in the form of number concentrations of newly formed nuclei versus time. By processing these data, a dependence of the experimental nucleation rate on the concentration of sulphuric acid in the nucleation zone was obtained for a selected relative humidity of 33%. These results were compared with literature data obtained using different experimental methods. The nucleation rates determined in this study are approximately two orders of magnitude lower than those obtained in chambers with turbulent mixing for corresponding thermodynamic conditions. In nucleation experiments, unexpectedly high nucleation rates are frequently caused by contamination; for water-sulphuric acid system, contamination by amines and other substances could stabilize the nuclei and enhance the nucleation rate. In the present experiment, very pure substances (nitrogen, water, sulphuric acid) were used and a great care was taken to seal the apparatus to avoid contamination. On the contrary to turbulent mixing methods, the nucleation zone in LCFT does not touch any wall and the losses of sulphuric acid by adsorption/condensation on walls are largely suppressed. This fact, together with the laminar character of the flow, makes it possible to develop an accurate mathematical model of the process. We have shown that the LCFT is an appropriate device for the study of the nucleation of binary mixtures and that there is also a potential for further research of ternary nucleation. In future, we would like to publish an article providing a detailed derivation of the mathematical model of the nucleation process in the LCFT and to compare an analytical solution of a simplified mathematical model with the numerical solution of the full model.
Disclosure statement
No potential conflict of interest was reported by the authors.
Funding
This work was supported by the Czech Science Foundation [grant number P105/12/0664]; Czech Science Foundation [grant number 17-19798S]; EU project 7. RP EU Marie-Curie ITN HEXACOMM [grant number 315760]; ACTRIS-CZ-RI [grant number CZ.02.1.01/0.0/0.0/16_013/0001315]; EU project Horizon 2020 ACTRIS2 [grant number 654109].
Acknowledgements
The authors thank to Kayleigh Kavanagh, BSc for her language corrections of the text.
Appendices
Physical properties
Appendix 1.
The saturation vapour pressure of water is according to Katz and Ostermier (1967) computed as:
where
and coefficients a, b … g are written in the Table 5.
Table 5.
Values of coefficients used in Equation (A2).
The saturation vapour pressure of sulphuric acid in the saturator was calculated using the equation based on Ayers et al. (1980) and improved by Kulmala and Laaksonen (1990):
where p SA is the saturation vapour pressure [atm] of H2SO4 at a temperature of T [K], p SA,0 is the saturation vapour pressure (Ayers et al., 1980) of H2SO4 at the temperature T 0 = 360 K, ∆H v is the enthalpy of vapourization, T is the temperature of the saturator, and T c is the critical temperature (T c = 905 K).
The other physical properties of the materials used in mathematical models are listed in Tables 6–8.