Have a personal or library account? Click to login
Negligible local-factor influences on tree ring cellulose δ18O of Qilian juniper in the Animaqing Mountains of the eastern Tibetan Plateau Cover

Negligible local-factor influences on tree ring cellulose δ18O of Qilian juniper in the Animaqing Mountains of the eastern Tibetan Plateau

Open Access
|Jan 2017

Figures & Tables

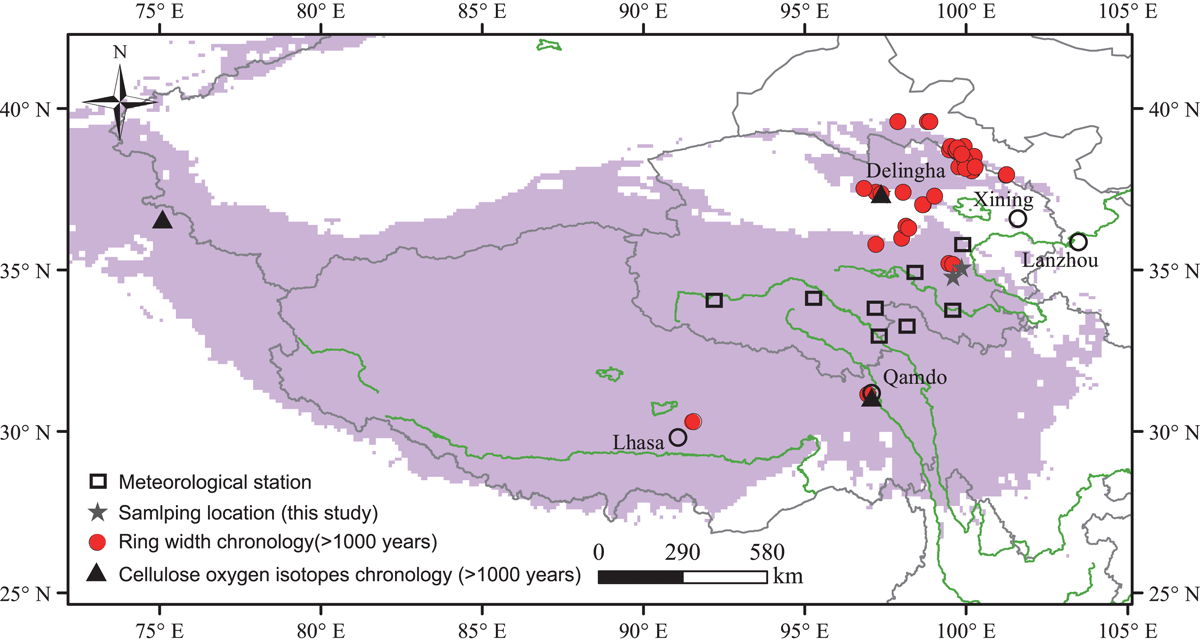
Fig. 1.

Map of the study area. Red spots and black triangles indicate ring width and cellulose oxygen isotope data (>1000 yr), respectively. Stars and rectangles indicate sampling locations and meteorological stations, respectively.
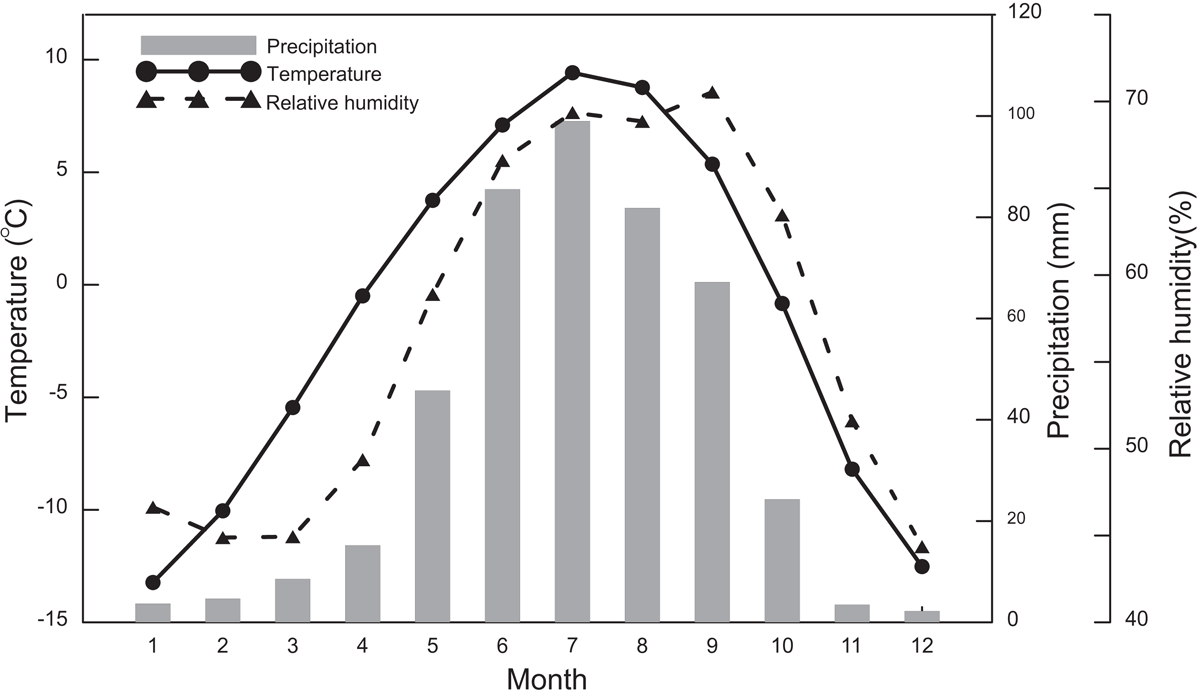
Fig. 2.

Regional monthly mean temperature (black circles), precipitation (grey bars) and relative humidity (triangles) from 1960 to 2014.
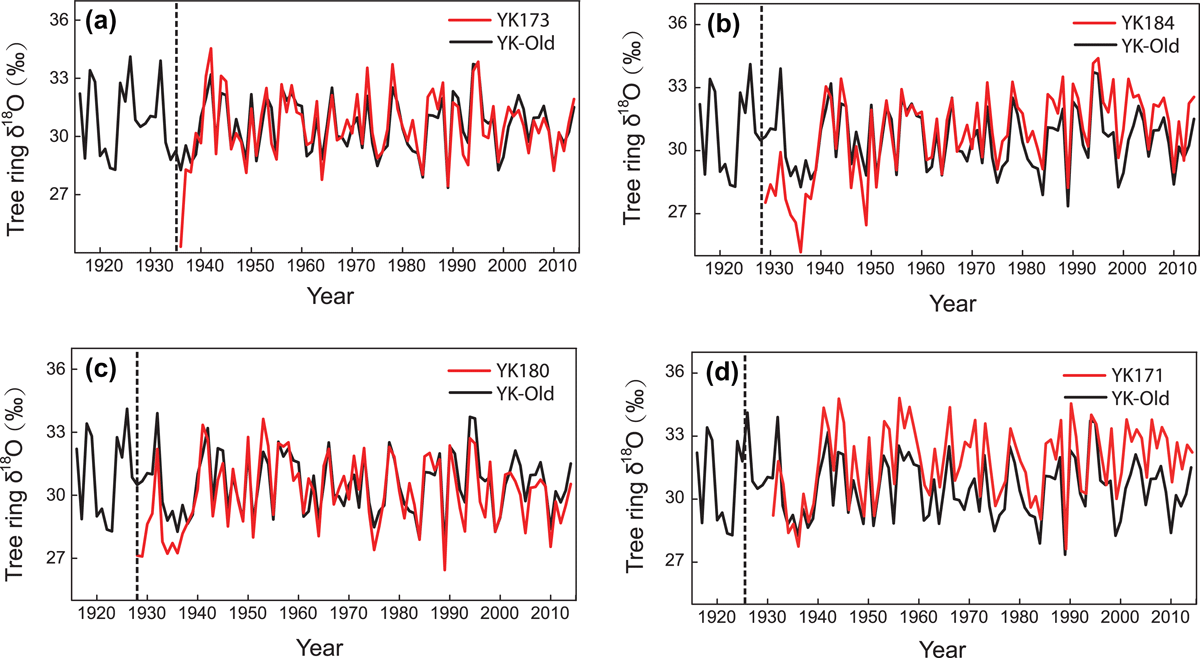
Fig. 3.

Tree ring δ 18O values from young trees (red lines) and old trees (black lines). The dashed line indicates the pith year.
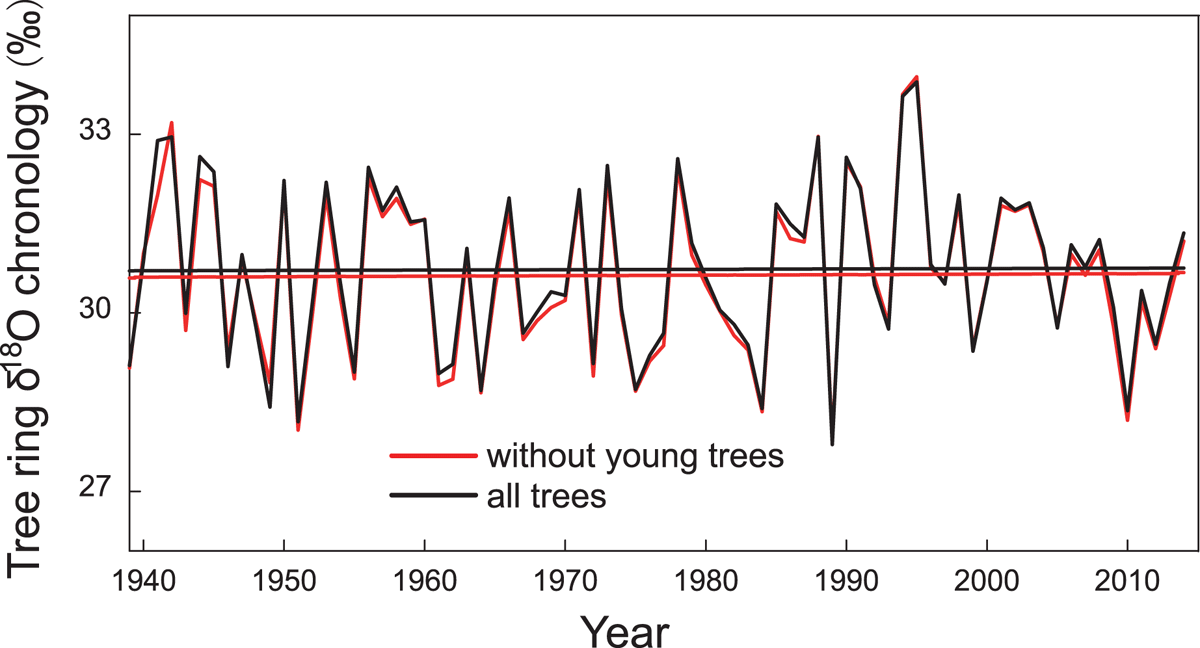
Fig. 4.

Tree ring δ 18O chronology based on all trees (black) and non-young trees (red).
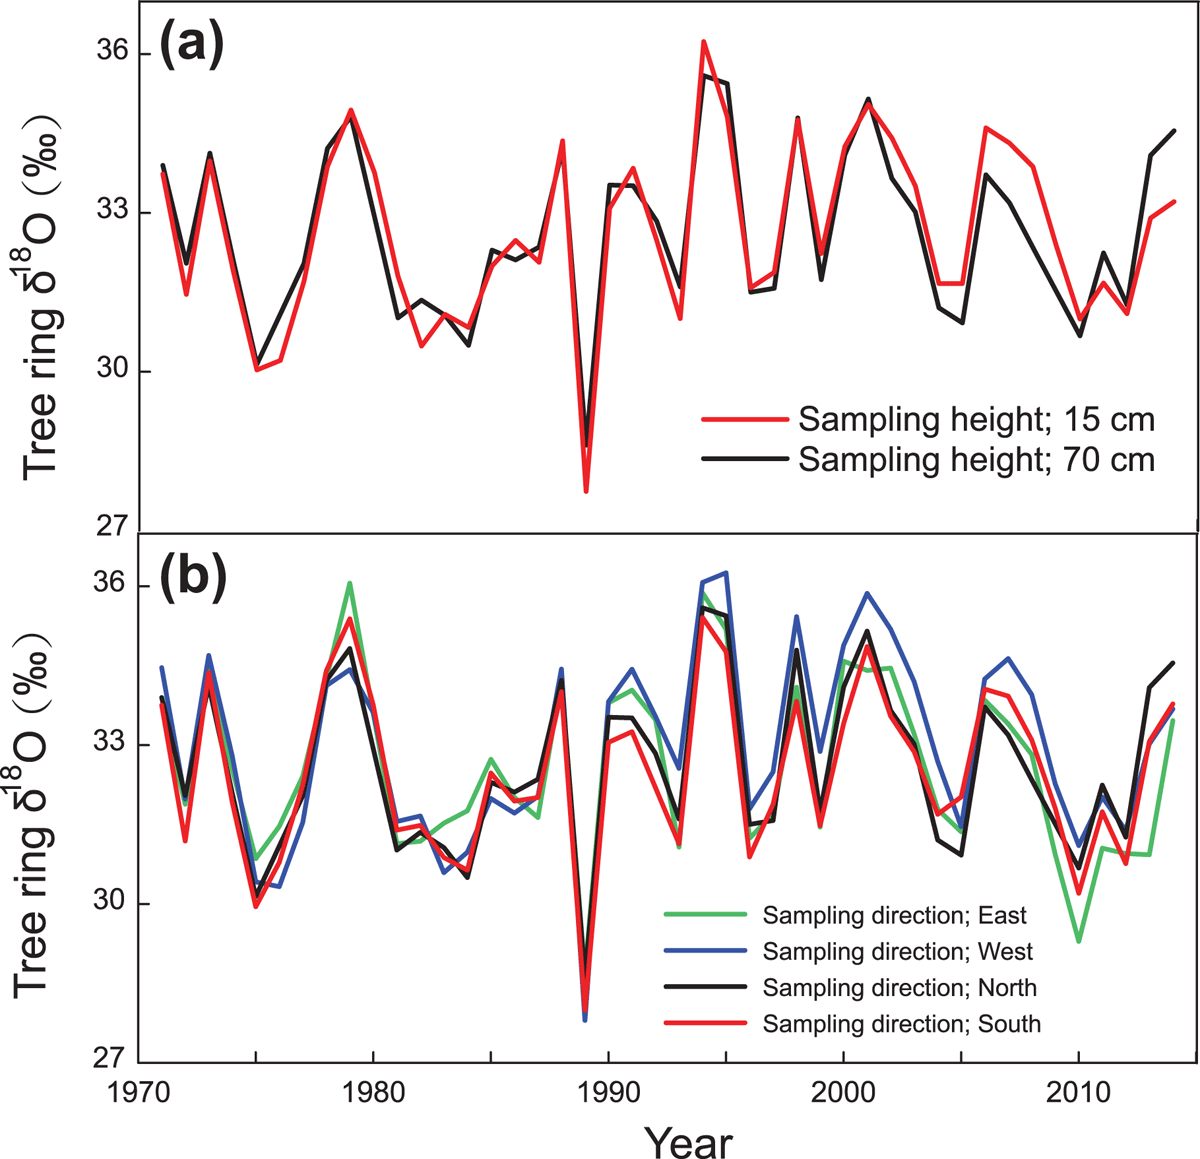
Fig. 5.

Tree ring δ 18O values from different sampling heights (a) and directions (b).

Table 1.

Statistical analysis of data for each tree in this study.

Sampling altitude4250 mSample IDYK177YK178YK179YK180MeanAverage (‰)29.4330.4230.2330.3430.10STD 1.361.401.501.561.341st autocorrelation0.170.140.010.070.04Sampling altitude4150 mSample IDYK181YK182YK183YK184MeanAverage (‰)31.0930.7431.3931.3531.13STD1.611.671.741.471.551st autocorrelation0.120.030.040.010.00Sampling altitude4000 mSample IDYK123YK168YK171YK173MeanAverage (‰)31.2729.3531.7832.0431.42STD 1.651.361.511.401.401st autocorrelation0.15N/A0.010.040.01Sampling altitude3900 mSample IDYK115YK114YK105YK109MeanAverage (‰)30.0730.1828.8230.8529.98STD 1.471.931.251.951.501st autocorrelation0.000.390.080.530.13Sampling altitude3800 mSample IDYK162YK134YK133YK137MeanAverage (‰)30.2330.6931.8730.7230.78STD 1.551.361.771.101.331st autocorrelation0.19N/AN/AN/A0.12Sampling locationNDSample height15 cm70 cm70 cm70 cm70 cmSample direction NorthNorthSouth WestEastAverage (‰)32.6432.6332.4932.9832.60STD 1.691.591.611.781.661st autocorrelation0.18N/AN/A0.250.16
Table 2.

Correlation coefficients among tree ring δ 18O time series from different directions.
rNorthSouthWestSouth0.952West0.9280.928East0.8910.9260.887
Fig. 6.

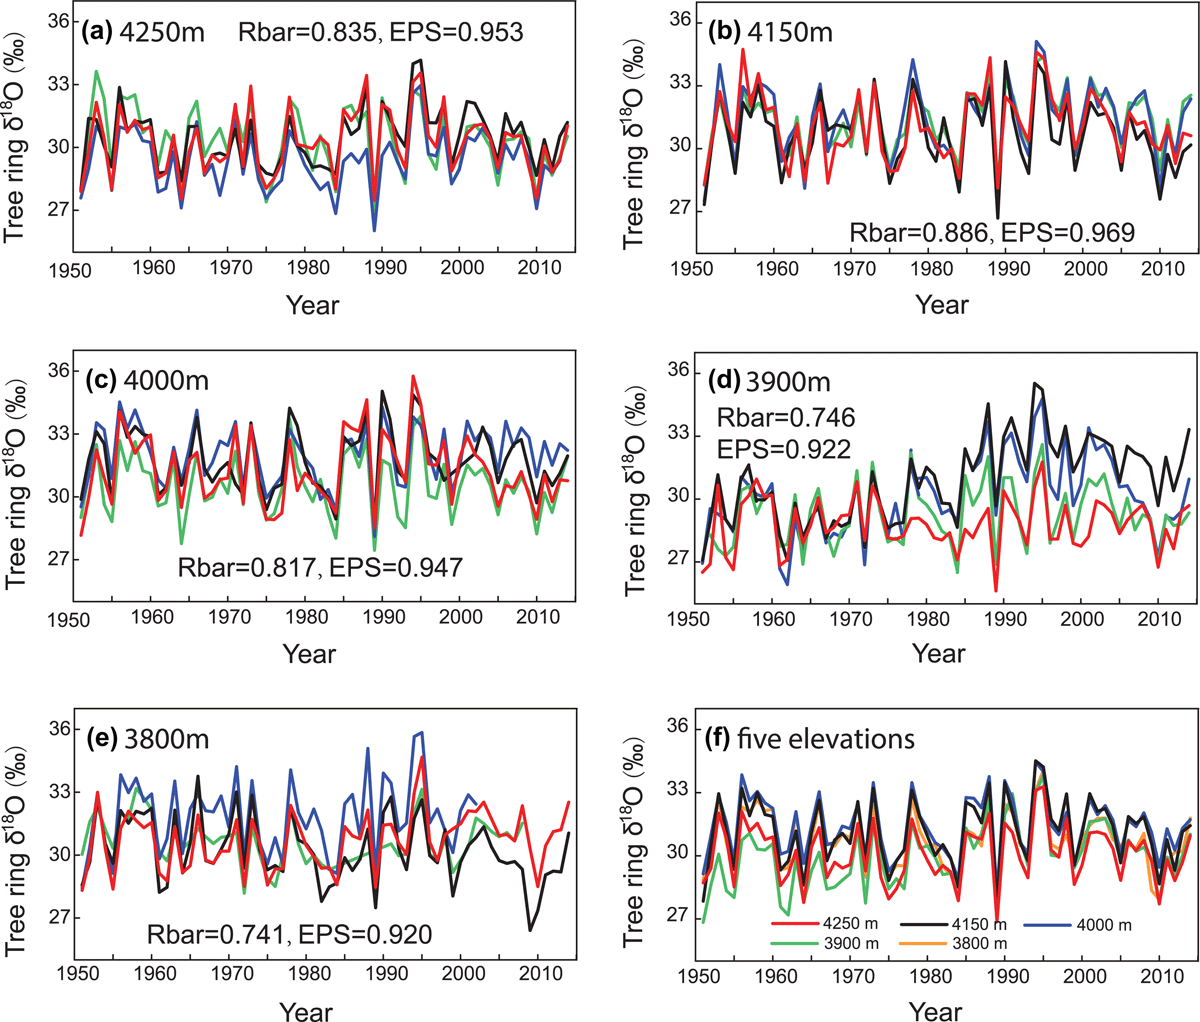
Tree ring δ 18O time series from different altitudes. Coloured lines in Figure 6a–e indicate oxygen isotope time series from different trees in each altitude, and coloured lines in Figure 6f indicate tree ring oxygen isotope time series from different altitudes.
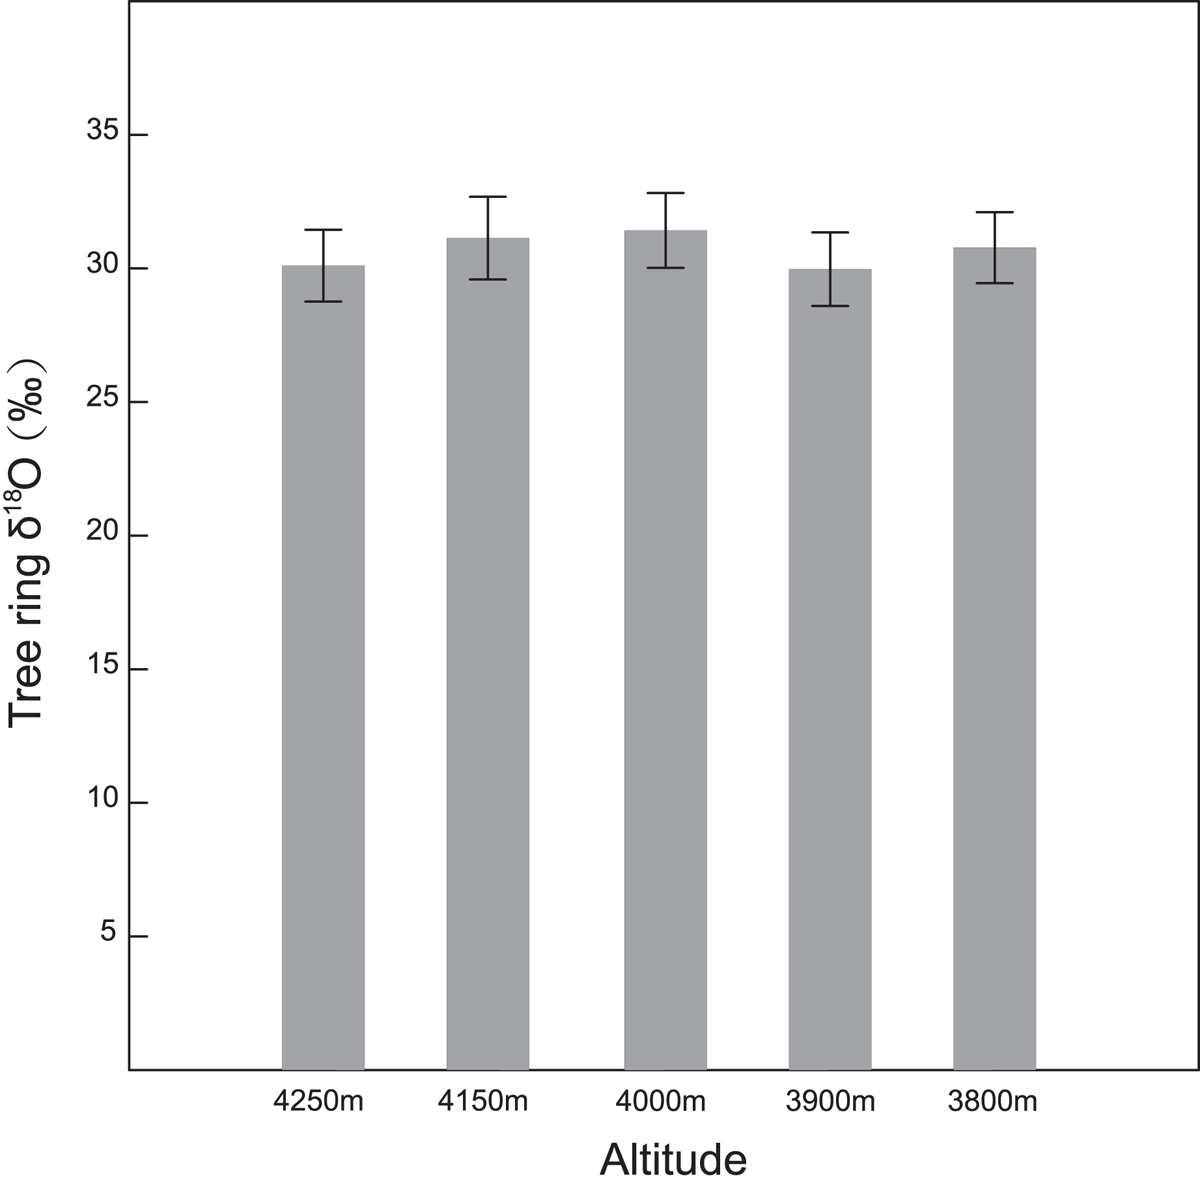
Fig. 7.

Average and standard deviation of tree ring δ 18O data from different altitudes.

Table 3.

Correlation coefficient among tree ring δ 18O time series from different altitudes.
r4250 m4150 m4000 m3900 m4150 m0.9704000 m0.9590.9713900 m0.8940.9000.9013800 m0.8860.8840.9090.895
Fig. 8.

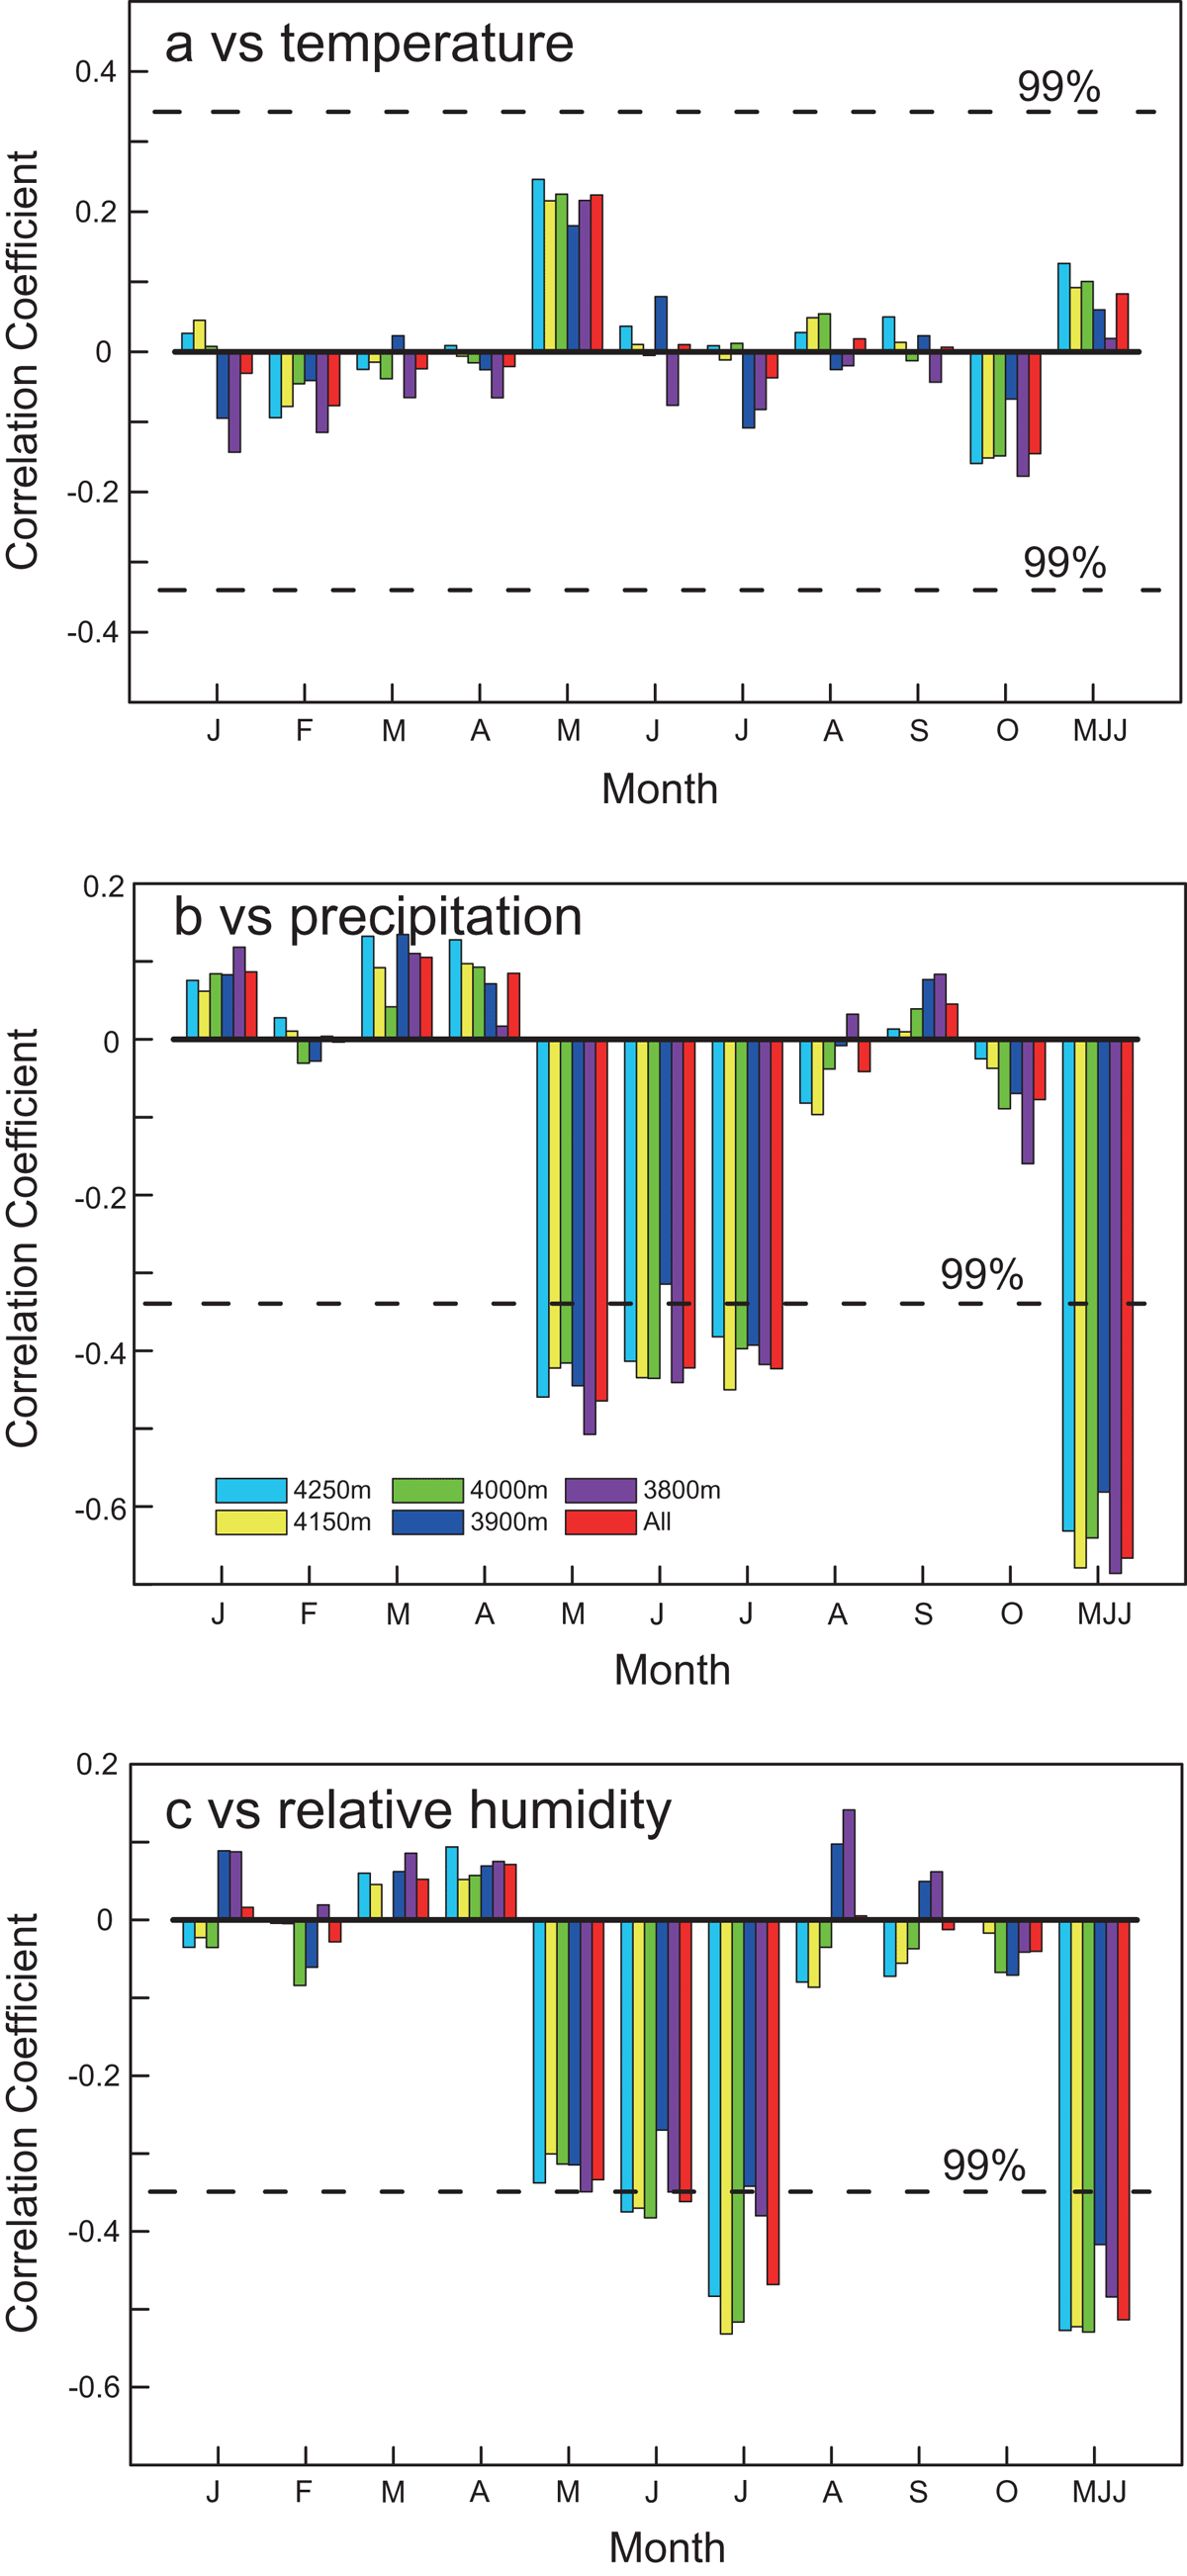
Correlations between tree ring δ 18O from different altitudes and regional temperature (a), precipitation (b) and relative humidity (c) obtained from eight instrumental stations during 1960–2014.
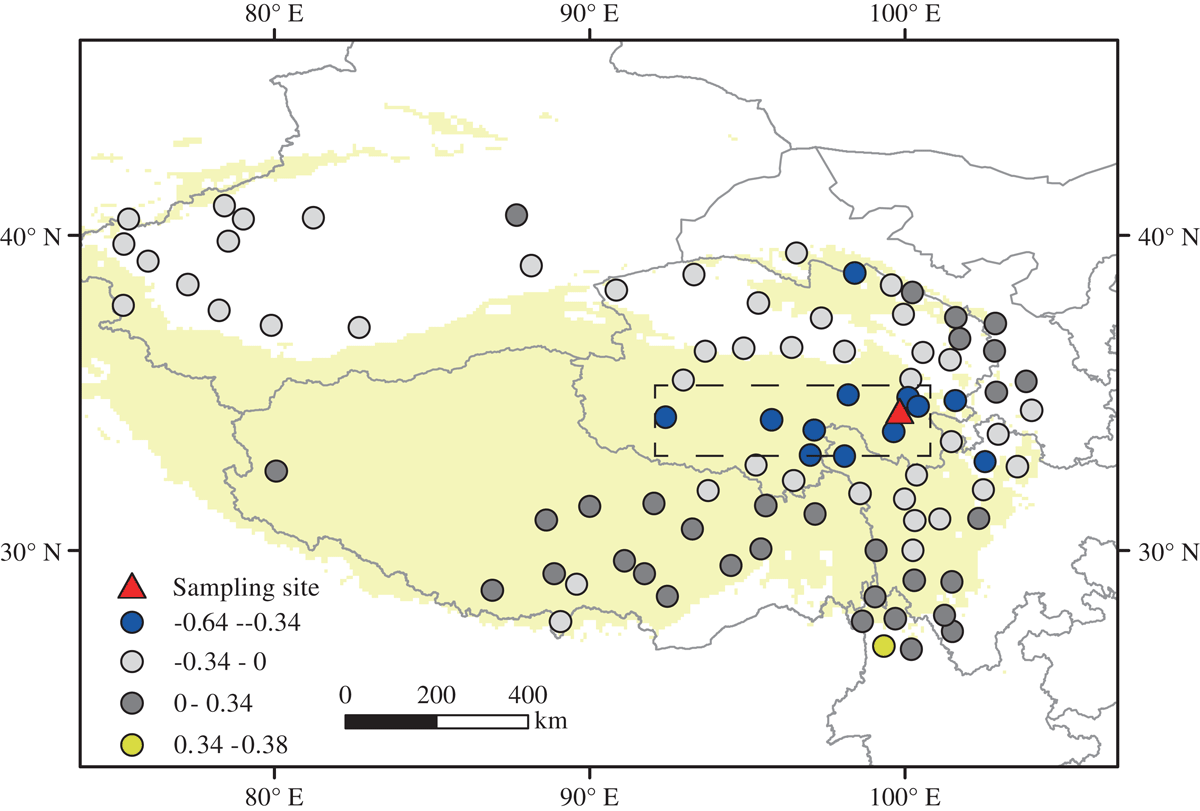
Fig. 9.

Spatial correlations between tree ring δ 18O and May–July precipitation from meteorological stations on the Tibetan Plateau from 1960 to 2014.

Language: English
Page range: 1391663 - 1391663
Submitted on: May 25, 2017
Accepted on: Oct 5, 2017
Published on: Jan 1, 2017
Published by: Stockholm University Press
In partnership with: Paradigm Publishing Services

© 2017 Chenxi Xu, Xuemei Shao, Wenling An, Takeshi Nakatsuka, Yong Zhang, Masaki Sano, Zhengtang Guo, published by Stockholm University Press
This work is licensed under the Creative Commons Attribution 4.0 License.