
Introduction
1.
Climate change has profound societal and economic effects (Stocker et al., 2013). High-resolution paleoclimate records that can be calibrated and verified with instrumental climate data have been used to reconstruct past climate change with defined uncertainties. These have great potential to provide long-term records of past climate (McCarroll, 2015). In addition, such records are helpful in evaluating and improving climate models (McCarroll, 2015).
Given their high-resolution nature and ability to be accurately dated, tree rings have been widely used to reconstruct past climate change by calibrating and verifying the tree ring records with measured meteorological records (Cook et al., 2010; Shao et al., 2010). Presently, most of the longest tree ring-based reconstructions from China are based on the tree ring width of juniper (Gou et al., 2010; Shao et al., 2010; Yang et al., 2014; Zhang et al., 2015; Chen et al., 2016). Yang et al. (2014) reconstructed annual precipitation variations over the past 3500 years based on a combined tree ring width study of sub-fossil, archaeological and living juniper samples from the north-eastern Tibetan Plateau. Chen et al. (2016) reconstructed April–June maximum temperature variations based on a 2665-year-long tree ring width study of Qilian juniper from the upper treeline of the Animaqing Mountains on the eastern Tibetan Plateau. Compared with this single tree ring width index, other tree-related proxies have the potential to contain more paleoclimate information. For example, tree ring δ 18O and δ 13C data have previously been used as proxies for hydroclimatic parameters in Asia at both local and regional scales (Treydte et al., 2006; Grießinger et al., 2011; Sano et al., 2012a; An et al., 2014; Liu et al., 2014; Wernicke et al., 2015). Therefore, it is desirable to use multi-proxy approaches to dendroclimatology, which may yield a wide variety of paleo-environmental information from the same site (Gagen et al., 2006).
Stable oxygen isotopes (δ 18O) in tree rings are controlled mainly by source water δ 18O and relative humidity (Roden et al., 2000). Tree ring δ 18O values have the potential to record climate signals and provide different climatic information as compared with tree ring width (Xu et al., 2011a, 2013a, 2015; Sano et al., 2012b). Furthermore, tree ring δ 18O values have the potential to preserve low-frequency climate signals (Gagen et al., 2011). During the past decade, many tree ring cellulose oxygen isotope studies on the Tibetan Plateau have explored past climatic change (Treydte et al., 2006; Grießinger et al., 2011, 2017; Shi et al., 2011; Xu et al., 2011b; Sano et al., 2012a; Liu et al., 2013, 2014; An et al., 2014; Qin et al., 2014; Wernicke et al., 2015). Some of these data were used to reconstruct hydroclimate (Treydte et al., 2006; Grießinger et al., 2011, 2017; Sano et al., 2012a; An et al., 2014; Wernicke et al., 2015). Most of these stable oxygen isotope studies were based on spruce or fir species, which have relatively wide tree rings from which it is easy to extract cellulose.
However, junipers grow very slowly, which makes it difficult to establish a δ 18O time series with annual resolution (Wang et al., 2013), which is the reason that number of long-term ring width chronology (Fig. 1, red spots) is large, while the number of long-term oxygen isotope chronology is limited (Fig. 1, black triangles). Therefore, a better way to establish annually resolved time series from juniper is to combine multiple records from different trees/cores that have relatively wide rings in some periods. However, the cores with relatively wide tree rings are typically from different altitudes and sampling directions, and also have different ages. Climatic response of tree ring width for juniper at different altitudes might be variable. It has been reported that tree growth near the upper treeline is controlled by temperature, whereas at low altitudes it is governed by moisture (Takahashi and Yasue, 2003; Savva et al., 2006). In addition, age-related effects on tree ring δ 18O values have been found for juniper in Pakistan and pine in Spain (Treydte et al., 2006; Esper et al., 2010), although such effects have not been observed for pine in south-east China and larch in Bhutan (Sano et al., 2013; Xu et al., 2016).
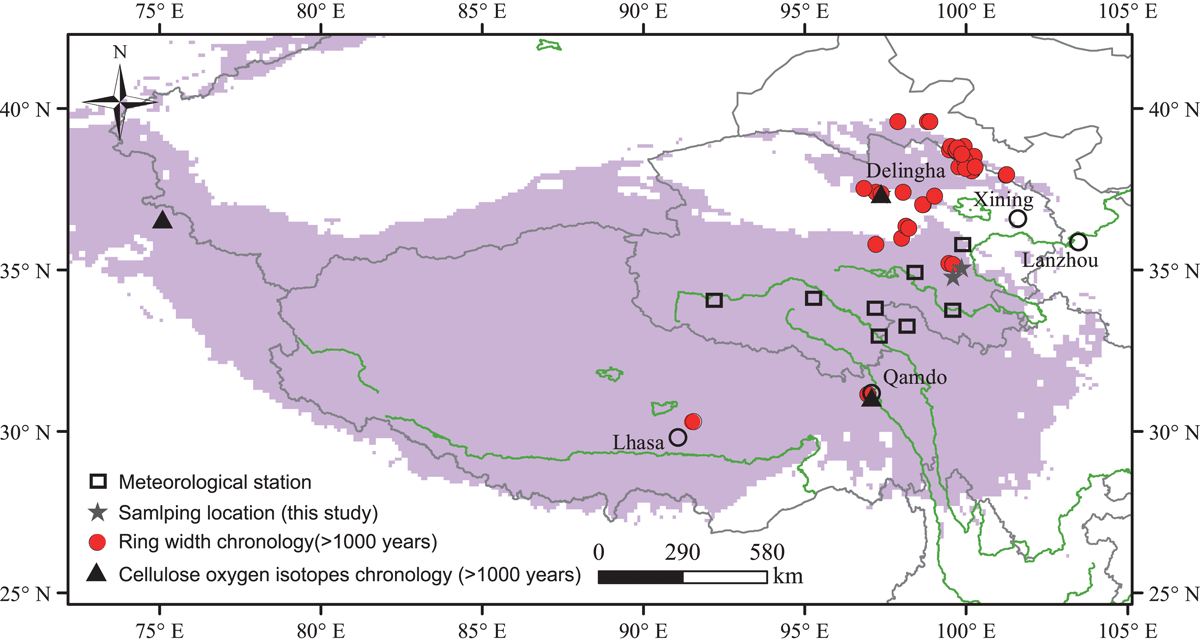
Fig. 1.
Map of the study area. Red spots and black triangles indicate ring width and cellulose oxygen isotope data (>1000 yr), respectively. Stars and rectangles indicate sampling locations and meteorological stations, respectively.
In this study, oxygen isotopes of tree ring samples from different altitudes, and variable sampling heights, directions and ages were analysed to investigate: (1) intra- and inter-tree oxygen isotope variations; (2) potential juvenile effects on tree ring oxygen isotopes; (3) tree ring oxygen isotope changes along an altitudinal gradient; and (4) the climatic implications of Qilian juniper oxygen isotope data from the Animaqing Mountains on the eastern Tibetan Plateau.
Materials and methods
2.
Sampling site
2.1.
Tree ring samples were taken from Qilian juniper (Juniperus przewalskii Kom.) growing in natural forests in the Animaqing Mountains in Qinghai Province (Fig. 1). The two sampling locations (YK and ND) are open canopy sites (YK = 34.76°N, 99.69°E and 3800 m asl; ND = 35.00°N, 100.07°E and 3400 m asl). Core samples of each tree were collected using a 5-mm-diameter increment borer. The cores were air dried and polished to make the tree ring borders clearly visible. The ring widths of the samples were then measured at a resolution of 0.01 mm using a binocular microscope with a linear stage interfaced with a computer (Velmex™; ACU-RITE). Cross-dating was performed in the laboratory by matching variations in ring width from all cores to determine the absolute annual age of each ring. Quality control was completed using the program COFECHA (Holmes, 1983).
Samples for oxygen isotope measurements
2.2.
Four cores from one tree with different sampling directions (north, south, east and west) and two cores from one tree with different sampling heights (15 and 70 cm) at the ND site were used to check the circumferential and vertical variability of δ 18O in a single tree. Twenty trees from different altitudes (4250, 4150, 4000, 3900 and 3800 m) were selected to test the effect of altitude on cellulose δ 18O. Two relatively old trees (>200 yr) and four relatively young trees (<90 yr) with pith were used to evaluate potential juvenile effects on tree ring cellulose δ 18O. All of these experiments were designed to develop a sampling protocol for reconstructing a long-term tree ring δ 18O record in Qilian juniper.
The modified plate method (Xu et al., 2011a, 2013b), following the traditional cellulose extraction procedure of the Jayme–Wise method (Green, 1963), was used to extract α-cellulose. Cellulose samples weighing 80–260 μg were then wrapped in silver foil. Tree ring cellulose δ 18O values were measured using an isotope ratio mass spectrometer (Delta V Advantage; Thermo Scientific) interfaced with a pyrolysis-type, high-temperature conversion elemental analyzer (TC/EA; Thermo Scientific) at the Research Institute for Humanity and Nature, Japan. Cellulose δ 18O values were calculated by comparison with analysis of Merck cellulose (laboratory working standard), which was analysed after every eight tree ring samples. Oxygen isotope results are presented in δ notation as the per mil (‰) deviation from Vienna Standard Mean Ocean Water (VSMOW): δ 18O = [(Rsample/Rstandard) − 1] × 1000, where R sample and R standard are the 18O/16O ratios of the sample and standard, respectively. The analytical uncertainties on repeated measurements of the Merck cellulose were approximately ±0.2‰ (n = 231).
Climatic and statistical analyses
2.3.
The sampling site is located in the transition zone of the Tibetan Plateau between the regions in the south dominated by the monsoon and those in the north dominated by westerly winds (Yao et al., 2013). Climatic parameters (monthly total precipitation, monthly mean temperature and monthly relative humidity) from eight meteorological stations (Xinghai, Maduo, Dari, Qingshuihe, Yushu, Qumalai, Shiqu and Tuotuohe, Table S1) during the period of 1960–2014 obtained from the China Meteorological Data Sharing Service System (http://data.cma.cn/) in the transition region (Tian et al., 2008; Yao et al., 2013) were averaged to represent the regional climate. The mean annual temperature of this region ranges from −2.5 to 0.2 °C, and the mean annual total precipitation ranges from 365 to 575 mm, with most precipitation falling from May to September (Fig. 2). To investigate the relationship between tree ring δ 18O and climatic factors, Pearson correlation coefficients were calculated between tree ring δ 18O and these three climatic variables from January to October. Mean inter-trees correlation (Rbar) and Expressed Population Signal (EPS) were calculated to evaluate consistency and signal strength of δ 18O time series from different trees (Wigley et al., 1984).
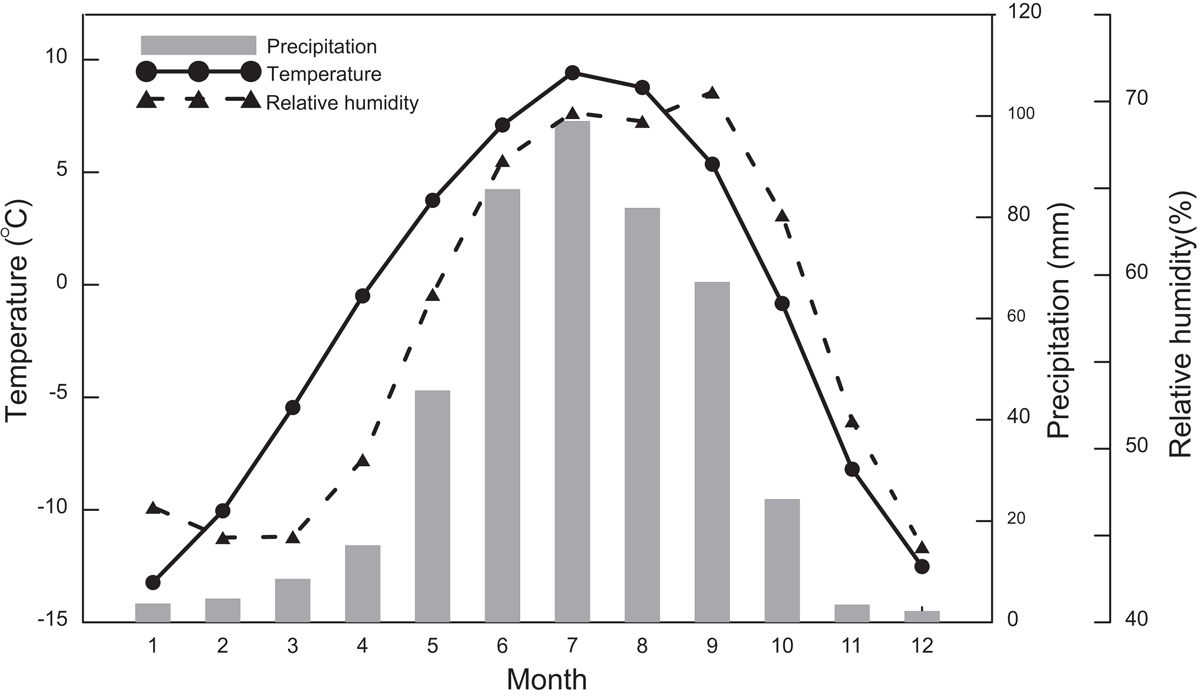
Fig. 2.
Regional monthly mean temperature (black circles), precipitation (grey bars) and relative humidity (triangles) from 1960 to 2014.
Results and discussion
3.
Juvenile effects on cellulose δ 18O
3.1.
Tree ring δ 18O time series from four young trees with pith are compared with δ 18O values from old trees in Fig. 3. The tree ring δ 18O values of YK173 (Fig. 3a) are ~3.95‰ and 1.24‰ lower than the δ 18O values from the old trees when the young trees are two and three years old, respectively. The mean and standard deviation of δ 18O values of YK173 and the old trees are very similar after the first four years of growth. δ 18O values of YK184 (Fig. 3b) are ~2.68‰ lower than the δ 18O values from old trees during the first nine years of growth and the δ 18O values of YK180 (Fig. 3c) are ~2.03‰ lower than the δ 18O values from the old trees during the first 10 years of growth. δ 18O values of YK171 exhibit similar variations to the old trees (Fig. 3d). Figure 3 reveals that the δ 18O values of young trees are sometimes lower than those of old trees, but this phenomenon is limited to the first 10 years of growth. Despite this, δ 18O variations from old and young trees are highly correlated when cambial ages are <10 years. δ 18O values of young Qilian juniper with cambial ages of >10 years are very similar to those of old Qilian juniper. To test the feasibility of building up chronology using young trees (>10 years part), we build up two tree ring δ 18O chronologies that include young trees (>10 years part) and exclude young trees. The mean values and long-term trends of these two tree ring δ 18O chronologies have not significant difference (Fig. 4), and these two tree ring δ 18O chronologies are highly correlated, which indicates young trees (>10 years part) could be used for paleoclimate reconstruction as old trees.
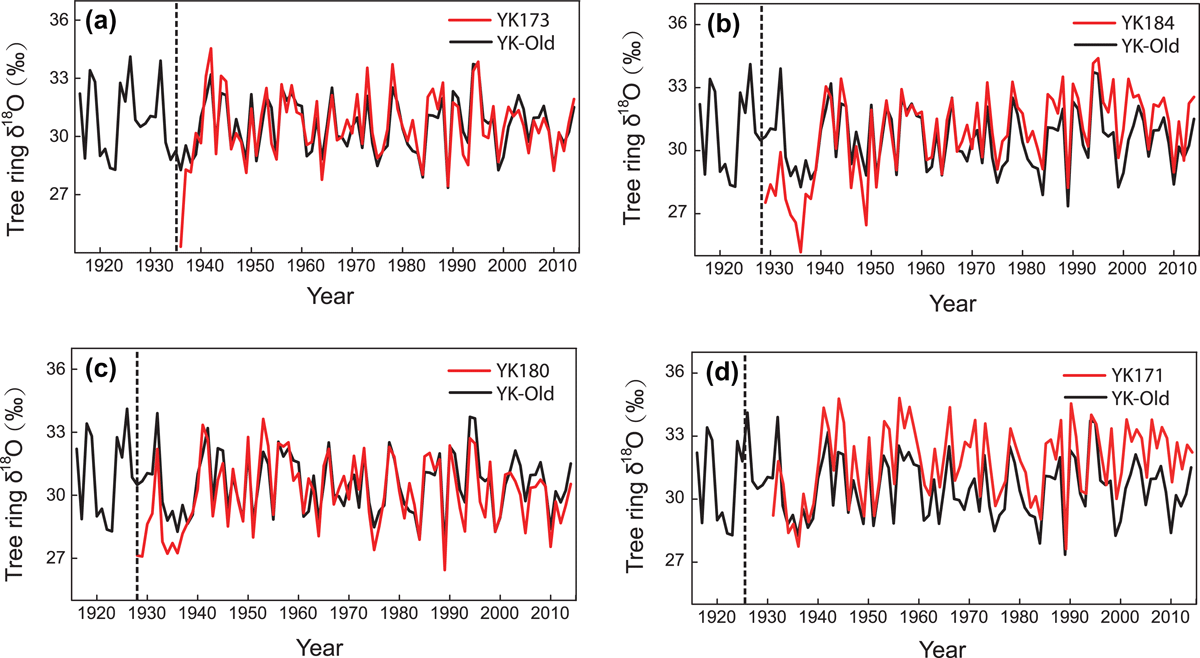
Fig. 3.
Tree ring δ 18O values from young trees (red lines) and old trees (black lines). The dashed line indicates the pith year.
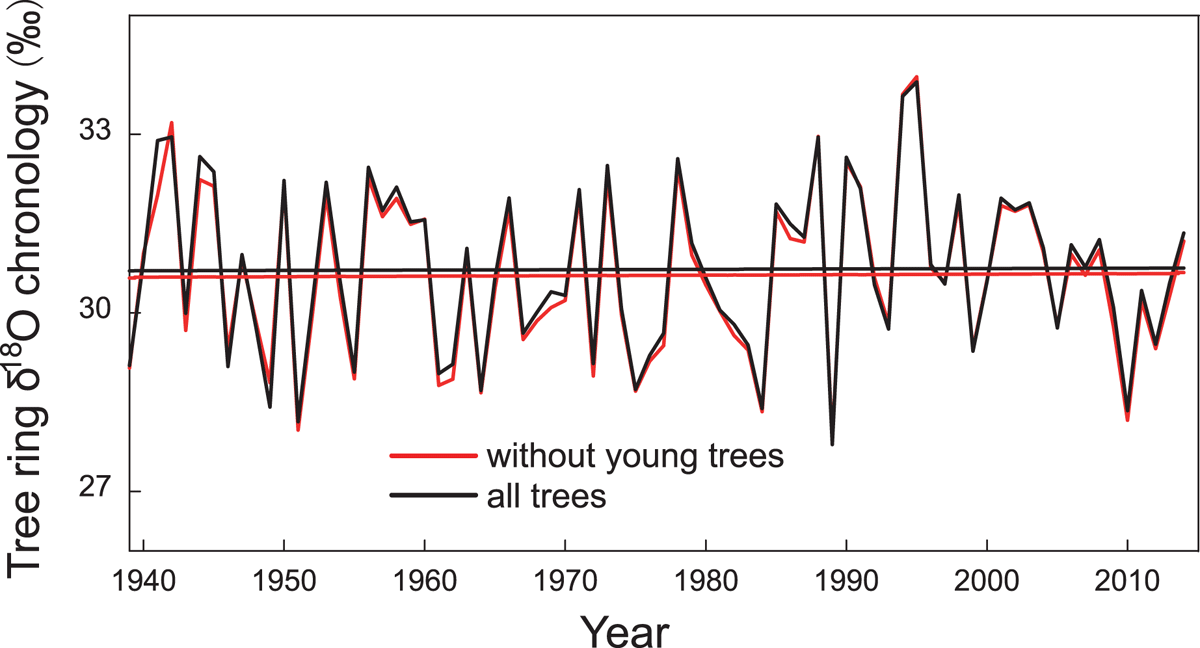
Fig. 4.
Tree ring δ 18O chronology based on all trees (black) and non-young trees (red).
Cellulose δ 18O values of young oak trees in France increase in their first 30 years of growth (Labuhn et al., 2014), which is similar to our results but over a longer time span. In contrast, δ 18O values of young juniper from central Asia have higher values than old juniper, and the age-related decreasing trends persist for several hundred years (Treydte et al., 2006). δ 18O values of young larch trees from the Kamchatka Peninsula, Russia (Nakatsuka et al., 2008), and pine from Spain (Esper et al., 2010) also show long-term decreasing δ 18O trends. However, age-related effects for pine from northern Fennoscandia are not observed after a juvenile phase of about 50 years (Young et al., 2011). There is also no apparent juvenile effect on δ 18O values of larch in Bhutan (Sano et al., 2013), and no significant differences between mean values, standard deviations and climate responses of δ 18O between young and old pine trees in south-east China (Xu et al., 2016). Juvenile effects on δ 18O depend on species and location.
In this study, the lower δ 18O values of young trees may be related to xylogenesis. Young trees with an earlier onset of xylogenesis may uptake some meltwater characterized by depleted δ 18O (Azetsu-Scott and Tan, 1997), which results in lower xylem water δ 18O and cellulose δ 18O. As the trees grow older, the delayed onset of cambium division may minimize the influences from meltwater (Li et al., 2013). However, the detailed cause of the juvenile effect on tree ring δ 18O values remains unclear, and further work is needed to identify the mechanisms involved. Nevertheless, if the first 10 years of tree growth are not included, then paleoclimate reconstruction using young trees is robust.
Intra-tree δ 18O variability
3.2.
Tree ring δ 18O values at different sampling heights (15 and 70 cm) are shown in Fig. 5a. The mean and standard deviation of δ 18O values at 15 cm (70 cm) are 32.64‰ (32.63‰) and 1.69‰ (1.59‰), respectively. Tree ring δ 18O values at different heights show a high degree of synchronicity (r = 0.93; n = 43), and an analysis of variance (ANOVA) shows no significant differences in mean or standard deviation between tree ring δ 18O values at different heights. Although previous studies have revealed vertical δ 13C isotopic variations (Leavitt, 2010), our results show no vertical δ 18O changes in Qilian juniper. In addition, recent study on two species (Abies georgei and Hippophae tibetana) in south-east Tibet Plateau revealed that the mean and standard deviation of tree ring oxygen isotope at different sampling heights do not have significant differences Xu et al. (2017).
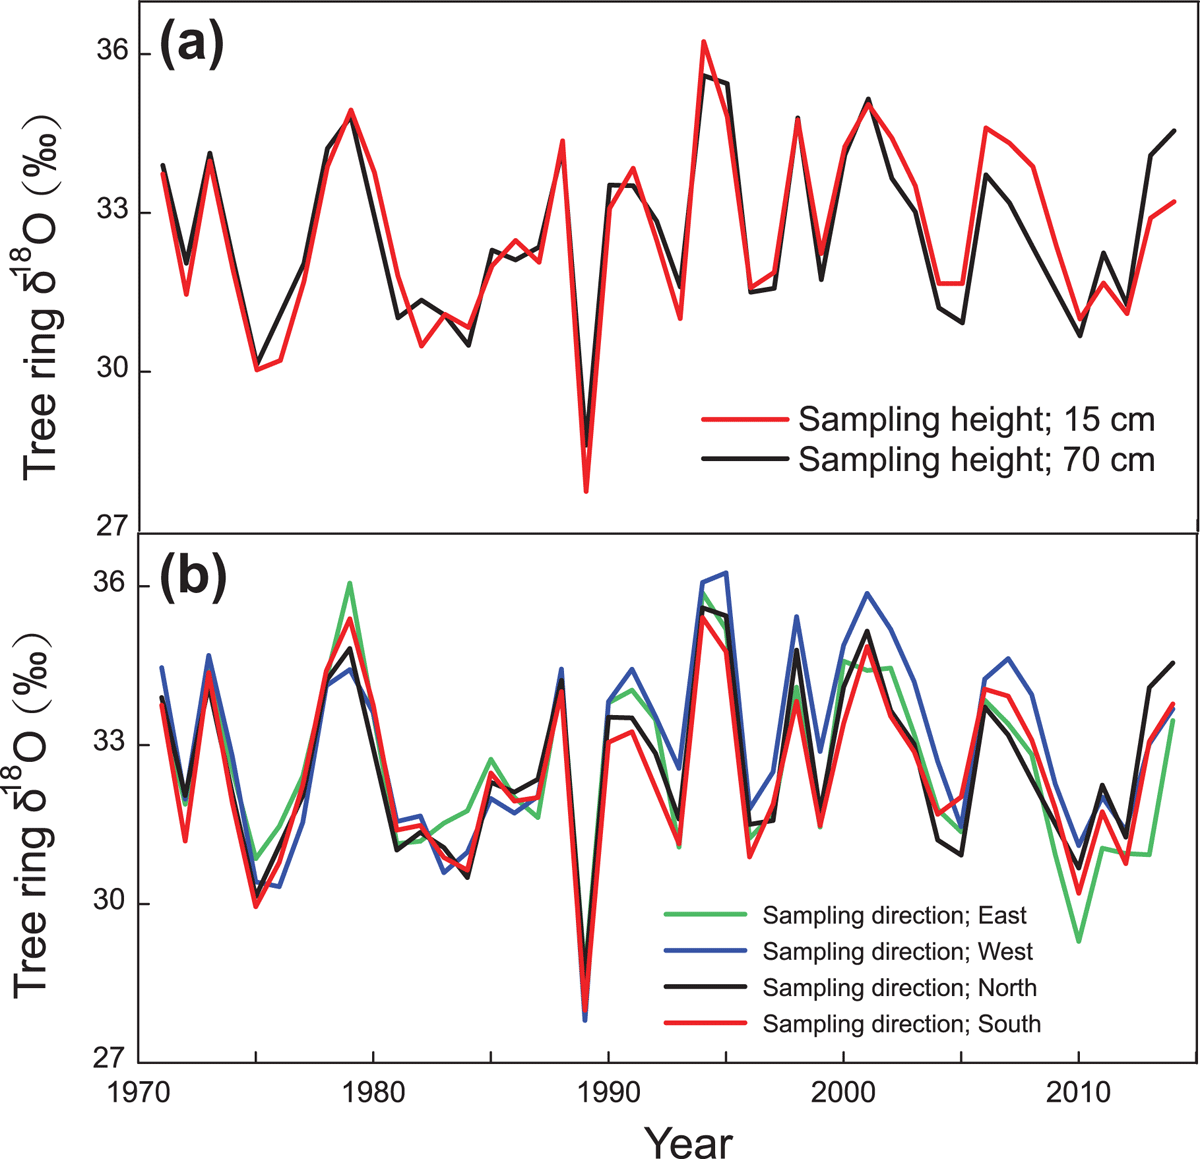
Fig. 5.
Tree ring δ 18O values from different sampling heights (a) and directions (b).
Tree ring δ 18O variations in different directions (north, south, west and east) are shown in Fig. 5b. The mean δ 18O values from the four directions are 32.63, 32.49, 32.98 and 32.60‰, respectively (Table 1), and ANOVA results show no significant differences in mean or standard deviation between tree ring δ 18O values in different directions. The yearly standard deviations obtained from the four directions vary between 0.12 and 1.33‰ (mean = 0.48‰), and these values are equivalent to the ranges reported for Abies pindrow radii (0.5–2‰) and Quercus petraea (0.5–1.5‰) (Ramesh et al., 1985; Robertson et al., 1995). The δ 18O time series from the four directions are also positively correlated (Table 2), and the mean inter-series correlation for the four directions is 0.92. These results show that the mean and standard deviation of vertical and circumferential δ 18O time series are very similar, and tree ring δ 18O values from different heights and directions are highly correlated, which indicates that we can reconstruct long-term δ 18O records by combining samples from different heights and directions.
Table 1.
Statistical analysis of data for each tree in this study.
Inter-tree δ 18O variability
3.3.
All tree ring δ 18O time series in YK site are illustrated in Fig. 6a–e and Table 1. The lowest value for samples from the YK site is 28.82‰ (YK105) at 3900 m, and the highest value is 32.04‰ (YK173) from 3800 m (Fig. 6). The largest difference amongst all the δ 18O time series from the YK site is 3.22‰, which falls within the range of 1–4‰ for inter-tree δ 18O variability (Leavitt, 2010). Given that the microclimatic conditions associated with these trees are similar, genetic variability and the crown/root architecture of individuals may contribute to some of the observed inter-tree variability (Leavitt, 2010).
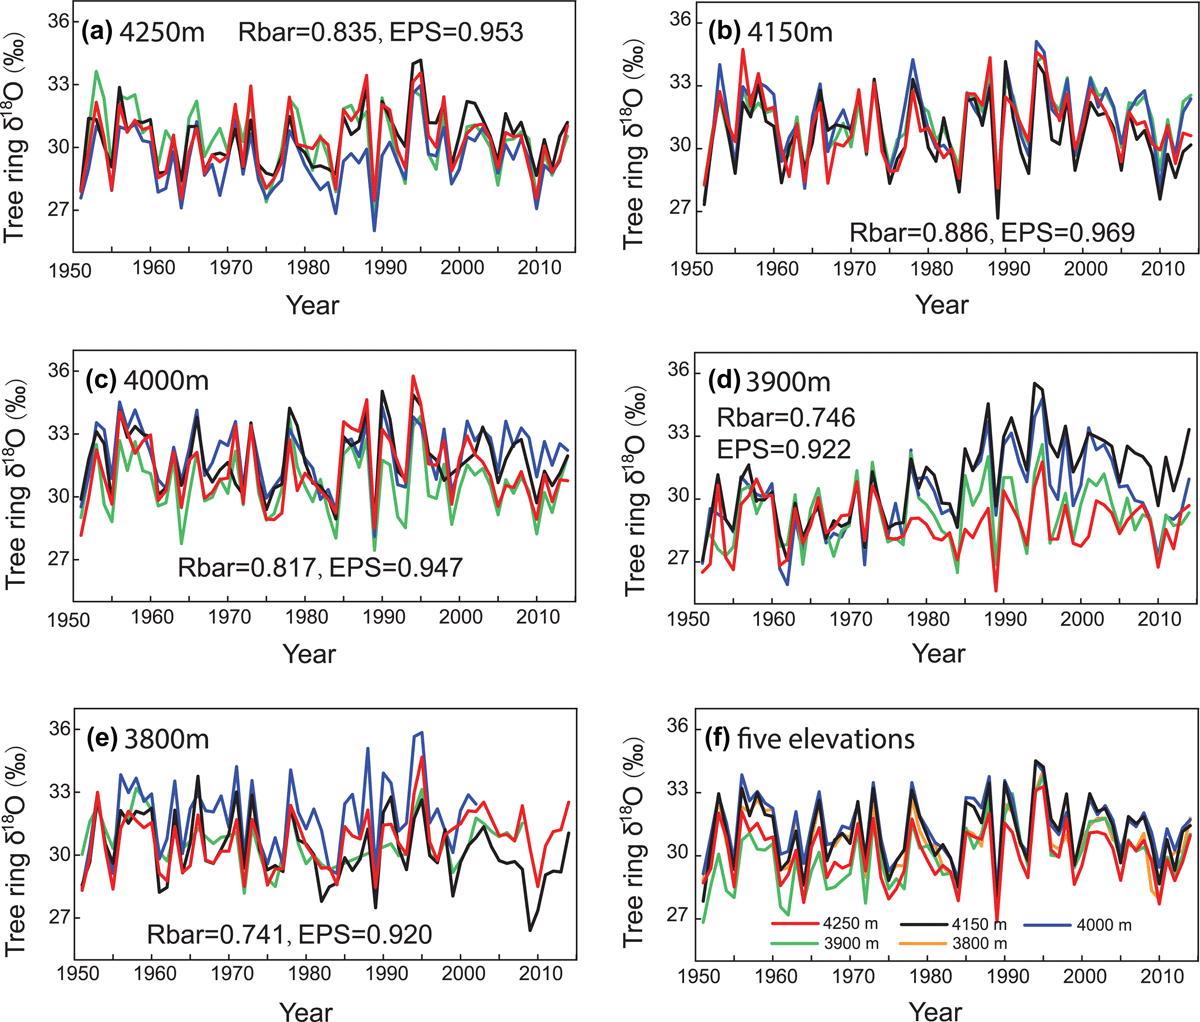
Fig. 6.
Tree ring δ 18O time series from different altitudes. Coloured lines in Figure 6a–e indicate oxygen isotope time series from different trees in each altitude, and coloured lines in Figure 6f indicate tree ring oxygen isotope time series from different altitudes.
The first-order autocorrelation for all trees except YK109 and YK114 is lower than 0.2 (Table 1). Unlike tree ring width, tree ring oxygen isotopes in the current year are not affected significantly by tree ring oxygen isotopes in the previous year (Hill et al., 1995). Tree ring δ 18O records from individual trees in Laos, Vietnam, Bhutan, Thailand and south-eastern and northern China have lower first-order autocorrelations (<0.2) in monsoonal Asia (Sano et al., 2012b, 2013; Xu et al., 2013a, 2013b, 2015, 2016). On the Tibetan Plateau, the first-order autocorrelation of Qilian juniper δ 18O records in the Qilian Mountains, as constructed by individual trees and pooling, is 0.29 (Qin et al., 2014) and 0.69 (Xu et al., 2011b), respectively.
The first-order autocorrelations of tree ring δ 18O values for YK109 and YK114 are 0.53 and 0.39, respectively, which are much higher than other δ 18O time series at this site. δ 18O data for YK109 (Fig. 6d; black line) and YK114 (Fig. 6d; blue line) show significant increasing trends during the period of 1985–2014, but increasing trends were not found in other trees at the same altitude or at other altitudes at the YK site. The increasing trend may contribute to the observed high first-order autocorrelations for these two trees. The reasons for the increasing trends in YK109 and YK114 are not clear. Climatic conditions cannot explain the trends, because climate is expected to be the same for all trees at the same altitude, and δ 18O values for YK105 (Fig. 6d; green line) and YK115 (Fig. 6d; red line) do not show significant trends. Tree age also cannot explain the increasing trends, because YK114 and YK109 are >200 years old. One possible explanation may be related to genetic variability or physiological factors. The δ 18O values of YK114 and YK109 are higher (2–3‰) than the δ 18O values of YK105 and YK115 during the period of 1985–2005. Based on a tree ring oxygen isotope fractionation model (Roden et al., 2000), enriched cellulose δ 18O may be due to enhanced transpiration, enriched precipitation δ 18O or a reduced exchange ratio with xylem water during cellulose formation. However, the underlying mechanisms that result in different trends for trees from the same site are unclear. Such different trends for the same species at the same site and time have also been observed for Japanese cedar from Yakushima Island, Japan (Dr. Sano, personal communication). Multi-stable isotope analysis, including carbon and hydrogen isotope data, might shed more light on the causes of these different trends.
In addition, δ 18O values for YK109 and YK114 show significant positive correlations with those of the remaining 18 trees, although such trends were not observed in the other trees. It should be noted that such trends which are unrelated to climate are need to be identified and removed for the purposes of paleoclimate reconstructions. As such, measuring δ 18O values from individual trees appears to be necessary for robust reconstructions.
Altitude effects on cellulose δ 18O
3.4.
Averaged tree ring δ 18O time series from five altitudes (3800, 3900, 4000, 4150, 4250 m) were shown in Fig. 6f and Table 1. ANOVA results indicate that there are no significant differences in standard deviation between tree ring δ 18O values from five altitudes. The mean value of δ 18O from five altitudes ranges from 29.98 to 31.42‰, with lowest value of 29.98‰ in 3900 m and highest value of 31.42‰ in 4000 m. There is no significant relationship between tree ring δ 18O and altitude (Fig. 7). Recent study showed that observed lapse rate is very small (−0.06‰/100 m) in the transition zone where are affected by shifting influences between the westerlies and Indian monsoon (Yao et al., 2013). The insignificant correlation between altitude and precipitation δ 18O in study area may be the reason that there is no obvious altitude effect on tree ring δ 18O. Previous study showed that there is 2.3‰ difference between earlywood δ 18O of Smith fir at the high and low altitude in Sygera Mountains of the south-eastern Tibetan Plateau (Zeng et al., 2014), because observed lapse rate is strong (−0.13‰/100 m) in the monsoon domain (Yao et al., 2013).
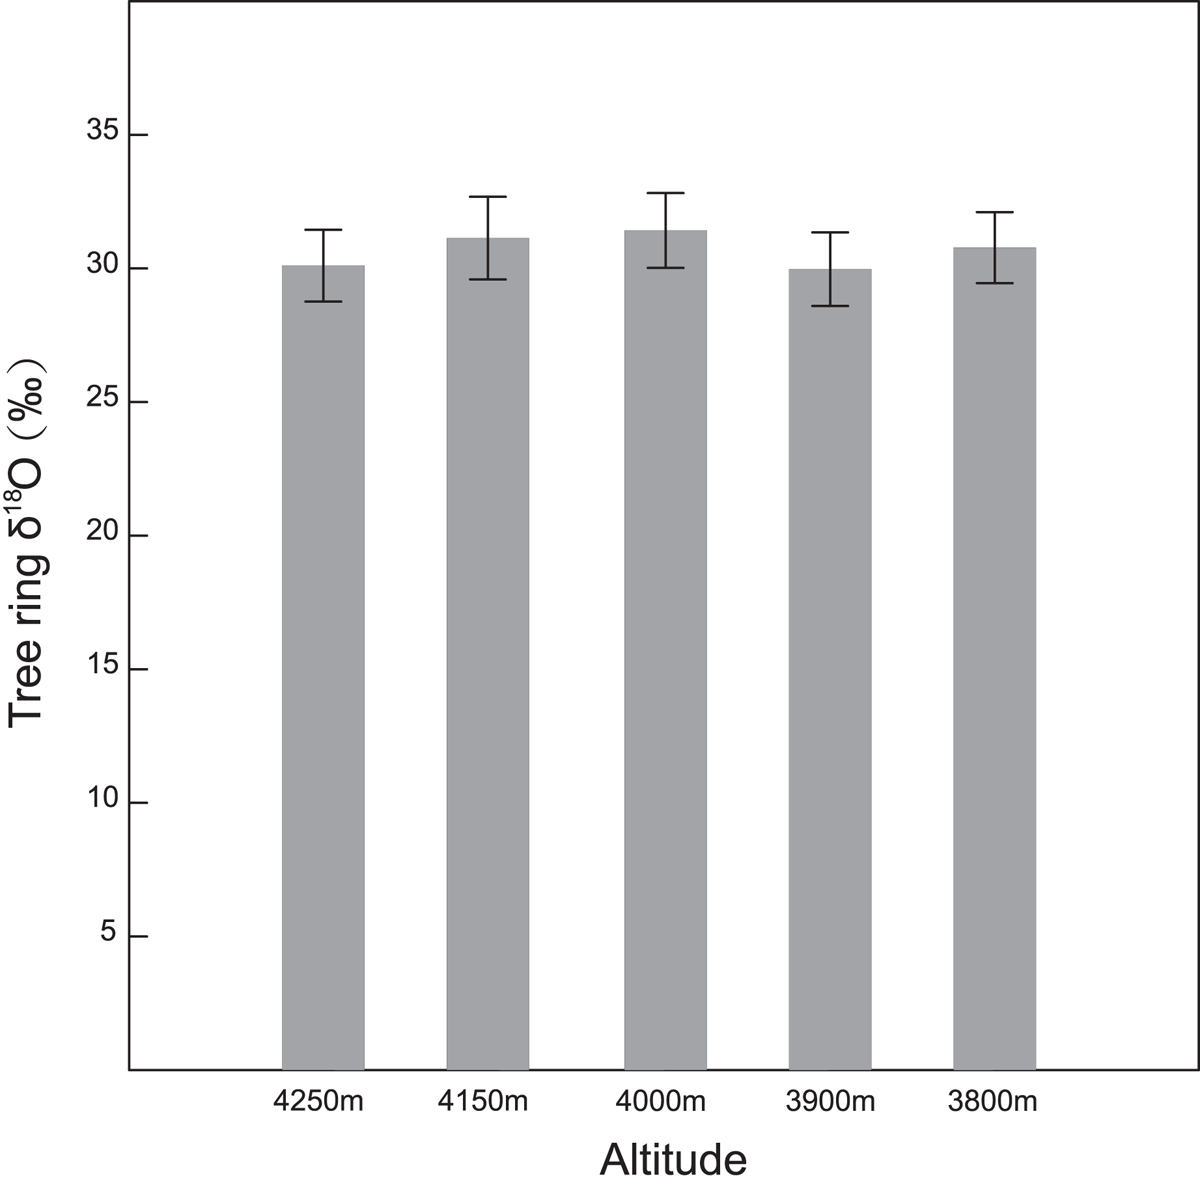
Fig. 7.
Average and standard deviation of tree ring δ 18O data from different altitudes.
The Rbar and EPS of δ 18O from each altitude is shown in Fig. 6. The Rbar of δ 18O from each altitude is from 0.741 to 0.886, which is higher than Rbar of Qilian juniper δ 18O (0.62) in Qilian mountain (Qin et al., 2014) and of Juniper (0.66) in central Asia (Treydte et al., 2006). EPS of tree ring δ 18O from all altitudes ranges from 0.92 to 0.96, which is higher than 0.85 that is considered that the composite chronology represents the mean variance of the population and yields a signal relatively free of noise due to individual variation (Wigley et al., 1984), and is also higher than EPS of Qilian Juniper (0.88) in Qilian mountain (Qin et al., 2014). In addition, tree ring δ 18O from different altitudes are highly correlated (r > 0.88, Table 3). These results indicate that altitude effects for tree ring δ 18O of Qilian Juniper in study area are not observed and samples from each altitude can represent the local signal. Therefore, tree ring δ 18O from all altitudes were averaged to build up the regional δ 18O chronology.
Climatic implications of tree ring δ 18O data
3.5.
Previous studies have shown that tree ring δ 18O values mainly reflect climate in the current growth season (Xu et al., 2011a; Barbour and Song, 2014; Wernicke et al., 2015). A correlation analysis was carried out between tree ring cellulose δ 18O data from different altitude (light blue, yellow, green, dark blue and purple bars in Fig. 8)/all altitudes (red bar in Fig. 8) and regional climatic parameters in the transition zone for the period 1960–2014. Given that the tree ring δ 18O data from each altitude show similar climatic responses (Fig. 8), the climatic implications are considered to be regional in nature. There are no significant correlations between tree ring δ 18O and temperature (Fig. 8a). The δ 18O data are significantly correlated with May–July precipitation (r = −0.67; n = 55; p < 0.001), and the correlation coefficients between precipitation and δ 18O are similar for the months of May, June and July (Fig. 8b). The regional δ 18O values show a negative correlation with May–July humidity (r = −0.51; n = 55; p < 0.001), where the main signal originates from June and July (Fig. 8c). The significant negative correlation between tree ring δ 18O and relative humidity is readily explained by the tree ring oxygen isotope fractionation model (Roden et al., 2000). Lower relative humidity results in enhanced evapotranspiration, which causes the leaf water δ 18O to be enriched and leads to the evaporation of soil water. Therefore, enriched leaf water and xylem water δ 18O cause the higher cellulose δ 18O.
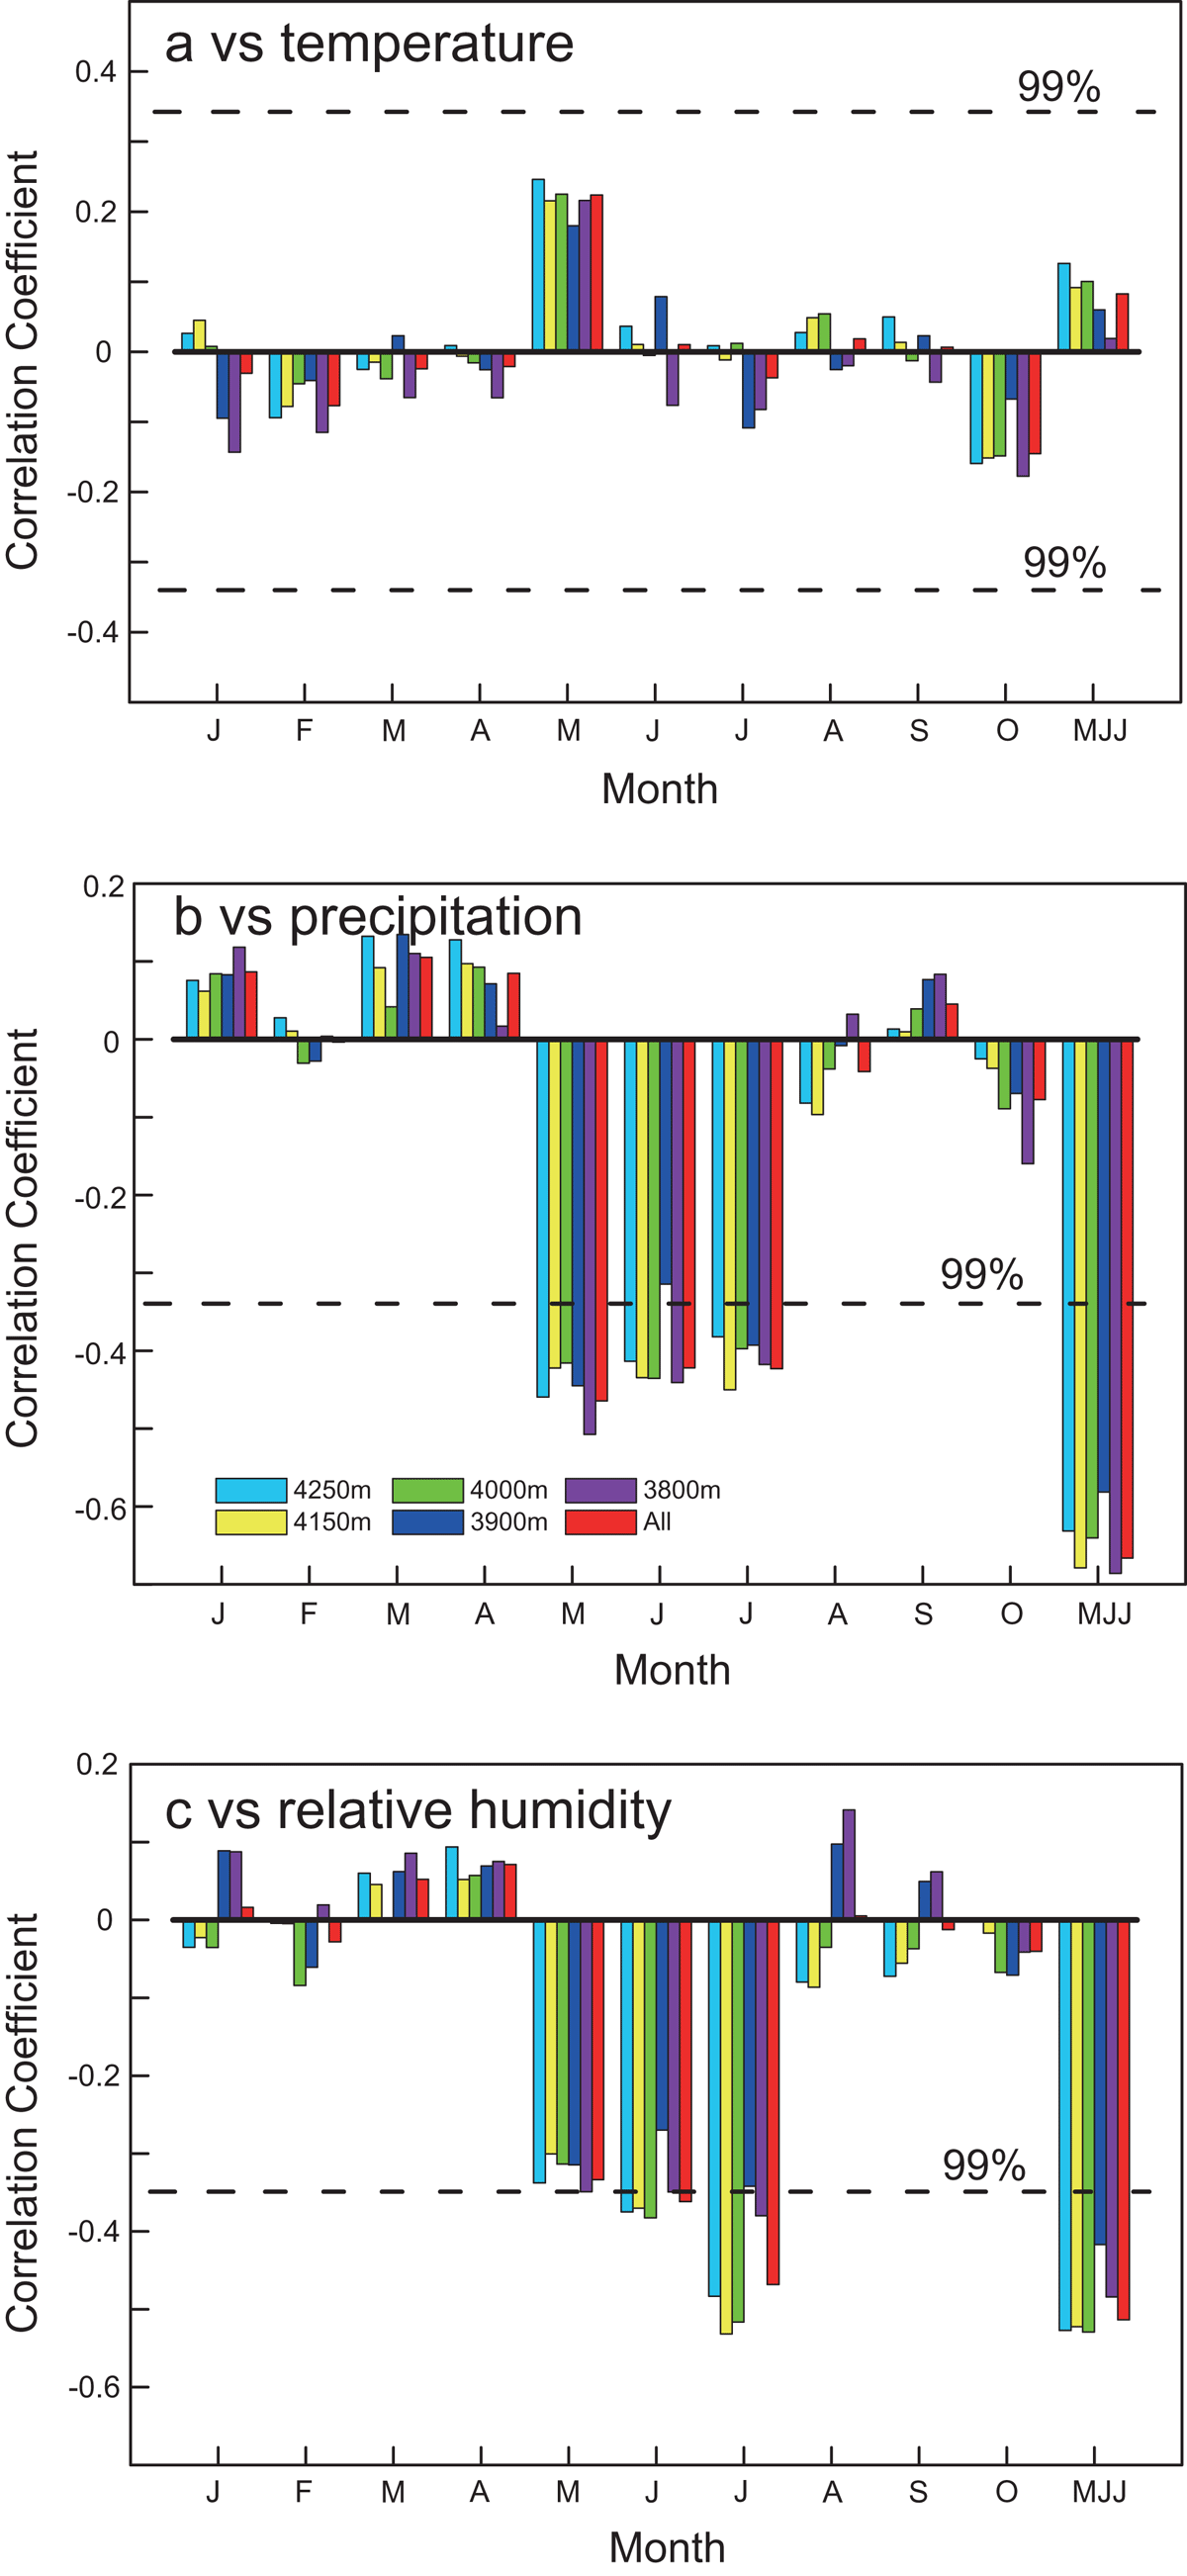
Fig. 8.
Correlations between tree ring δ 18O from different altitudes and regional temperature (a), precipitation (b) and relative humidity (c) obtained from eight instrumental stations during 1960–2014.
Positive correlations between relative humidity and precipitation (r = 0.44; n = 55; p < 0.01) indicate that precipitation can affect tree ring δ 18O by influencing relative humidity. The correlation between precipitation and tree ring δ 18O is higher than that between relative humidity and tree ring δ 18O. Thus, there are other processes that precipitation influence tree ring δ 18O. Spatial correlations between tree ring δ 18O and precipitation (Fig. 9) show that tree ring δ 18O has a significant negative correlation with precipitation near the study area and west of the sampling location, which may reflect the rainout effect during water vapour transportation (Rozanski et al., 1992). Previous studies have also indicated that precipitation δ 18O is linked to rainout processes in surrounding regions (Lawrence et al., 2004; Kurita et al., 2009). Greater rainfall in surrounding or upstream areas associated with rainout of heavy isotopes results in more depleted precipitation δ 18O and tree ring δ 18O. This negative correlation between tree ring δ 18O and regional precipitation has also been observed in several sites elsewhere in Asia (Sano et al., 2013; Xu et al., 2013b, 2015, 2016).
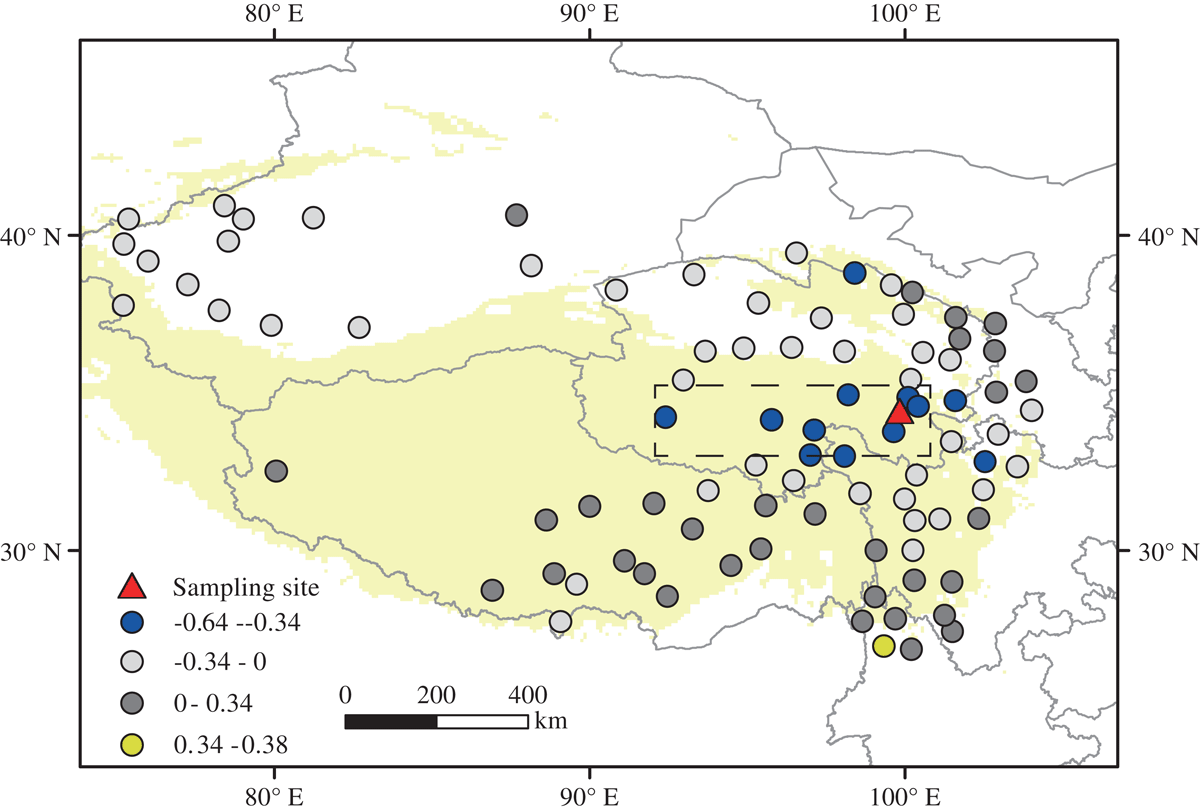
Fig. 9.
Spatial correlations between tree ring δ 18O and May–July precipitation from meteorological stations on the Tibetan Plateau from 1960 to 2014.
Conclusion and perspectives
4.
In this study, we analysed cellulose δ 18O in 21 trees of Qilian juniper from the Animaqing Mountains to investigate potential juvenile and altitude effects, intra- and inter-tree δ 18O variability and climatic implications of cellulose δ 18O. The δ 18O values of young trees are sometimes lower than the δ 18O values of old trees, but this effect is limited to the first 10 years of growth. δ 18O values of young Qilian juniper with cambial ages >10 years are very similar to those of old Qilian juniper. Excluding the first 10 years of growth allows paleoclimate reconstructions from young trees. ANOVA results show no significant differences in the mean and standard deviation of tree ring δ 18O values at different heights and directions, and tree ring δ 18O time series from different heights and directions are highly correlated.
The mean inter-series correlation (Rbar) and EPS for tree ring δ 18O data from each altitude are very high, and tree ring δ 18O data from five altitudes are highly correlated and share a similar climatic response. Altitude effects on tree ring δ 18O values are not observed in the study area. These findings indicate that reconstructing long-term δ 18O records using samples from one site regardless of sampling height, direction and altitude is a robust approach. Given that the tree ring width of Qilian juniper is sometimes narrow, using data from different trees/cores with relatively wide rings is a viable way of building a composite δ 18O record. Such an approach may also be applicable to juniper from the northern and southern Tibetan Plateau. Tree ring δ 18O data from the Animaqing Mountains exhibit a significant negative correlation (r = −0.67; p < 0.001) with May–July regional precipitation. Future studies should be able to use tree ring δ 18O data as a proxy of paleo-precipitation and tree ring width as a proxy of paleo-temperature in the Animaqing Mountains.
Disclosure statement
No potential conflict of interest was reported by the authors.
Funding
This work was jointly funded by the National Natural Science Foundation of China [grant number 41630529], [grant number 41672179], and [grant number 41690114]; the Chinese Academy of Sciences (CAS) Pioneer Hundred Talents Program; the National Key R&D Program of China [grant number 2016YFA0600502]; and a Grant-in-Aid for Scientific Research [grant number 2310262] from JSPS, Japan.
Supplemental data
Supplemental data for this article can be accessed here https://doi.org/10.1080/16000889.2017.1391663.
Acknowledgements
We deeply appreciate the helpful comments from two anonymous reviewers and the editor to improve the manuscript.