
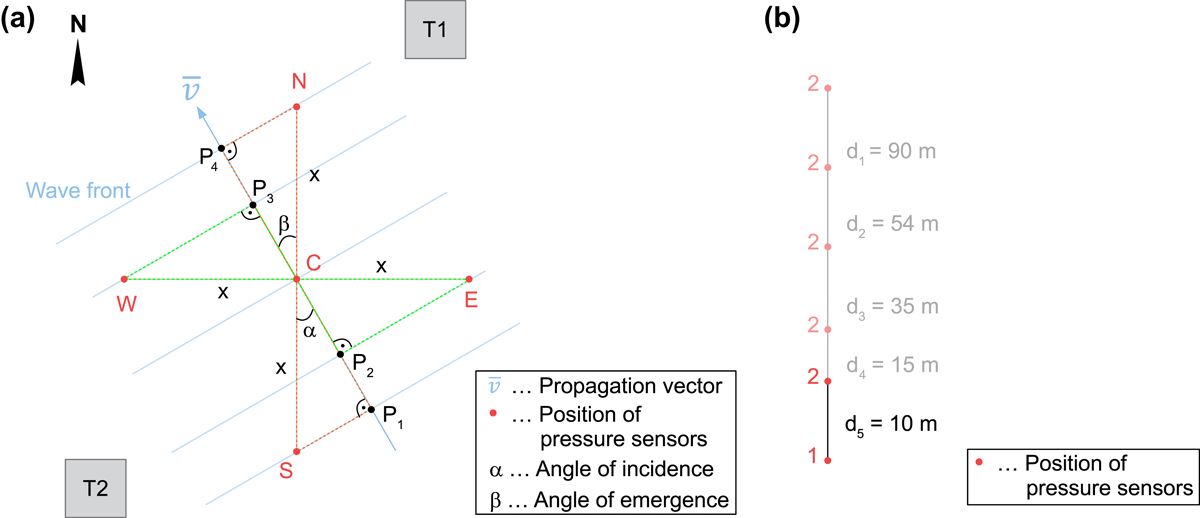
Fig. 1.
Schematic representation of the measurement configurations: (a) An array of five air pressure sensors installed between the towers T1 and T2. An arbitrary air pressure wave is shown in blue. The orange and green right-angled triangles are used to calculate the direction of propagation of the air pressure wave. (b) Two air pressure sensors installed with varying distance d i (i = 1, …, 5).
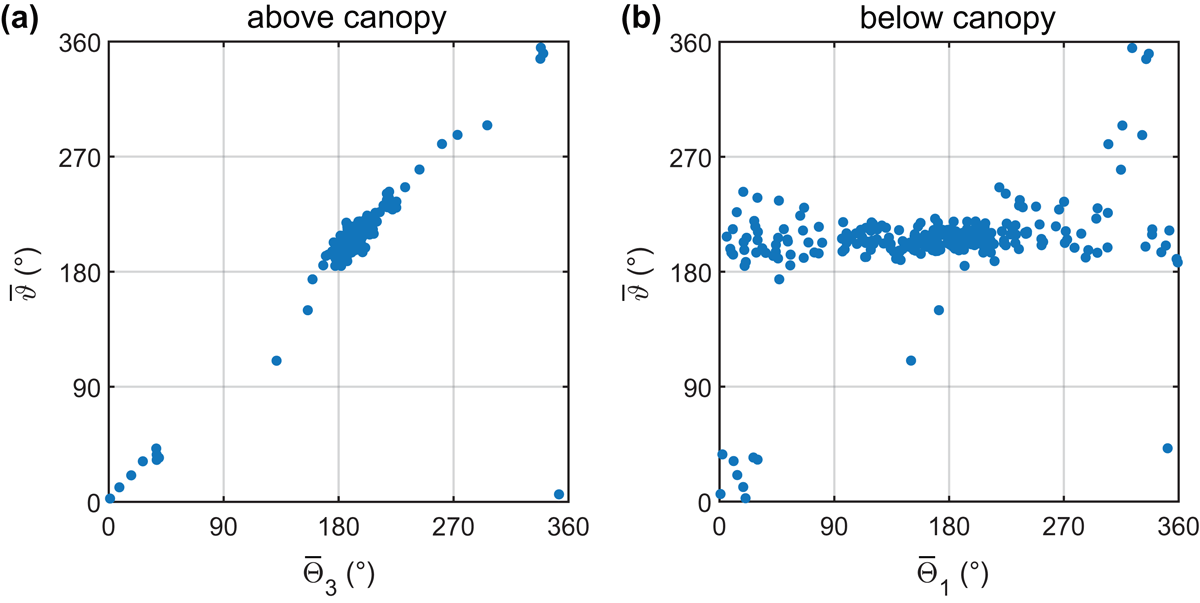
Fig. 2.
Dependence of mean direction of propagation of air pressure fluctuations () on (a) mean wind direction at z 3 () measured at T1, (b) mean wind direction at z 1 () measured at T1.
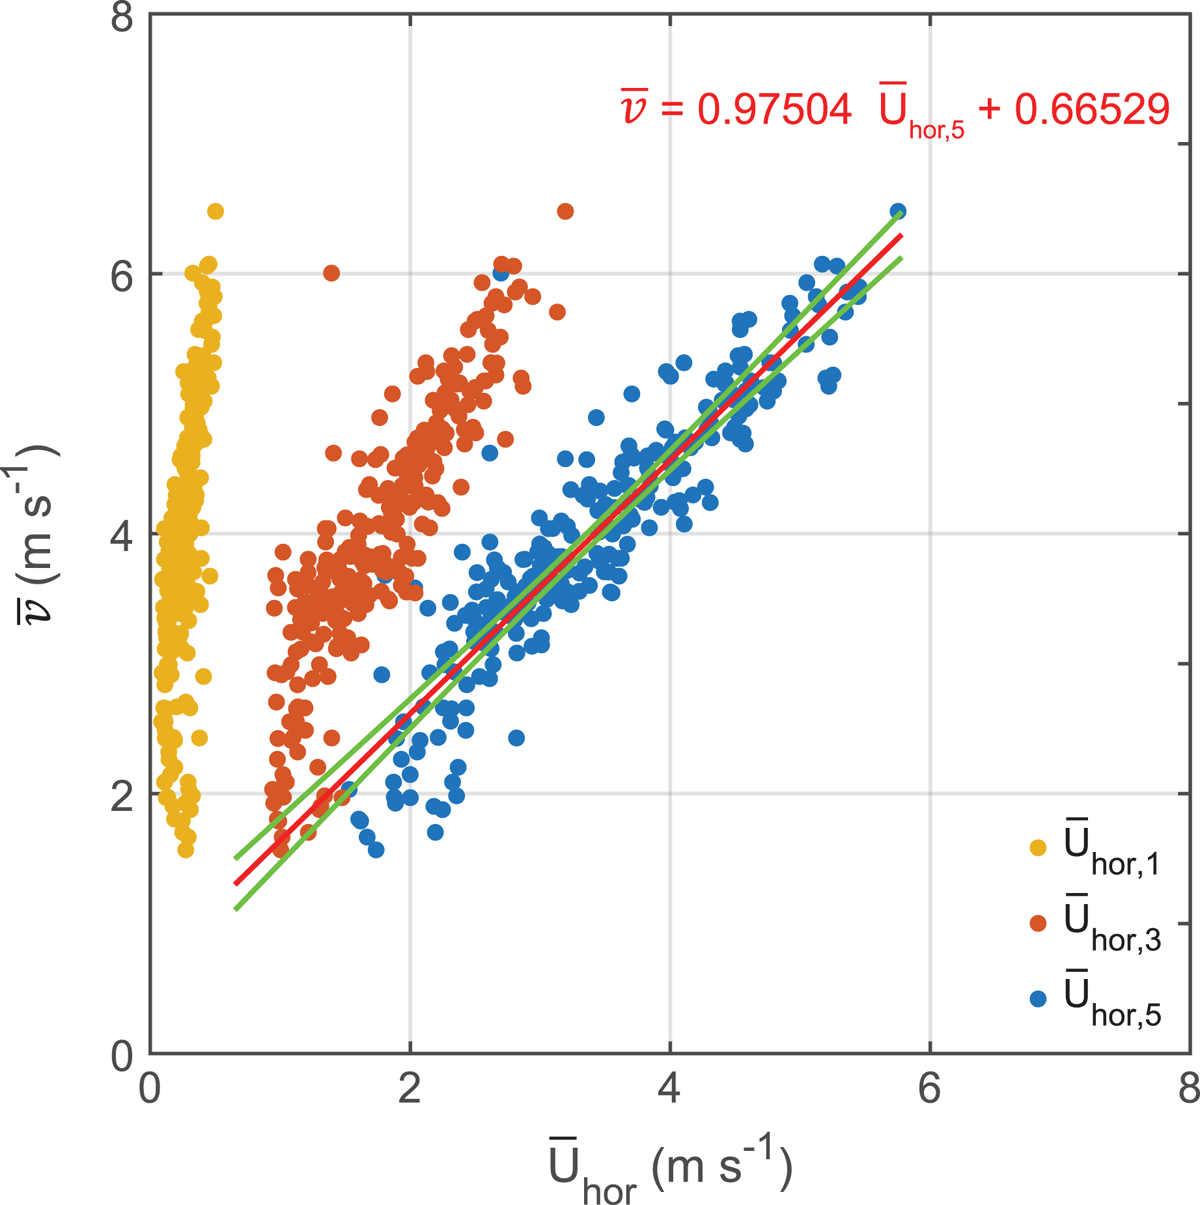
Fig. 3.
Dependence of mean propagation speed of the air pressure fluctuations () on mean horizontal wind speed at heights z 1 (), z 3 () and z 5 (). A linear fit for is shown in red (R 2 = 0.83) along with the 95% confidence intervals in green.
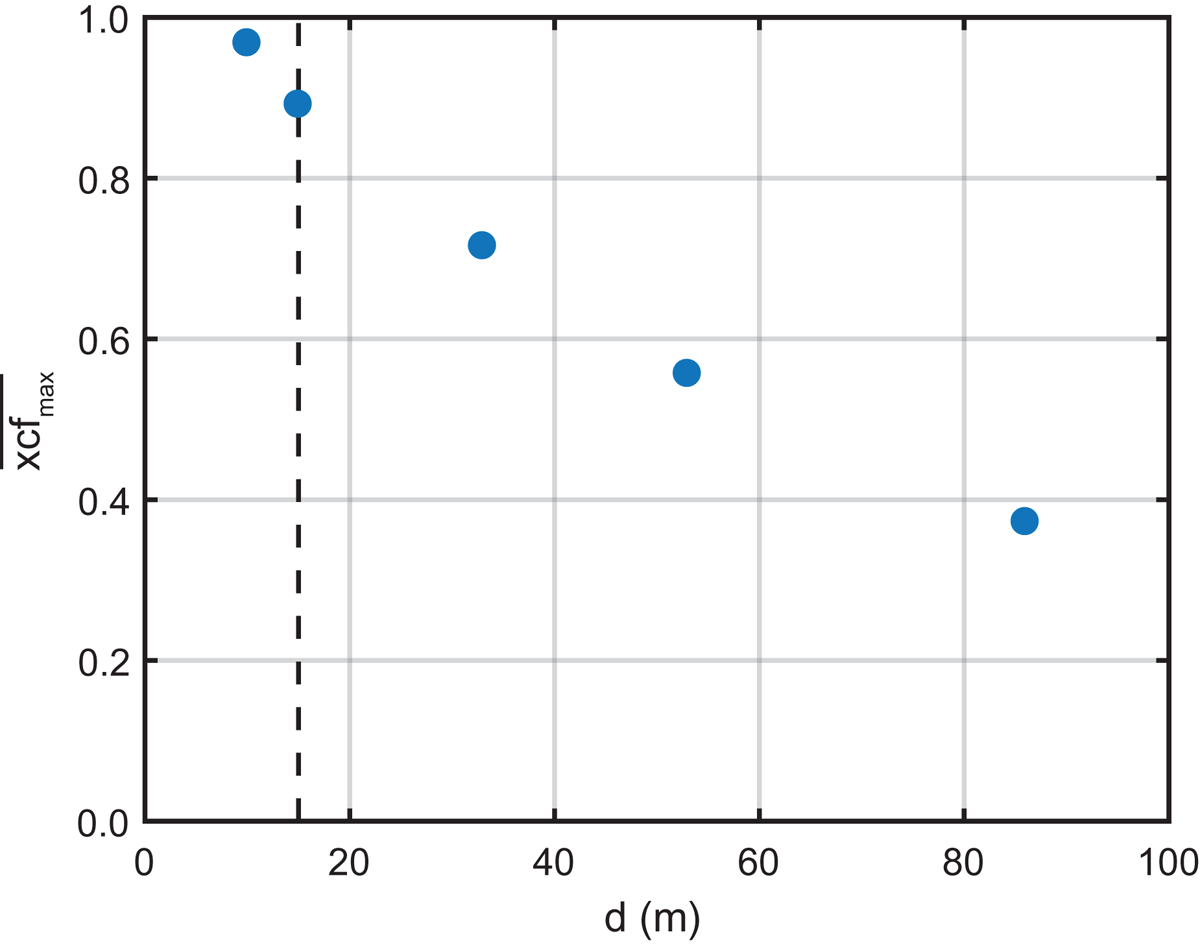
Fig. 4.
Mean maximum cross-correlation () between the air pressure fluctuations of two pressure sensors as a function of distance d. The dashed line indicates the distance d = 15 m.
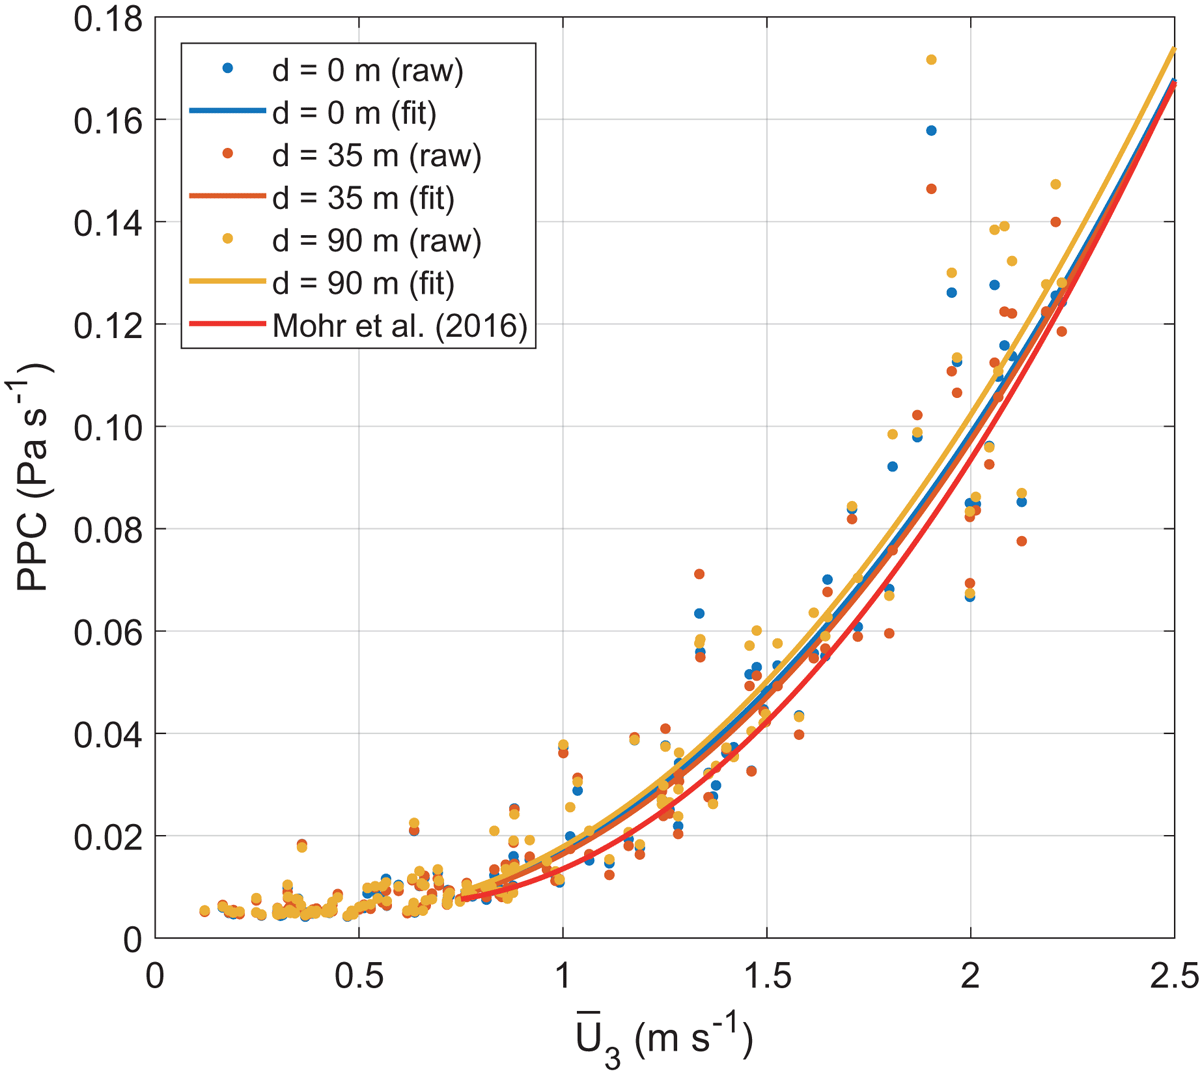
Fig. 5.
Dependence of PPC on mean above-canopy wind speed at height z 3 for the pressure signals at distances d = 0, 35 and 90 m (dots). In addition, the raw data are fitted with a quadratic function (solid lines). The dependence found by Mohr et al. (2016) is shown in red.