
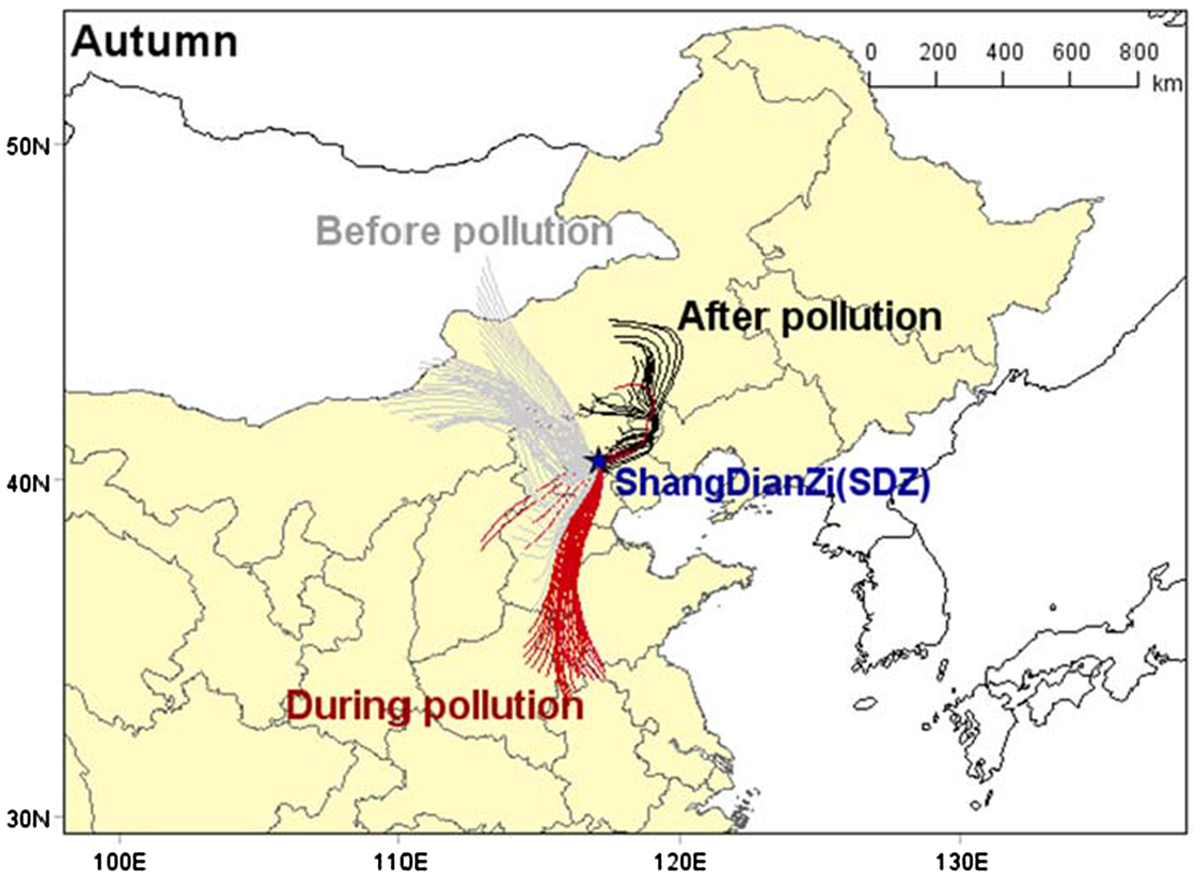
Fig. 1.
Location of Shangdianzi (SDZ) regional GAW station, and back trajectories per hour of air mass in SDZ during autumn.
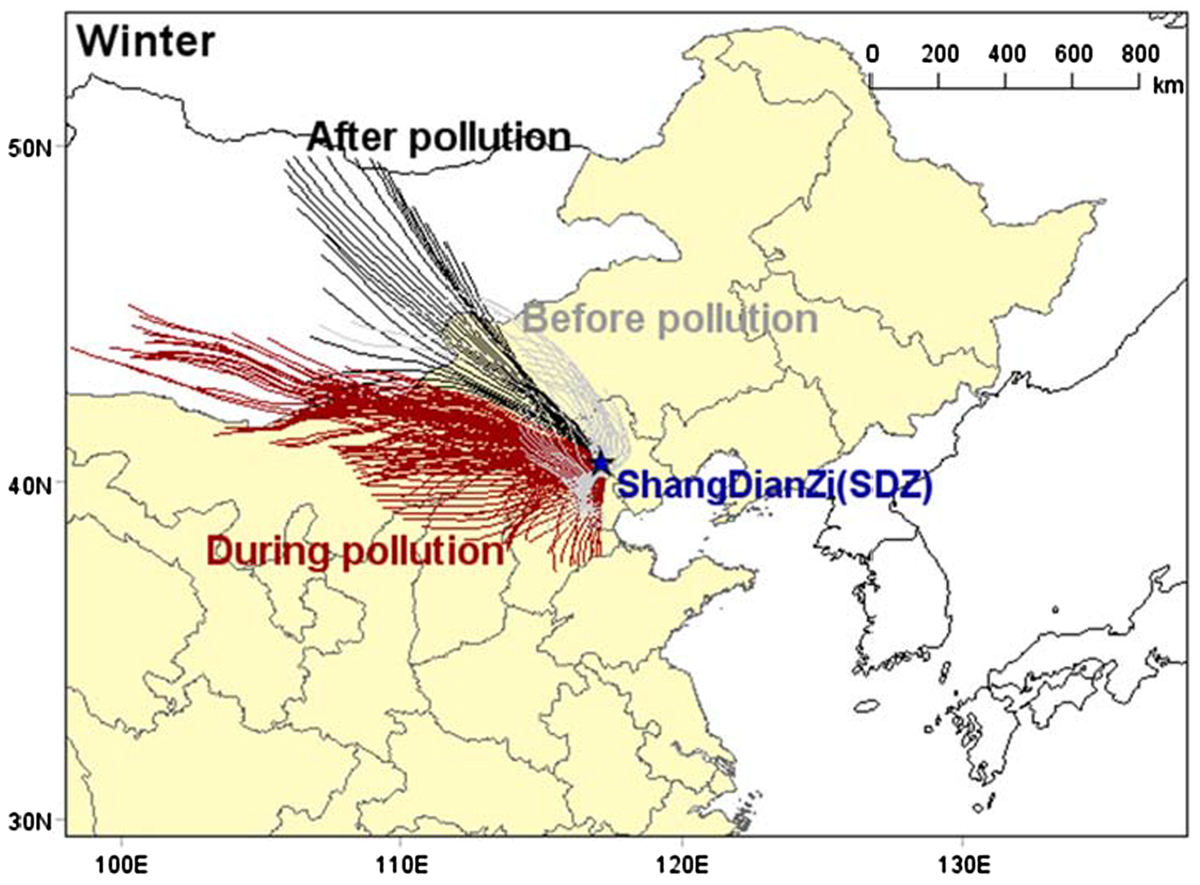
Fig. 2.
Location of Shangdianzi (SDZ) regional GAW station, and back trajectories per hour of air mass in SDZ during winter.
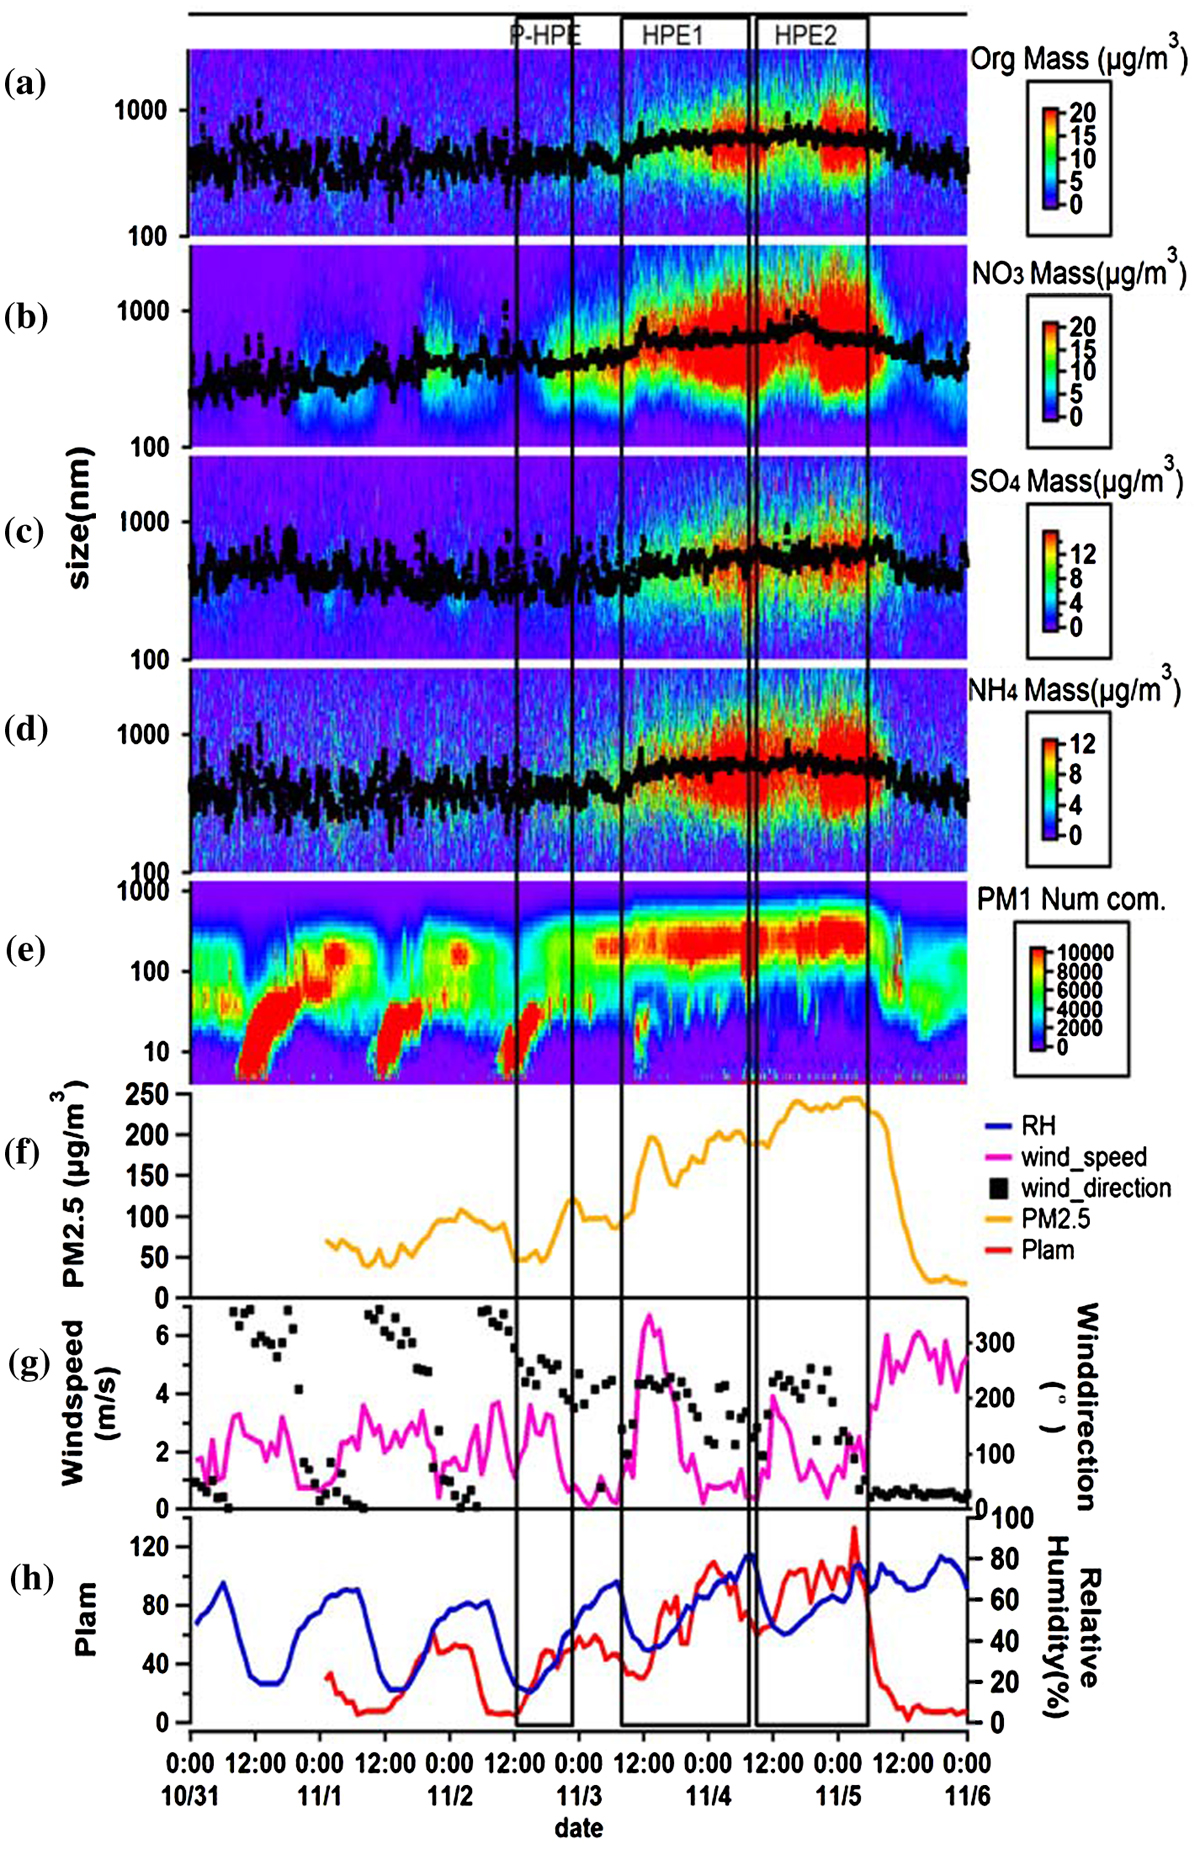
Fig. 3.
Time series of mass concentration with the change of size of organics (a), nitrate (b), sulphate (c), ammonium (d) measured by AMS and number concentration of PM1 measured by TDMPS (e) at SDZ regional GAW station, PM2.5 measured at Beijing Wanliu station (f), meteorological characteristics such as wind direction and speed (g), PLAM and relative humidity (h) during autumn.
Table 1.
Mass concentration and increased percentage of chemical components of PM1 during autumn HPEs.
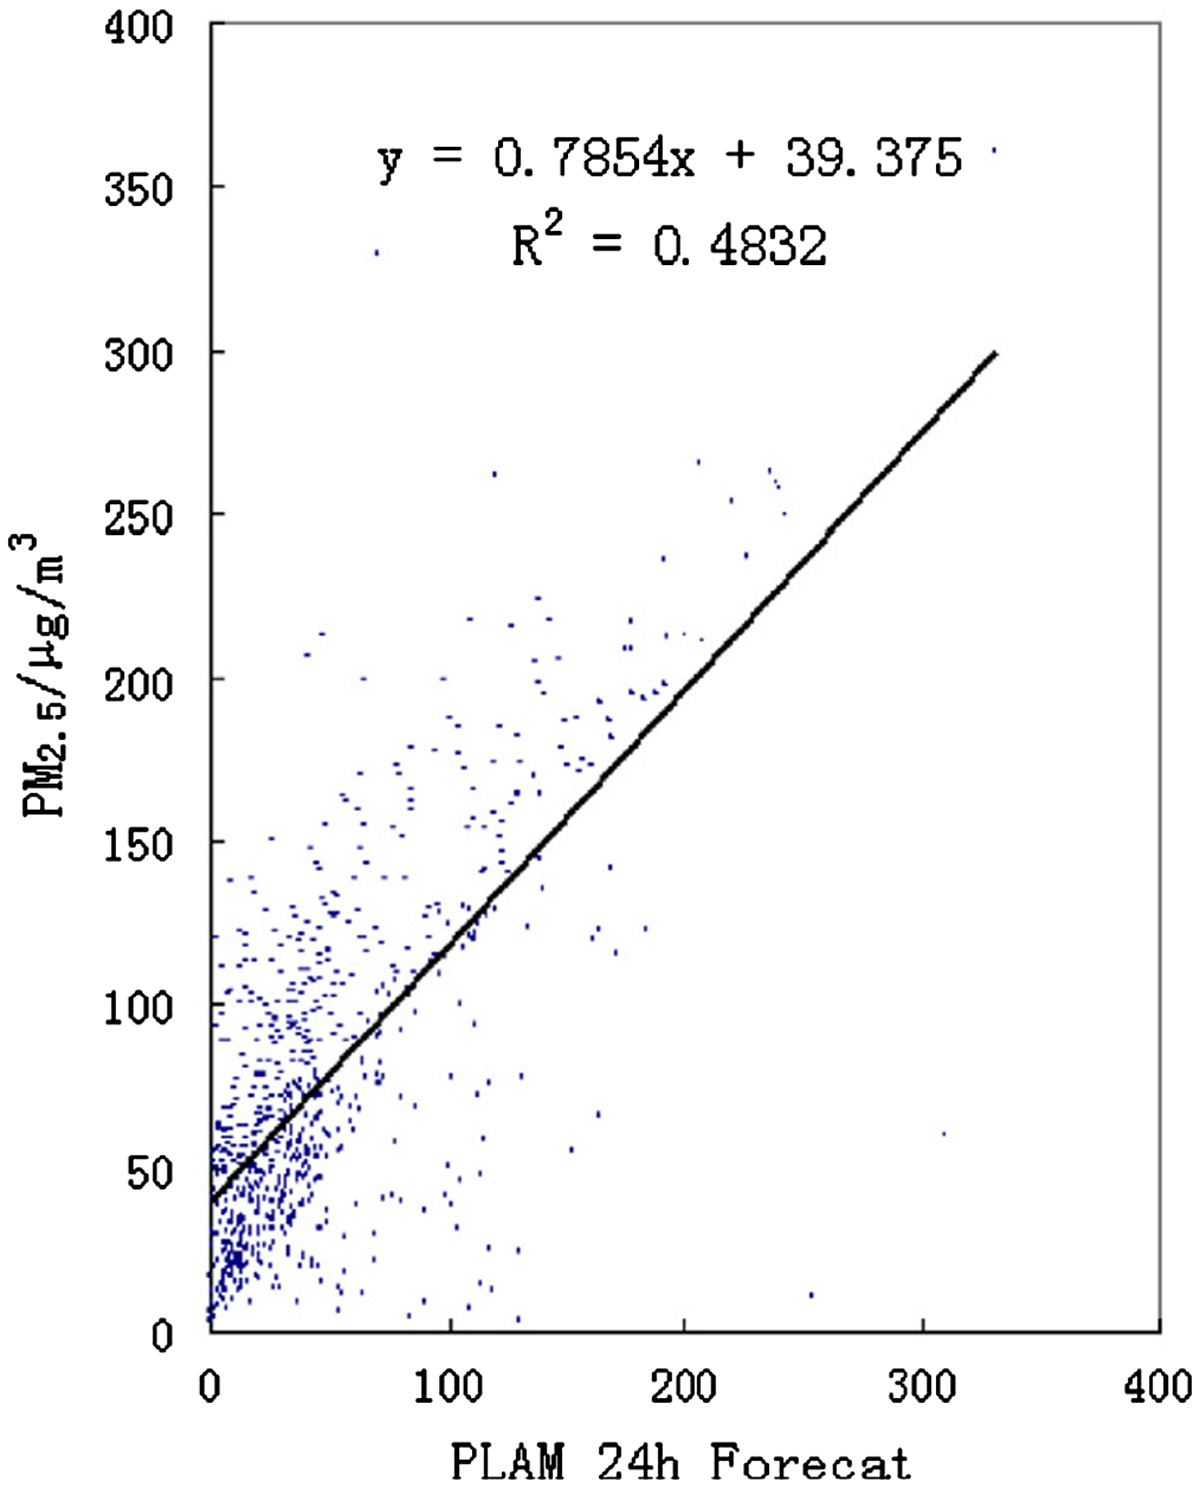
Fig. 4.
Correlation between PLAM index 24-h forecast and PM2.5 during 2007–2008 (Wang et al., 2013a).
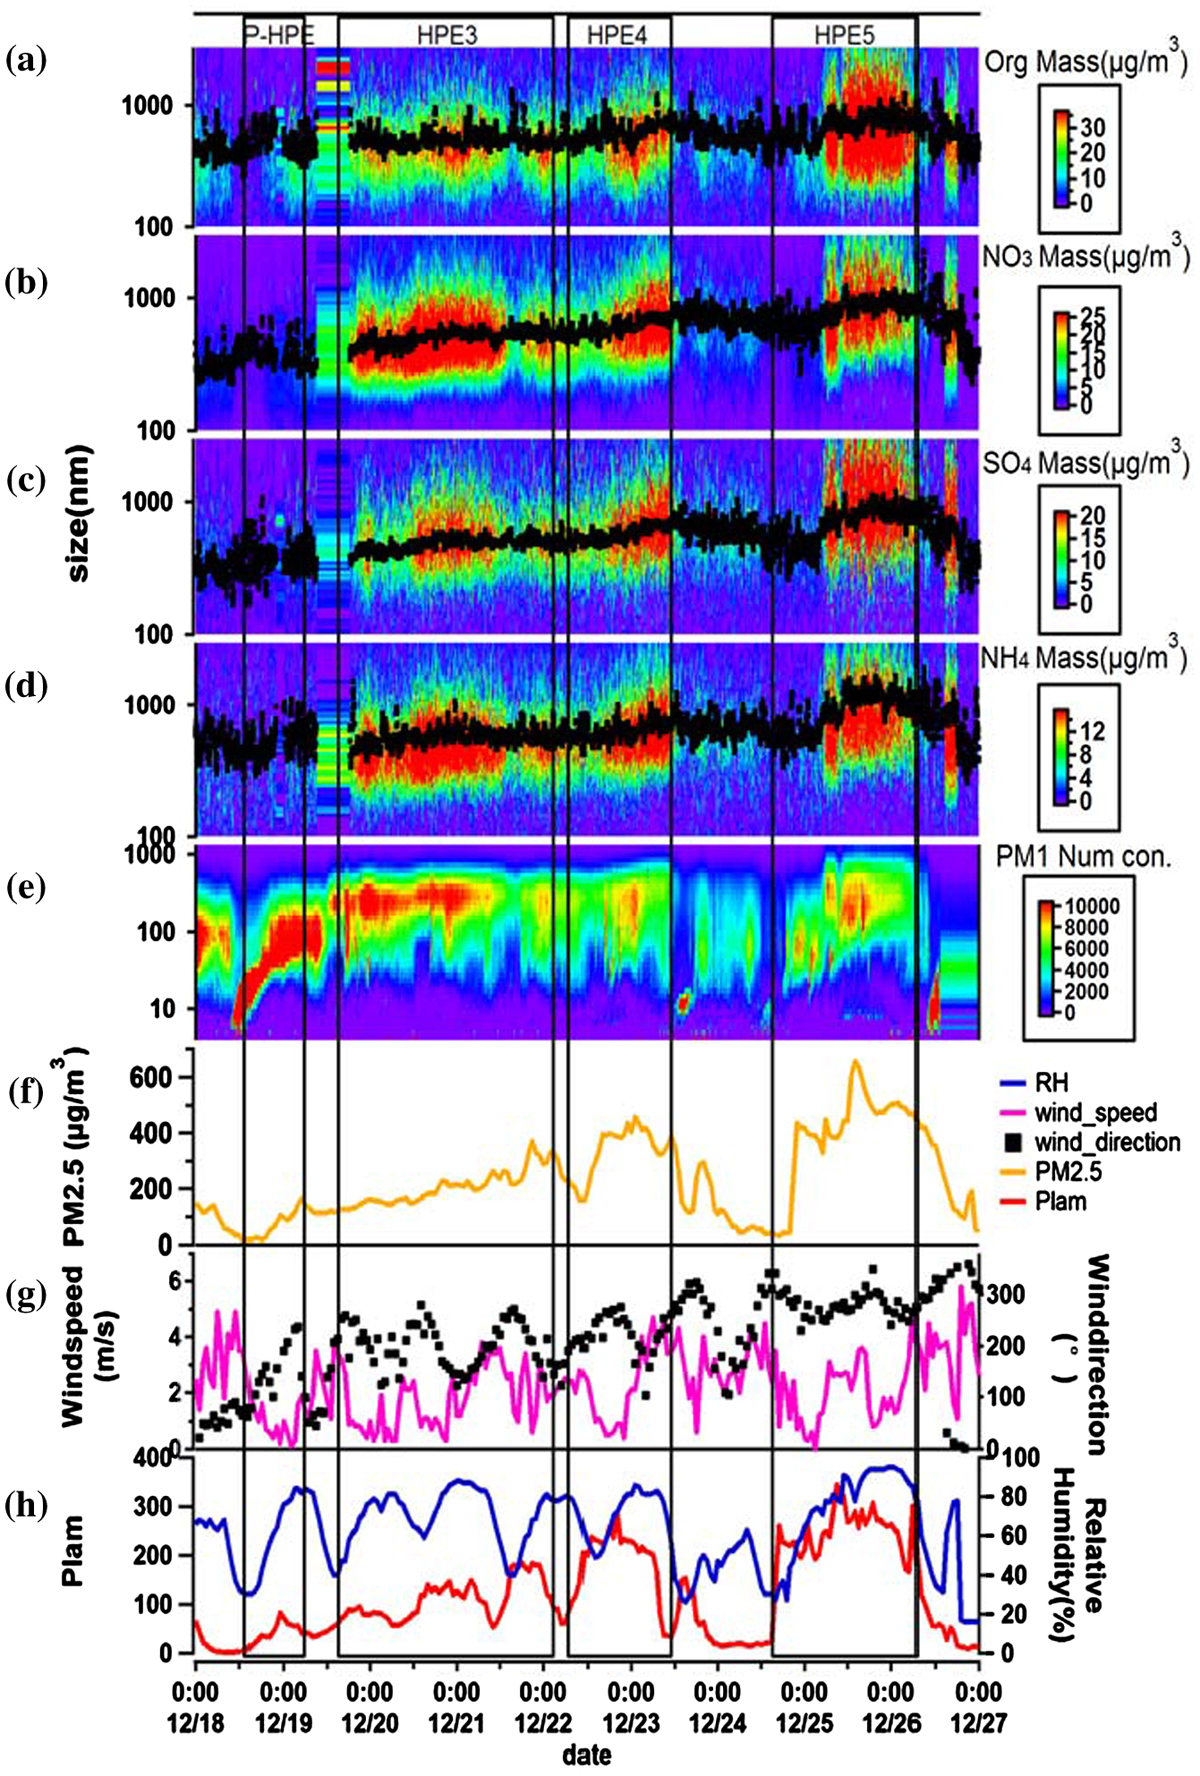
Fig. 5.
Time series of mass concentration with the change of size of organics (a), nitrate (b), sulphate (c), ammonium (d) measured by AMS and number concentration of PM1 measured by TDMPS (e) at SDZ regional GAW station, PM2.5 measured at Beijing Wanliu station (f), meteorological characteristics such as wind direction and speed (g), PLAM and relative humidity (h) during winter.
Table 2.
Mass concentration and increased percentage of chemical components of PM1 during winter HPEs.
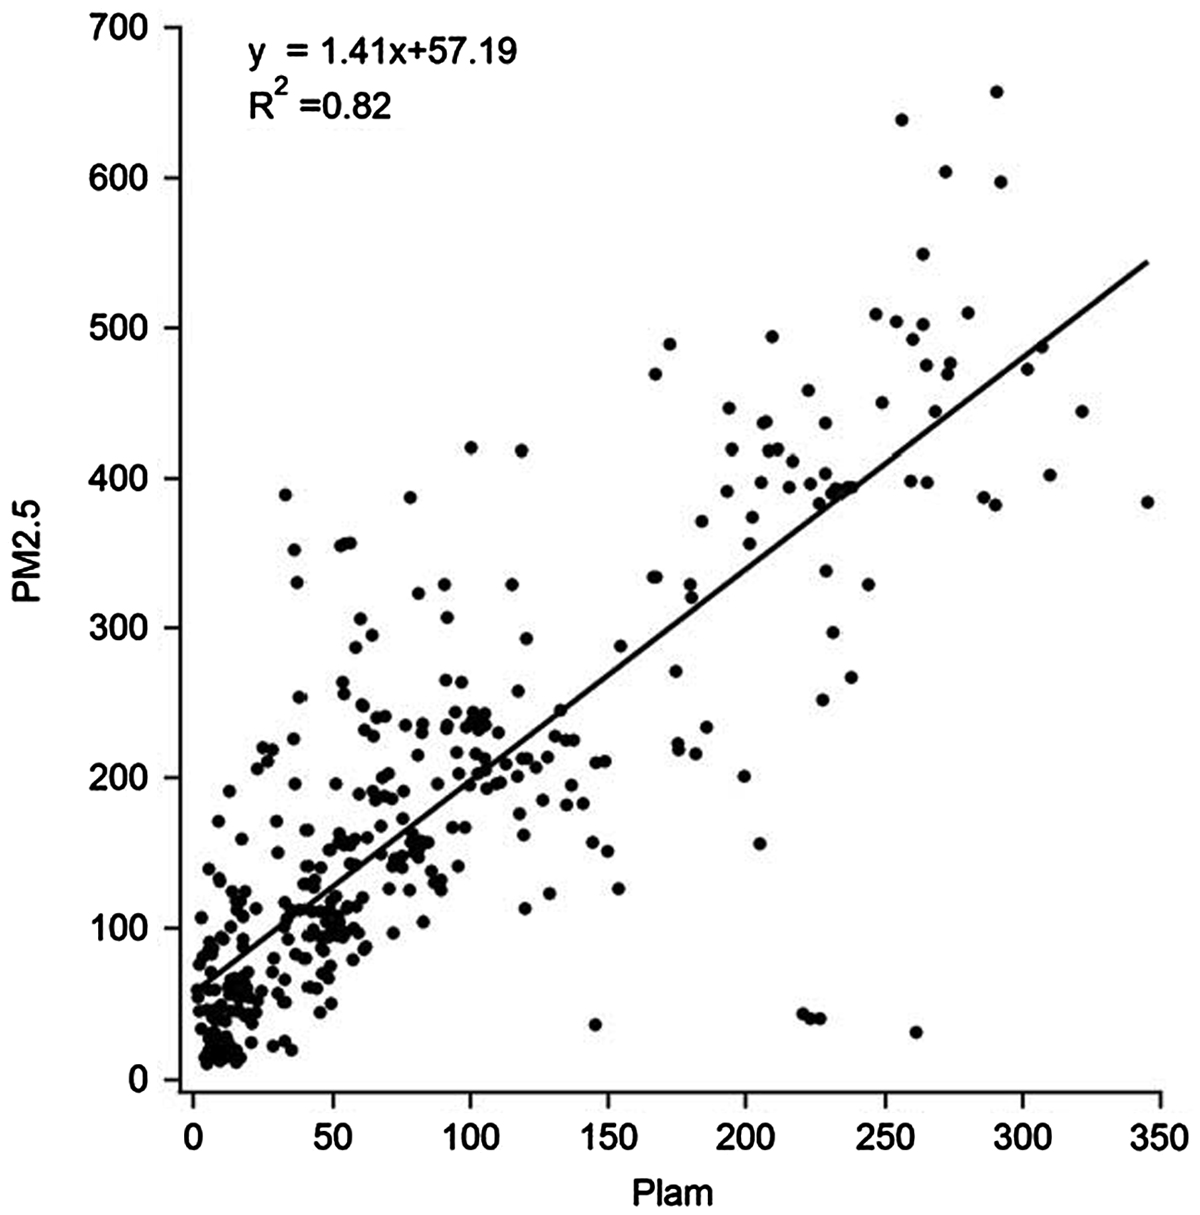
Fig. 6.
Correlation between the PLAM and PM2.5 during all HPEs in autumn and winter of 2015.