
Introduction
1.
In recent decades, Chinese aerosol pollution has become increasingly serious. This is partially due to large emissions of air pollutants from anthropogenic activities, e.g. traffic, industry, and power plants (Zhang et al., 2008; Sun et al., 2013), but is also influenced by increased bad weather conditions (Choobari et al., 2012; Zhang et al., 2015a). In particular, heavy aerosol pollution episodes (HPEs) have often occurred and formed over a short period since January of 2013. During typical HPEs in the Beijing and its vicinity (BIV), mass concentrations of PM2.5 can double in several hours, which may be resulted from previously un-described chemical mechanisms, but the interaction between aerosol pollutants and the conditions of boundary layer may also play an important role. Some studies have found that if an atmospheric pollution model does not take into account the impact of atmospheric pollution on the stability of the low layer of atmosphere and their induced feedback effect, the model will seriously underestimate the heavy pollution process (Wang et al., 2014b; Zheng et al., 2015). Some studies have reported that model simulation can lead to a difference of monthly PM2.5 mean concentration of 10–30% if we do not consider the two-way interaction (Wang et al., 2014a). This difference in the hourly maximum value of PM2.5 in the North China Plain can reach to 30–70% (Gao et al., 2015). Numerical simulations have shown that the turbulent diffusion led by the interaction between pollutants and the boundary layer decreased by about 52% in a HPE in 2008 and the mixed layer height decreased by about 33%. However, wind speed within the boundary layer increased by about 13%, and the positive feedback from the boundary layer changes correspondingly increased the surface mean concentration of PM2.5 during the HPE by about 13%, but there was no effect on the beginning and end of the HPE (Wang et al., 2015a, 2015b).
The formation and change in secondary aerosol particles are highly affected by the meteorological conditions during HPEs (Zhang et al., 2015a). Investigation of the source and characterization of fine aerosol particle can help us to understand heavy aerosol pollution.
The chemical complexity and labile nature of atmospheric PM strongly favours real-time instrumental analysis techniques that characterize pertinent physical and chemical properties without having to collect, store, and transport samples (Canagaratna et al., 2007). High resolution time of flight aerosol mass spectrometry (HR-TOF-AMS) has been widely used in recent years because it has high temporal and spectral resolution, and can quickly and accurately measure the particle mass concentration, chemical composition and particle size distribution. To date, regional research using AMS measurements on fine aerosol have mainly focused on Europe (Schneider et al., 2013), North America (Aiken et al., 2009) and East Asia (Takegawa et al., 2006; Zhang et al., 2014). Zhang summarized the AMS observations of 37 sites in the northern hemisphere mid-latitude region, including urban areas, rural areas and background stations in remote areas, in terms of the characteristics of chemical composition, mass concentration and size distribution in these different areas (Zhang et al., 2007). In China, AMS-based field campaigns and studies have mainly focused on urban areas such as Beijing (Zhang et al., 2013b), Shanghai (Tang et al., 2014) and Guangzhou (Huang et al., 2011). Zhang et al. conducted an AMS observation experiment in the Beijing urban area in 2008 and examined the characteristics of chemical composition and seasonal changes of PM1 (Zhang et al., 2013b). However, knowledge about sources, and changing processes of background aerosol in other areas, especially during HPEs in North China (Quan et al., 2014), remains limited. Therefore, the regional HPEs have become the focus of intensive research activities.
In this study, we examined the chemical composition of background NR-PM1 (non-refractory PM1) in the BIV area during HPEs in autumn and winter of 2015. In addition, we analysed the parameterized index linking air pollution with meteorological conditions (PLAM) (Zhang et al., 2009) and other meteorological elements to evaluate specific meteorological conditions and their feedback on HPEs. These approaches will provide insights into the reasons behind aggravated heavy pollution processes in the first few hours of HPEs in BIV.
Method
2.
Site and experiment descriptions
2.1.
Shangdianzi (SDZ), one of the regional stations of Global Atmospheric Watch (GAW) programme, located at Shangdianzi village, Gaoling Town of Miyun County (117.07°E, 40.39°N, 287 m a.s.l). It is surrounded by hilly vegetation with limited local anthropogenic pollutant sources. On the territory, it belongs to the northern part of North China Plain, about 55 and 150 km north-east of the urban areas of Miyun and Beijing, respectively. The observations at SDZ are representative for atmospheric conditions of the BIV (Xu, 1992; An et al., 2012) (Figs. 1 and 2).
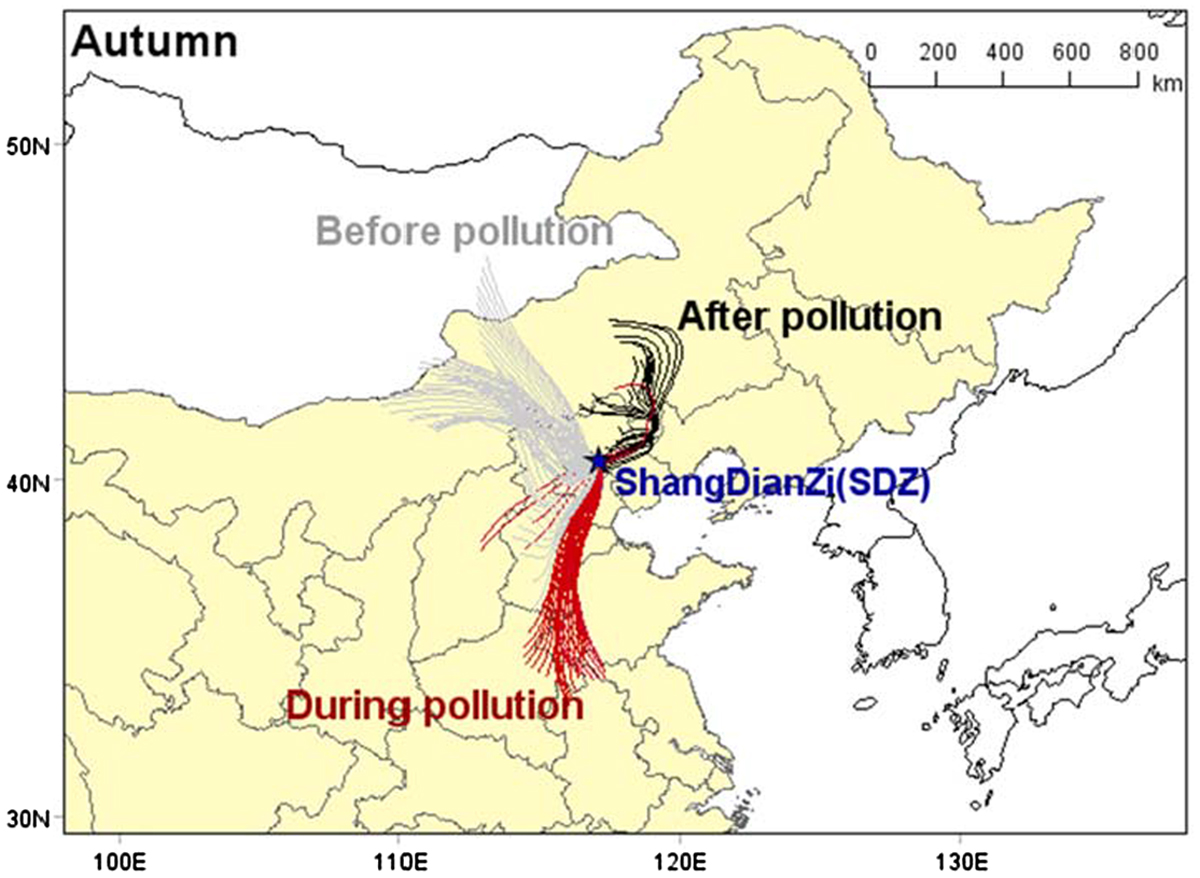
Fig. 1.
Location of Shangdianzi (SDZ) regional GAW station, and back trajectories per hour of air mass in SDZ during autumn.
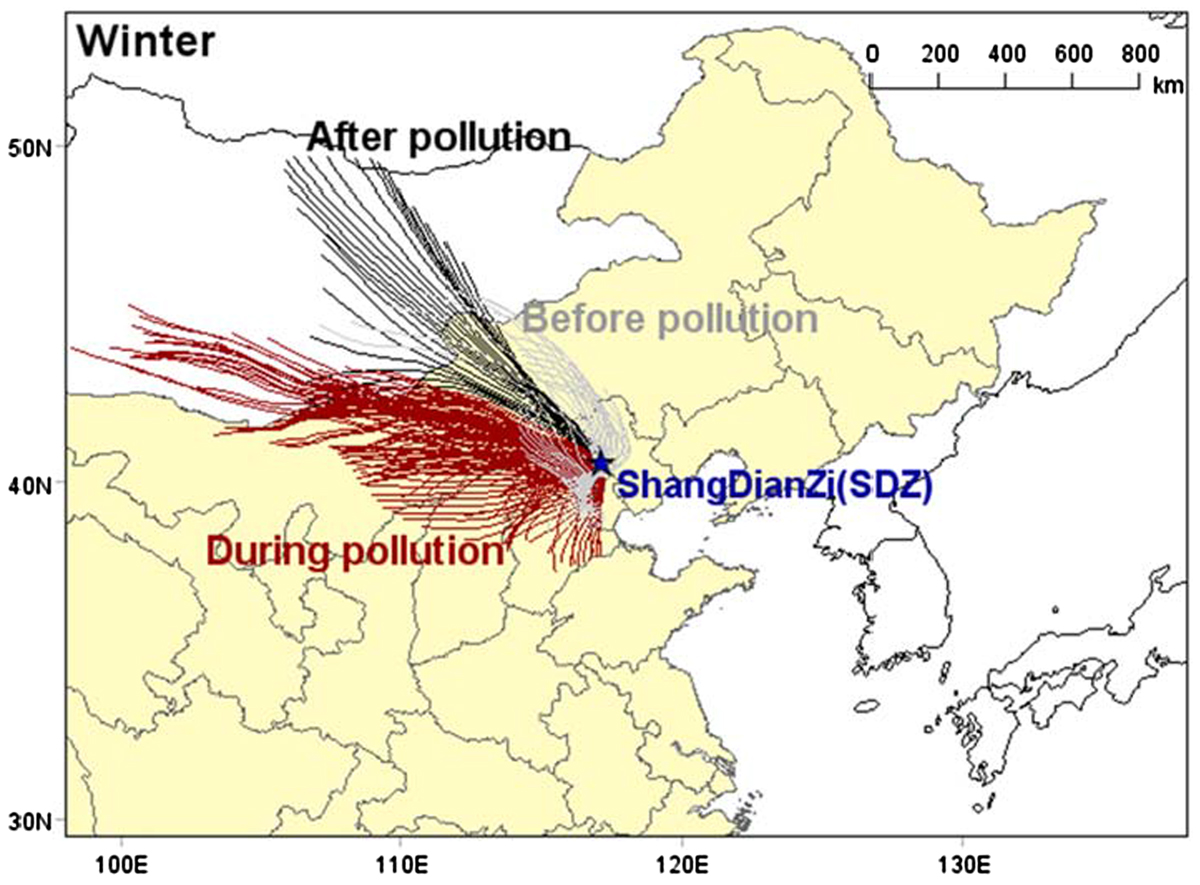
Fig. 2.
Location of Shangdianzi (SDZ) regional GAW station, and back trajectories per hour of air mass in SDZ during winter.
This field campaign conducted at two periods, one is from 31 October to 6 November 2015, another is from 16 December to 27 December 2015, which covered autumn and wintertime respectively. A HR-TOF-AMS (Aerodyne Research Inc. Boston, TX, USA) was utilized to measure the size-resolved mass concentration of chemical components (organics, sulphate, nitrate, ammonium and chloride) in non-refractory PM1 (NR-PM1) (Decarlo et al., 2006; Kimmel et al., 2011). A twin differential mobility particle sizer (TDMPS) were also used to measure aerosol particle number concentration (Shen et al., 2014). An aerosol particle mass analyzer (Malloy et al., 2009) was used to measure the density of the aerosol. In addition, hourly meteorological data including wind direction, wind speed, temperature, humidity, air pressure, precipitation as well as trace gas data (including NOx, SO2, CO, and O3) were measured at the same time. Except the automatic weather station, all the other instruments were set in the second-floor laboratory. Atmospheric air was introduced to the instruments through a PM10 inlet placed on the roof of the room, with a flow rate of 16.7 l/min. The sample air was dried by an auto-regenerated dryer system (Tuch et al., 2009), and the relative humidity inside the inlet was less than 30%.
Instrument operation and calibration
2.2.
The HR-ToF-AMS has been described in detail previously (Decarlo et al., 2006) and improves upon previous versions of the AMS (Canagaratna et al., 2007) by using a custom high-resolution TOFMS (Tofwerk) (Aiken et al., 2008). The main advantage of the HR-ToF-AMS over previous versions of AMS is the much improved ability of identification and separation of isobaric ions (especially for m/z < 100) that have the same nominal mass but are slightly different in exact mass due to differences in elemental composition (Decarlo et al., 2006). As a result, the high resolution mass spectral data can provide valuable information on the elemental composition (e.g. C, H, O and N) and thus OM/OC ratio of organic aerosol (OA) (Aiken et al., 2008). The TOFMS has two operating modes, utilizing two ion optical configurations, V and W modes. Because the W mode has the highest mass resolution, it is used whenever the data are not signal-limited (Aiken et al., 2008).
During the campaign, the HR-ToF-AMS operated in a cycle of 3 modes every 4 min, including: 1 min V-mode to obtain the mass concentrations of the non-refractory species; 1 min W-mode to obtain high resolution mass spectral data; 1 min separate PToF (particle time-of-flight) mode to determine size distributions of species under the V-mode. Moreover, a series of calibrations for HR-TOF-AMS, including flow rate calibration, ionization efficiency calibration and particle size calibration were performed before the campaign (Allan et al., 2003; Jimenez et al., 2003). A default collection efficiency factor of 0.5 is recommended for the sulphate aerosols internally mixed with other inorganic species and oxidized organic species (Canagaratna et al., 2007; Middlebrook et al., 2012). In the cases of externally mixed aerosols, the particle size, composition, humidity and temperature of inlet might impact the CE values (Allan et al., 2004; Weimer et al., 2006). The EL (Dva) has been discussed as a factor impact the AMS quantitatively measures mass loadings. For particles falling within the vacuum aerodynamic size range for which the standard lens was designed (60–600 nm), EL(dva) is 100% (Jayne et al., 2000). For typical accumulation mode particles (∼50 to 1000 nm diameter), the EL is close to 100%. And the correlation between AMS data and other collocated instrumentation is within ±25%, even over long time periods and over a variety of chemical compositions (Takegawa et al., 2005; Canagaratna et al., 2007). In this case, it is reliable to determine the CE by comparing the AMS and other collocated instrumentation data. The TDMPS data have been used to verify the CE and correct AMS data by several previous works (Zhang et al., 2014, 2015b).
The TDMPS system includes two differential mobility analyzers and two condensation particle counters (TSI Model 3776 and 3772) was deployed to detect the size distributions of particles with mobility diameters ranging from 3 to 800 nm. The cutoff diameter for AMS is about 1um in vacuum aerodynamic diameter (dva), while the TDMPS system reports the mobility diameter (dm). Generally, the particle density can be considered as a link between dm and dva for spherical particles. Based on our collocated measurement of aerosol density, the average density in this campaign varied 1.5–1.7 g/cm3. In order to compare the same size range of particles to correct the CE, the number concentrations data of particles less than 600 nm in Dm (approximately equivalent of 1000 nm in Dva) were selected to calculate the mass concentration by the formula as follows:
In the formula, ρ is the average aerosol density, D represents electric mobility size. N D is the number concentration of particle whose electric mobility size equal to D (Shen et al., 2014). The calculated PM1 mass concentration was fitting with the mass concentration measured by AMS. As a result, collection efficiency factor of 0.38 was employed to correct the mass concentration of AMS.
Results and discussion
3.
Large increase of chemical components, fine aerosol particles and the role of meteorological factor during HPEs
3.1.
In this paper, we are actually interested in the feedback effect of meteorological conditions on the ‘explosive’ growth phase of PM in a few hours to 10 some hours after the formation of a pollution event with PM mass concentration exceeding the level of clean period (CP). In order to explore these, five HPEs were selected during autumn (from 31 October 2015 to 6 November 2015) and winter (from 17 December 2015 to 27 December 2015), respectively, when one can find five ‘explosive’ growth phases of PM during the early stage of pollution formation.
Autumn
3.1.1.
The mass concentrations with the change of particle size for organics, nitrate, sulphate, ammonium measured by HR-TOF-AMS during autumn, as well as number concentration of PM1 measured by TDMPS, and various meteorological factors were presented in Fig. 3. From 31 October to 6 November, the average NR-PM1 mass concentration was 32.3 μg/m3. The maximum concentration of 122.2 μg/m3 occurred on 4 November. The average PM1 mass concentrations were 69.5 μg/m3 during the autumn HPEs. The results show that the main composition of PM1 was OA, nitrate, sulphate, ammonium and chloride, and their average mass concentrations were 21.3, 25.1, 9.4, 12.3, and 1.2 μg/m3. In the autumn HPEs, the average median particle sizes of OA, nitrate, sulphate, ammonium and chloride were 472, 645, 531, 597 and 531 nm, respectively. The median particle size of OA was significantly lower than the other species, which indicated that OA might be fresher, or its growth was limited by hygroscopicity (Meier et al., 2009), oxidation, or mixing in the process of ageing so that its ageing degree was lower than those of nitrate, sulphate, and ammonium. The ageing of inorganic aerosol in transmission, touch and accumulation might be a major cause of its larger median particle size. The chloride was too less relative to other components, so this research did not discuss it in detail.
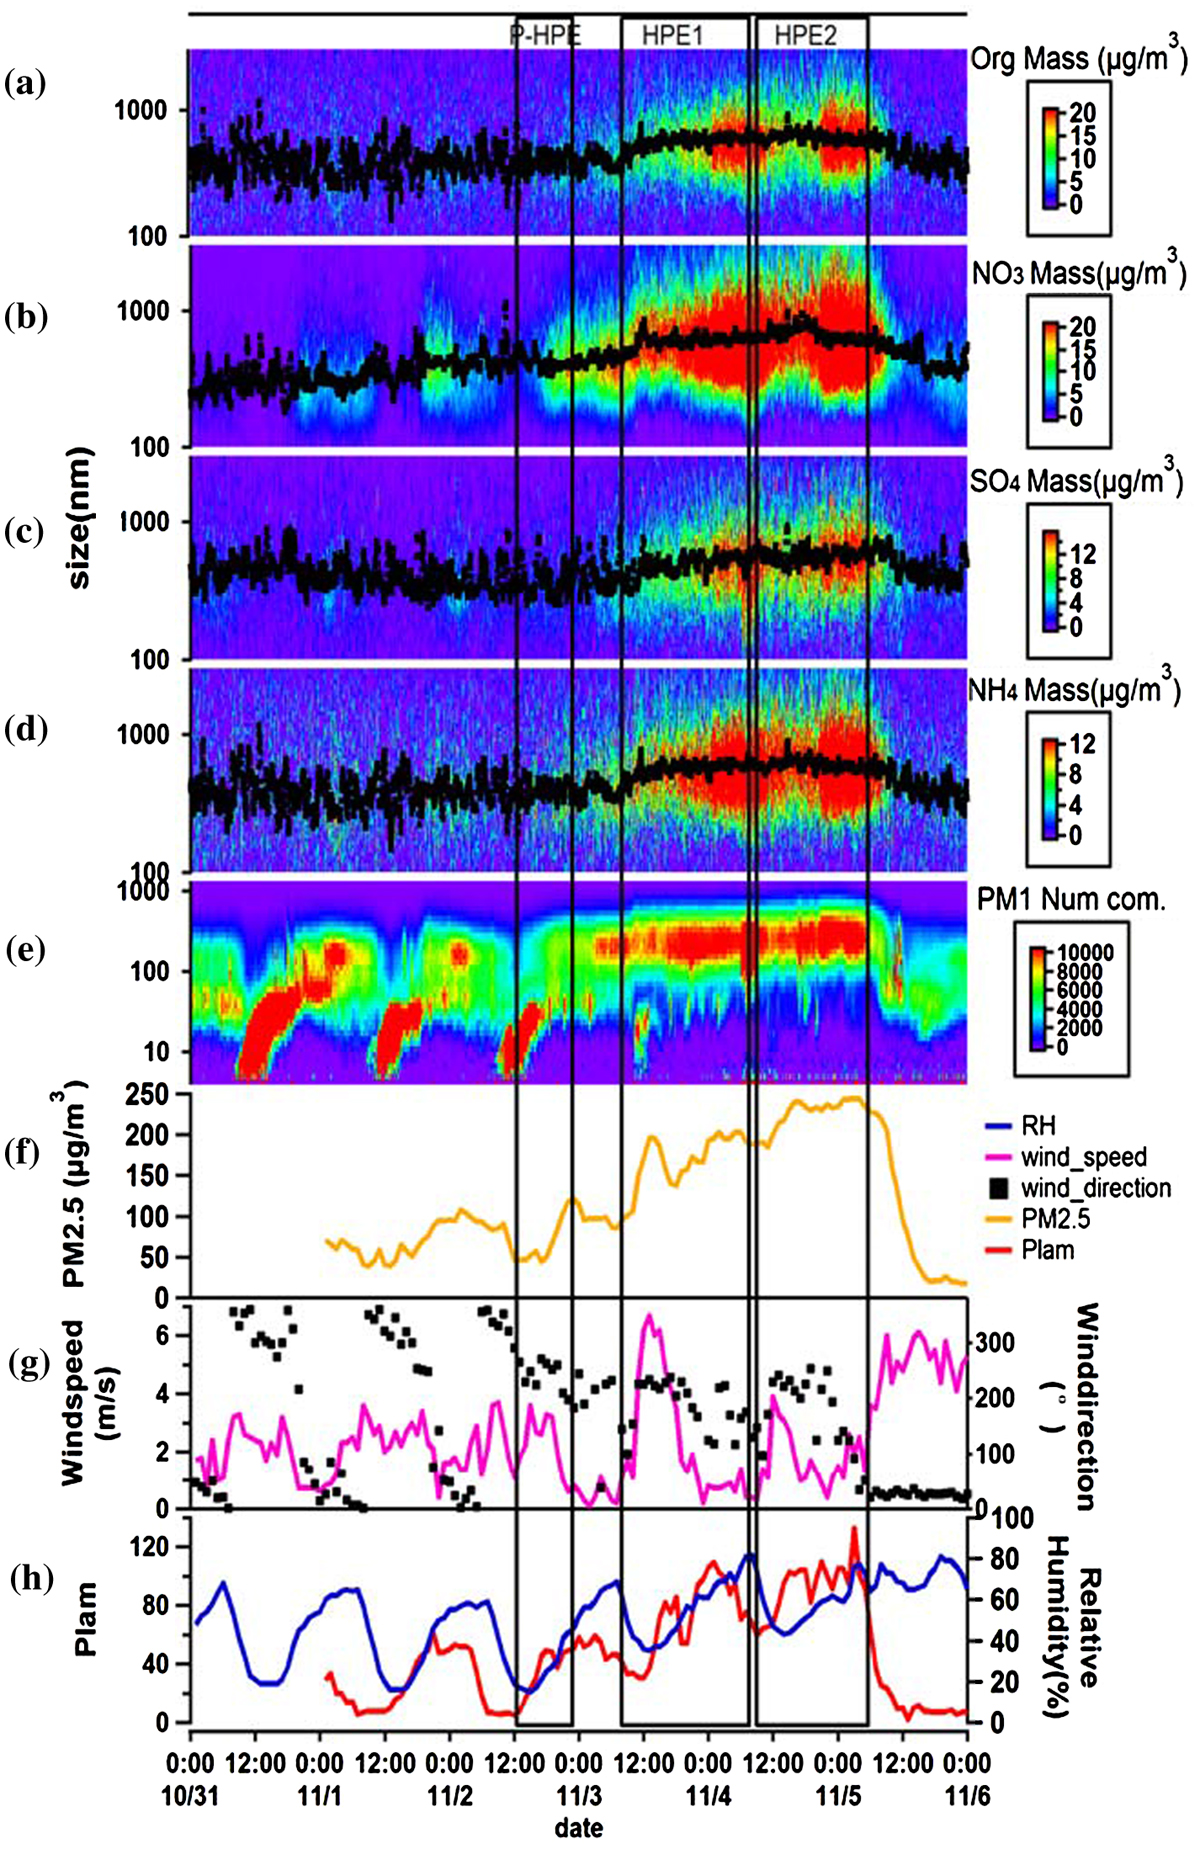
Fig. 3.
Time series of mass concentration with the change of size of organics (a), nitrate (b), sulphate (c), ammonium (d) measured by AMS and number concentration of PM1 measured by TDMPS (e) at SDZ regional GAW station, PM2.5 measured at Beijing Wanliu station (f), meteorological characteristics such as wind direction and speed (g), PLAM and relative humidity (h) during autumn.
Table 1 shows the changes of every component in the autumn HPEs. The average mass concentrations of organics, nitrate, sulphate, ammonium and PM1 were 5.7, 2.1, 0.97, 1.2 and 10.3 μg/m3, respectively, in clean periods, from 31 October to 2 November, when the mass concentration was less than 15 μg/m3, which is usually a lower mode value of mass concentration during the observation period, and is defined as the threshold of mass concentration for clean periods. Several new particle formation (NPF) events were observed in this study during the late autumn of 2015, however, only the NPF event started at 12:00 on 2 November was followed by two persistent HPEs. During HPEs, nitrate was the largest fraction of PM1 (36–38%), and the most significant increased component during HPEs relative to clean period (factors of 9.2 to 15, Table 1). The proportion of OA in PM1 was similar to that of nitrate, but the growth rate in HPE was much smaller, mainly because of the high concentration of OAs during cleaning period. Compared with the largest increase of nitrate, the similar increase was found for ammonium product, showing that a large amount of ammonium was formed by the combination of a large amount of in HPEs. We analysed the correlations among the and , . The results show that good correlation between and , and , inferring that NH4NO3 and (NH4)2SO4 are all the major components for ammonium product. But the correlation coefficient between the and was 0.995 and 0.993 during autumn and winter, respectively, which are higher than the correlation between the and , with correlation coefficient of 0.968 and 0.973 during autumn and winter. These results showed that ammonium was more likely in combination with nitrate instead of sulphate in this study. Moreover, a previous study showed that higher RH may enhance NH4NO3 generation via aqueous-phase processes (Li et al., 2014). The average RH during autumn HPEs was 85%, much higher than clean period (44%), which may lead to more NH4NO3 in pollution. Although the neutralization of acidic sulphate is favoured over the formation of ammonium nitrate, but due to the significant reduction of SO2 emissions by power plant desulphurization since 2002 in China (Cao et al., 2010). In the presence of and lack of , ammonium nitrate was the largest fraction of PM1 in this study. Less ammonium sulphate can lead to more ammonium nitrate being formed due to sufficient NH3 left. Generally, ammonium nitrate is formed in areas characterized by high NH3 and HNO3 concentrations and low temperatures (Pathak et al., 2004).
Table 1.
Mass concentration and increased percentage of chemical components of PM1 during autumn HPEs.
The key here is using one of the comprehensive meteorological index (PLAM), which mainly indicates the regional atmospheric stability and air condensation ability, to estimate the relative contribution of meteorological factor on the increasing PM2.5 in the first several hours when the pollution is formed. The PLAM was established based on a set of weather sensitive parameters such as air pressure, air temperature, winds, relative humidity, evaporability, stability, and effective parameter associated with the contribution of air pollution, respectively; and the PLAM was proved to be able to quantitatively distinguish the relative contribution of meteorological factor in the total concentration change of PM (Zhang et al., 2009).
The PLAM index has been developed to diagnose the air quality in Beijing and other cities derived from a correlation between PM2.5 and relevant weather elements based on the data between 2007 and 2008 (Wang et al., 2013a). Because significant correlations exist between PM2.5 concentrations and the variation in the sensitive meteorological parameters such as atmospheric condensation function, adaptive weight parameter β in both summer and winter, which indicate the meteorological conditions that affect the concentration of PM2.5. Fig. 4 displays the correlation analysis between the 24-hforecast of PLAM over the 731 days from 1 January 2007 to the 31 December 2008 and the PM2.5 observations (indicated by the solid dotted line) in Beijing (Wang et al., 2013a, 2013b). There is also a linear correlation, indicated that it is meaningful for analysing, diagnosing and forecasting the impact of meteorological conditions on AQ based on PM2.5. The rise of PM2.5 due to meteorological factors can be expressed by the magnitude of the rise of PLAM (Zhang et al., 2015a)
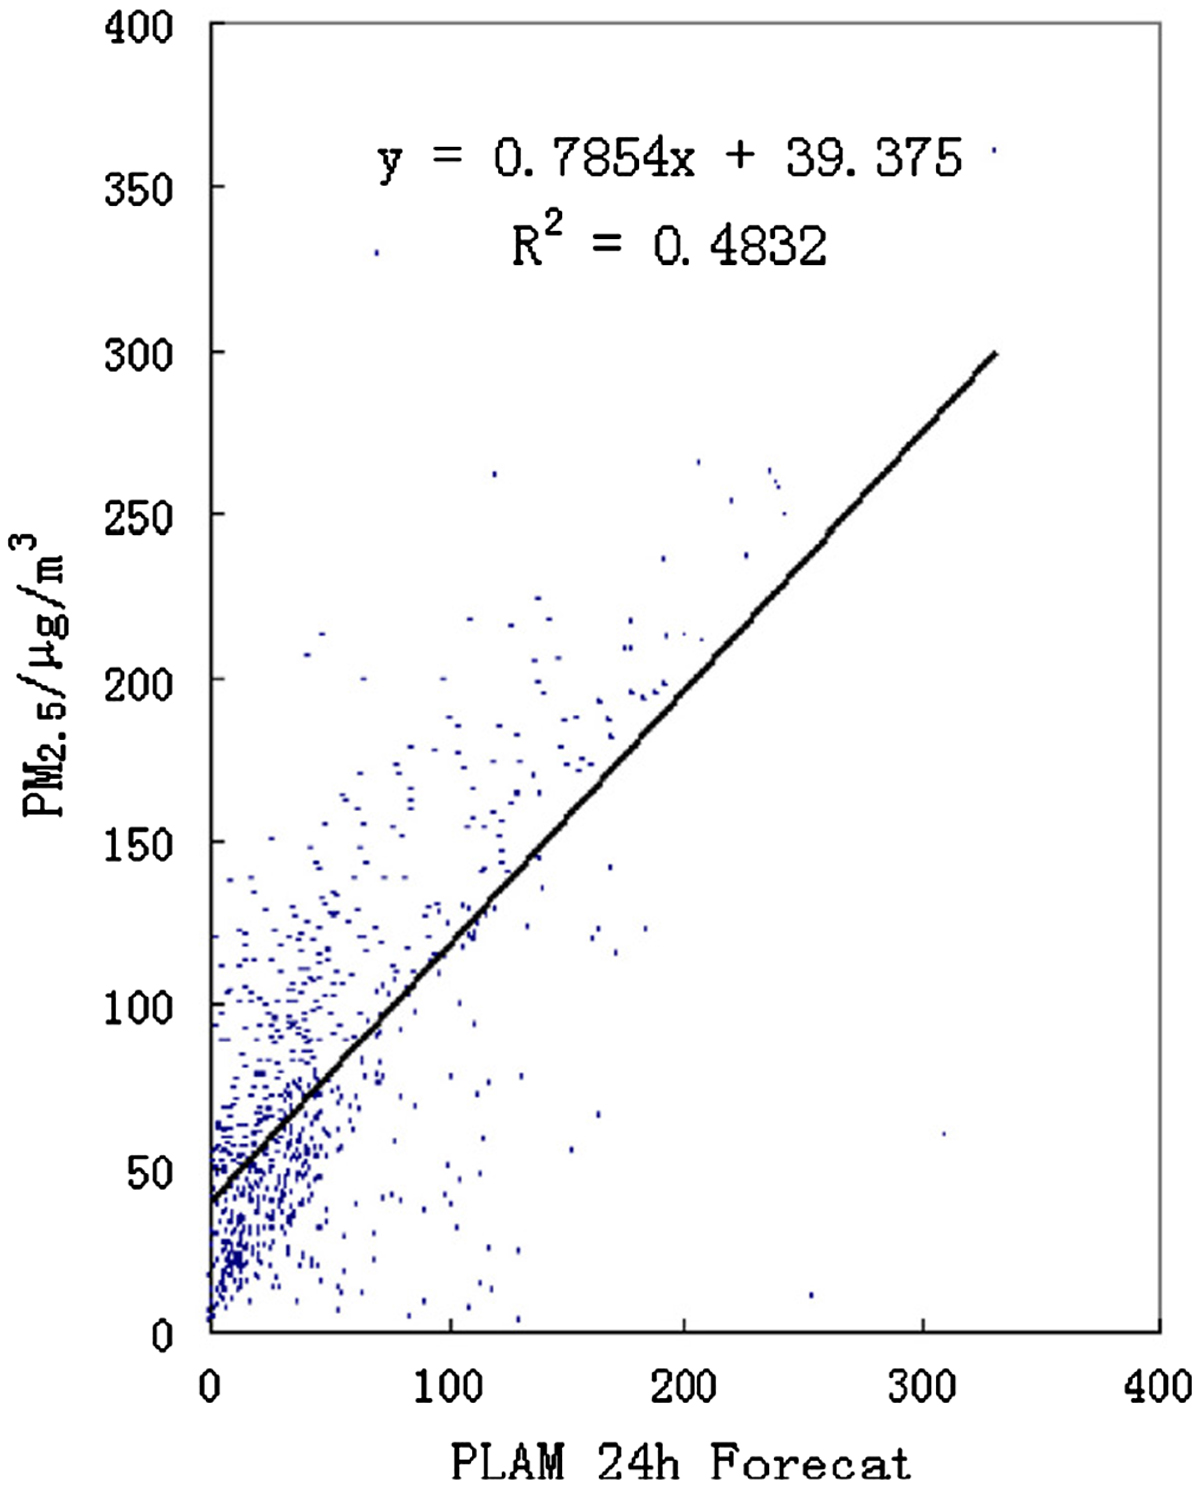
Fig. 4.
Correlation between PLAM index 24-h forecast and PM2.5 during 2007–2008 (Wang et al., 2013a).
PLAM index started its rise from a very low value at ~12:00 of 2 November to its first higher platform value of 60 in several hours till the early morning of 3 November, which was accompanied by the emergence of small south wind, climbing RH, as well as PM2.5 mass concentrations at Beijing urban area increased from 40 to ~120 μg/m3. At the same time, this NPF event was basically completed (Maso et al., 2005). We called this period as primary stage of pollution formation (P-HPE or NPF in Fig. 3).
After PM2.5 pollution was formed and maintained at a high level for some time, still associating with southerly wind (Fig. 3), one can find that RH was climbing towards its next summit and the atmosphere was even more stable with value of PLAM rose from 50 to its peak value of 100, which had exceeded a threshold value of 80 of PLAM leading to have more secondary aerosol formed to have visibility smaller than 10 km, and normally corresponding to heavy haze episode in BIV (Zhang et al., 2013a). We called this stage as HPE1. The HPE1 was from 9 am of 3 November to 10 am of 4 November. Since the PLAM values almost have a linear relationship with the mass concentrations of PM, the increased per cent of PLAM was 100% (from 50 to 100), while the observed total uplift percentage of PM2.5 mass was 122% (from 90 to 200) during these several hours period of HPE1, which implicating that about 80% of this PM mass increase during HPE1 can be considered as a positive feedback effect that come from even more stable atmosphere that derived from the interaction between formed pollution and the boundary layer (BL) structure in the lower atmosphere; Since the rise of PLAM also means that the condensation rate of water vapour will increase, more water vapour will condense on the surface of the aerosol to increase liquid water content, which will increase the formation of the secondary aerosol through the liquid phase reaction under the favourable meteorological condition provided by this feedback effect. The remaining ~20% of the increase can be attributable to the more chemical conversion. What’s the new mechanism of chemical conversion to form more secondary aerosol is worth further study.
Such a positive feedback effect of atmosphere on the PM pollution caused by the interaction of the pollution and the BL occurred again during the subsequent period, called HPE2 in Fig. 3. It is also a period of about half a day, stared from 10 am of 4 November to 8 am of 5 November. During this episode, PLAM rose from 70 to its highest value of 100, increasing ~40%, and PM2.5 increased from 180 to 250 with similar percentage.
Winter
3.1.2.
The mass concentrations with the change of particle size for organics, nitrate, sulphate, ammonium measured by AMS during winter, as well as number concentration of PM1 measured by TDMPS, and various meteorological factors were presented in Fig. 5. From 17 December to 27 December, the average NR-PM1 mass concentration was 44.2 μg/m3. The maximum concentration of 192.8 μg/m3 occurred on 25 December. The average PM1 mass concentrations were 72.5 μg/m3 during the winter HPEs. The average mass concentration of OA, nitrate, sulphate, ammonium and chloride were 21.3, 25.1, 9.4, 12.3 and 1.2 μg/m3. In the winter HPEs, the average median particle sizes of organic, nitrate, sulphate, ammonium and chloride particles were 569, 629, 731, 598 and 629 nm, respectively. Compared with autumn, the winter average particle size of OA and sulphate was larger, indicating that the secondary organic and sulphate aerosols were more aged than the other particles. The nitrate particle size reduced because the formation of nitrate particles is associated with the condition of low temperature and humidity.
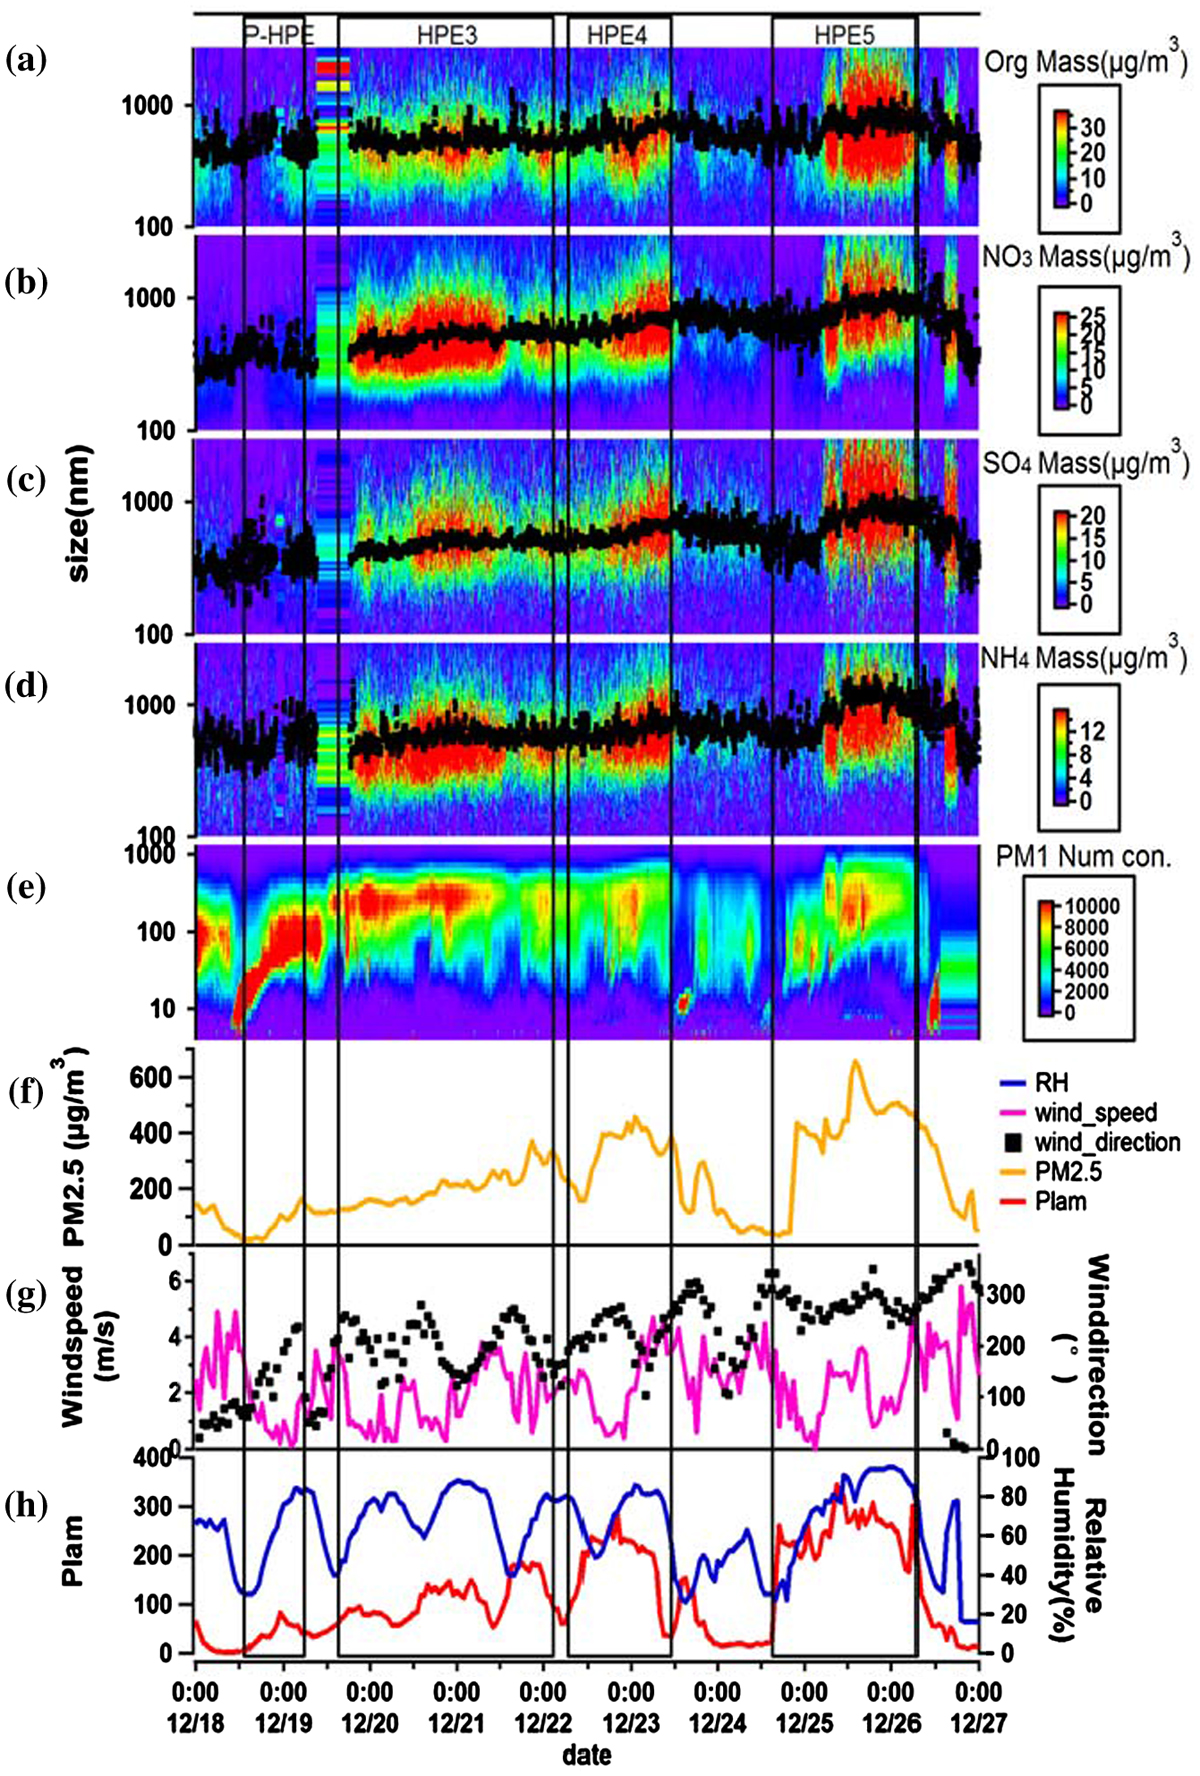
Fig. 5.
Time series of mass concentration with the change of size of organics (a), nitrate (b), sulphate (c), ammonium (d) measured by AMS and number concentration of PM1 measured by TDMPS (e) at SDZ regional GAW station, PM2.5 measured at Beijing Wanliu station (f), meteorological characteristics such as wind direction and speed (g), PLAM and relative humidity (h) during winter.
Table 2 shows the changes of every component in the winter HPEs. During the wintertime in this campaign, the average mass concentrations of organics, nitrate, sulphate, ammonium and PM1 were 4.3, 0.90, 1.1, 0.68 and 7.1 μg/m3, respectively, in clean periods, from 16 December and 18 December. After a NPF event ended in the early hours of 19 December 2015, three HPEs (called HPE3, HPE4 and HPE5) were observed thereafter (Fig. 5). Similar to autumn, nitrate was also the most significant increase component during HPEs relative to clean period (factors of 19 to 24, Table 2), and ammonium had similar rise amplitude also. But the difference is that organics was the largest fraction of PM1 (34–42%).
Table 2.
Mass concentration and increased percentage of chemical components of PM1 during winter HPEs.
During the three HPEs in wintertime (Fig. 5), one can see the continuous accumulation and becoming more serious aerosol pollution processes, and their interactions with meteorological condition (Fig. 5). From 2 pm of 18 December to 6 am of 19 December (marked as P-HPE in Fig. 5), a NPF event occurred and eventually laid the foundation of particle for the subsequent constantly aggravated pollution episodes. Along with the PLAM started its rise from a very low value to near its threshold value of 80 in several hours during and after the NPF event, the mass concentration of PM2.5 also increased to 150 μg/m3 and maintain at this level, which led to the primary stage of pollution formation. Within the thereafter HPE3, from 12 am of 19 December to 9 pm of 21 December, the atmosphere was becoming more and more stable alone with the emergence and aggravation of pollution. This can be found that the PLAM value rose from the initial around 60 to its first high value of 170 with ~180% increase, with synchronously increase ~220% of PM2.5 mass concentration at Beijing urban area (PM2.5 mass rose from the initial ~110 μg/m3 and climbing to the first high value of about 350 μg/m3), which implicating that still ~80% of this PM mass increase during HPE3 can be considered as a positive feedback effect that come from interaction between formed pollution and the lower atmosphere. And the remaining ~20% of the increase can be attributed to the role of chemical mechanisms in this stage in BIV. This result is similar to those during late autumn previous in this paper.
In other HPEs (HPE4, HPE5) in wintertime, the estimates of the meteorological contribution on the increasing PM2.5 mass were also around 80%. In order to provide further evidence to support the value of 80% of increased PM2.5 be attributable to the contribution from meteorological factors in accordance with the way of statistical analysis. The correlation between increase of PLAM and PM2.5 during all HPEs is presented in Fig. 6. The correlation coefficient of 0.82 between the increased PM2.5 and PLAM can be considered as the evidence to support the claim of PLAM explaining 80% of PM2.5 increase above.
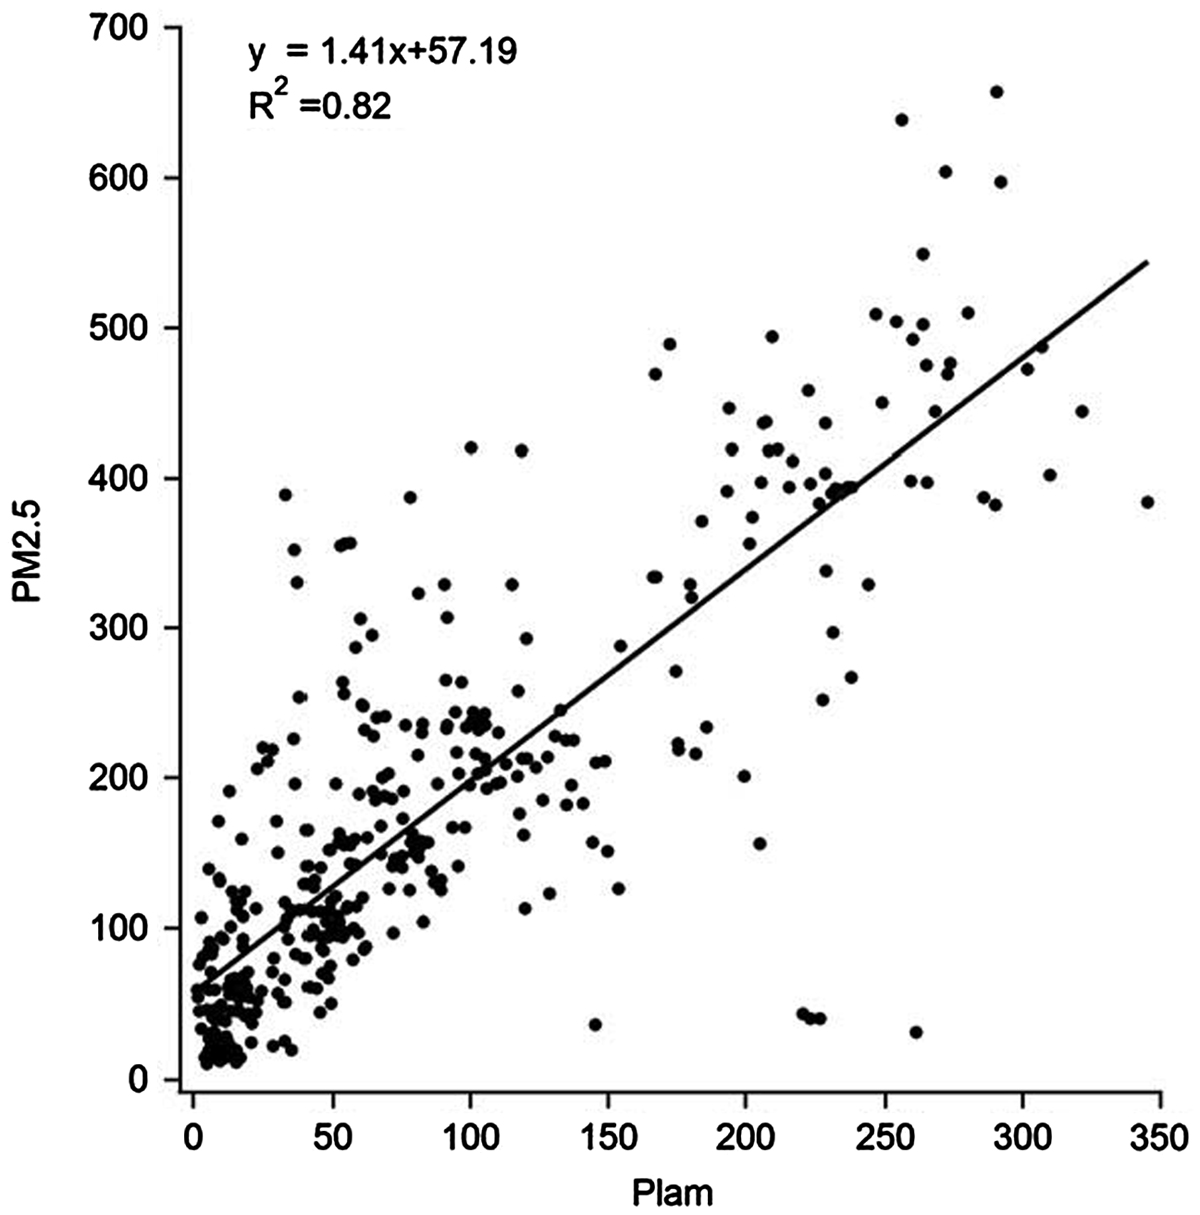
Fig. 6.
Correlation between the PLAM and PM2.5 during all HPEs in autumn and winter of 2015.
An interesting phenomenon is that southerly wind dominated in the polluted episodes (Fig. 5), exhibiting again the pollutants from southern part of BIV had obvious contribution to aerosol pollution in Beijing area. However, during HPE5 (see in Fig. 2), the prevailing wind is westerly wind that is also able to bring pollutants to the BIV area, the source will be discussed in details later.
Sources of pollutants
3.2.
To explore the regional sources that influence on PM1 loading and composition during the HPEs, we used the Traject plugin of Meteoinfo (Wang et al., 2009) to produce back trajectories of air masses arriving in the SDZ area. We calculated 24-h back trajectories starting at the SDZ ground level (117.07°E, 40.39°N, 287 m a.s.l) and marked the trajectories in colour from shallow to deep according to the time sequence. This allows us to obtain air mass trajectories before, during and after pollution episodes.
The main source of anthropogenic SO2 is coal combustion, which is mainly from the stationary sources. NOx is mainly from the high temperature combustion of motor vehicles using either gasoline or diesel fuel, but also from coal combustion. Based on Chinese emissions inventory developed by Tsinghua University in 2010 (the Multi-resolution Emissions Inventory for China, MEIC) (He and Zhang, 2012), the ratios of NOx/SO2 from stationary and mobile sources were 0.98 and 28.7, respectively. NOx and SO2 are the major precursors of the secondary inorganic components and . So the / ratio usually can be used to roughly determine the stationary and mobile sources.
In the autumn clean period that before the start of pollution episodes, main air masses came from north-west region in Inner Mongolia, containing a large proportion of organics with lower / ratio of 2.3 (Fig. 1). During the HPEs (HPE1 and HPE2), the air mass was mainly from the south of the station with increased / ratio of 3.6, showing the increased nitrate from southern Beijing and Hebei province. The ratio of / was 2.3 on clean days and 3.6 on the HPEs, both of which were close to the ratio of NOx/SO2 emitted from stationary coal combustion sources. According to the result, the contribution of stationary sources such as coal combustion, biomass burning and industry emissions was around 80–90% in the autumn HPEs. Therefore, our results suggest that coal combustion still was the main source of the increased NOx and nitrate during the HPEs at SDZ. Comparing the nitrate mass in PM10 among the stations within BIV in 2013 (Zhang et al., 2015a), the nitrate concentrations in urban Beijing (~20 μg/m3) were not higher than those in other stations (19–22 μg/m3 for Zhengzhou, Gucheng, and XiAn). However, the contribution from motor vehicle emission is the largest in Beijing (NBS-Beijing, 2013). This result shows that nitrate over the region does not only originate from motor vehicle emission but also from coal combustion. Even in BIV, about 28% of the emission amount of NOx can still be attributed to coal combustion. In other areas in China, about 50% of nitrate mass can be attributed to coal combustion (Cao et al., 2010). Globally, NOx is mainly derived from natural sources (Miyazaki et al., 2012). However, in urban areas, NOx mainly comes from anthropogenic activities such as oil and coal combustion. Given the rapid development of China’s economy in recent years, the amount of gasoline and diesel oil consumption has significantly increased over the past few years (Lu et al., 2011), even if the Chinese government started promoting the ‘low nitrogen combustion technology’ for denaturalization in power generation since 2012. The installation capacity reached only around 70% until the middle of 2013, except in BIV, which can probably explain the high nitrate concentration in this study. In addition, the highest hygroscopic of nitrate (Che et al., 2016) can be explained by the large increase in nitrate in the HPEs at this study. During the ‘after pollution’ stage (Fig. 1), air mass came mainly from the north-east of the station with fewer pollutants associated.
Similar to autumn, the clean air masses were mainly from the north of the station, especially from the north-west, before and after pollutions in winter (Fig. 2), associated with the averaged / ratios of 1.35. During the HPEs, the polluted air masses were mainly from the south of the station, especially from the southwest. The averaged / ratio was 1.82. Compared with autumn, the contribution of stationary sources was higher, more than 90%, especially the coal combustion. In addition, the biggest difference with autumn is that there is a part of polluted air masses coming from the west of the station, associated with relative higher mass of sulphate, nitrate and OA, and the 0.91 of / ratio value. This exhibits that the westerly wind from central Inner Mongolia and north Shanxi can also carry air pollutants mostly derived from coal combustion, contributing to the heavy pollution in the northern BIV area in winter, resulted in higher sulphate, nitrate and OA mass.
Conclusions
4.
In this study, we conducted an investigation of size-resolved chemical components of PM1 from a site in northern Beijing area during HPEs in autumn and winter of 2015. The HPEs were always formed under relatively stable weather conditions with a lower speed and southerly wind and started climbing relative humidity; once the formation of pollution, it will further stabilize the atmosphere, increase condensation rate of water vapour on the surface of the aerosol to have more secondary aerosol formation through the liquid phase reaction, and feedback to a substantial increase in the concentration of fine aerosol particles. This feedback effect of meteorological conditions is considered to contribute approximately 80% to the ‘explosive’ increase of aerosol masses within the first several hours to 10 hours after the formation of aerosol pollution.
Nitrate was the most significantly increased component during HPEs relative to clean period. The mass concentration of nitrate was ~9.2 to 15 times higher during HPEs in autumn, and the rise was even higher in wintertime HPEs with factors of 19–24. Nitrate and OAs were the largest fractions of PM1 during HPEs in autumn and winter, respectively. Ammonium showed a similar percentage increase with nitrate during HPEs whether in winter or autumn, exhibiting that a large amount of ammonium was formed by the combination of in HPEs.
At the northern site of BIV, regional transport with air masses coming from the urbanized region of Jing (Beijing)–Jin (Tianjin)–Ji (alias of Hebei province) and its nearby surrounding regions (3JNS) exhibited a major contribution to nitrate, sulphate and OA, especially in autumn and winter. In winter, the westerly wind from central Inner Mongolia and northern Shanxi province can also carry air pollutants that have an influence on the PM1 mass in BIV area. Coal-combustion was still a major source of these pollutants.
Disclosure statement
No potential conflict of interest was reported by the authors.
Funding
This research was supported by National Key Project of MOST [grant number 2016YFC0203306] and Specific Team Fund of the Jiangsu Collaborative Innovation Center for Climate Change.
Acknowledgments
We sincerely thank the support from staffs from Shangdianzi station of CAWNET, CMA.