Have a personal or library account? Click to login
Characterization of fine particles during the 2014 Asia-Pacific economic cooperation summit: Number concentration, size distribution and sources Cover

Characterization of fine particles during the 2014 Asia-Pacific economic cooperation summit: Number concentration, size distribution and sources

Open Access
|Jan 2017

Figures & Tables

Fig. 1.

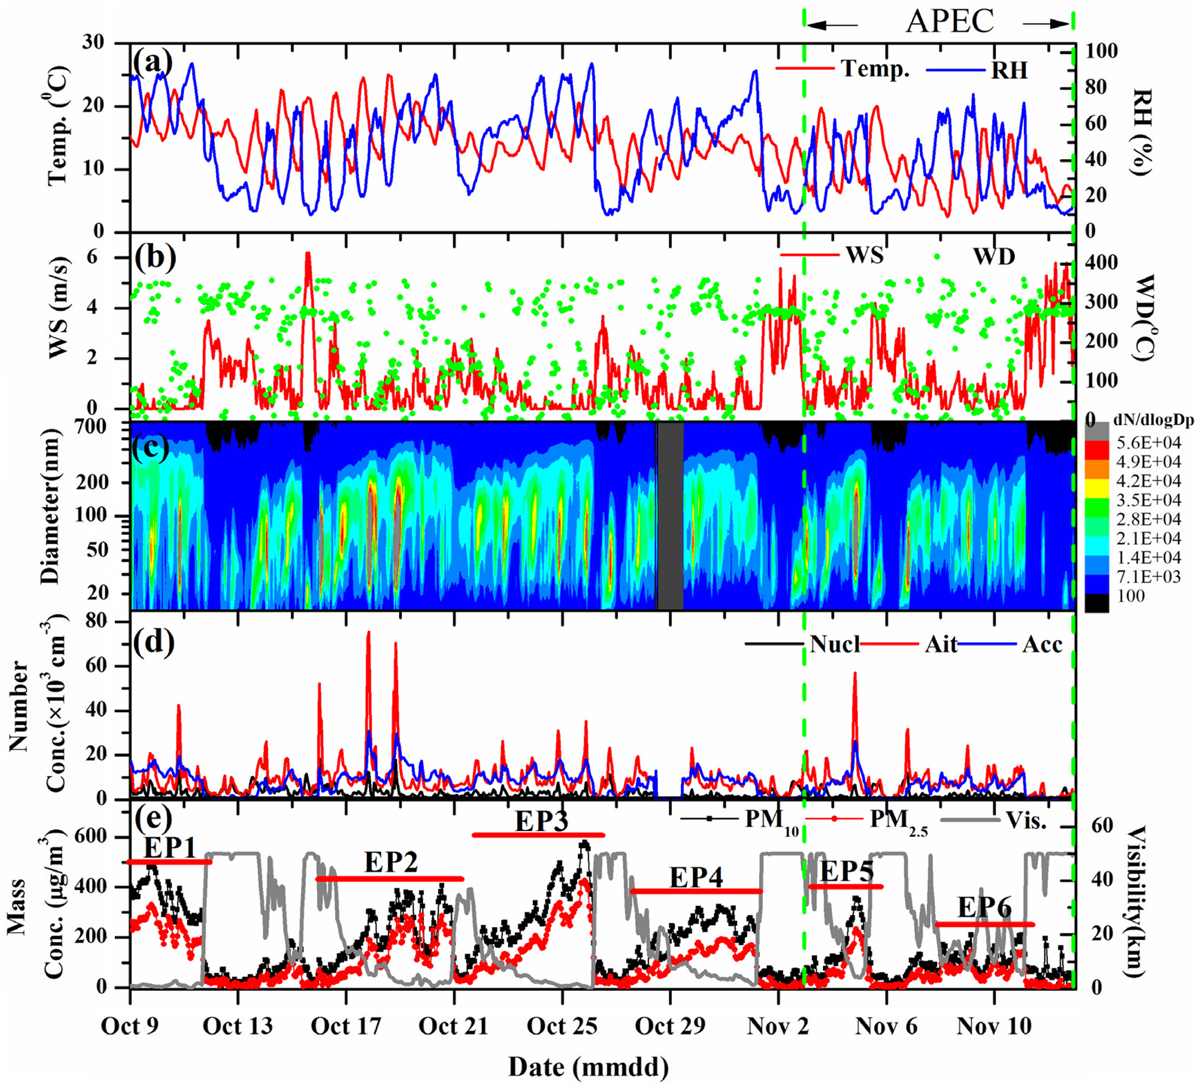
The time series of (a) temperature (T) and relative humidity (RH), (b) wind speed (WS) and wind direction (WD), (c)evolution of PNSD and mean diameter (circles) of the dominant mode, (d) particle number concentrations in different modes and (e) the mass concentration of PM2.5 and PM10 and visibility during the measurement period. The APEC summit period and six pollution episodes (Ep1–Ep6) are marked for further discussion.
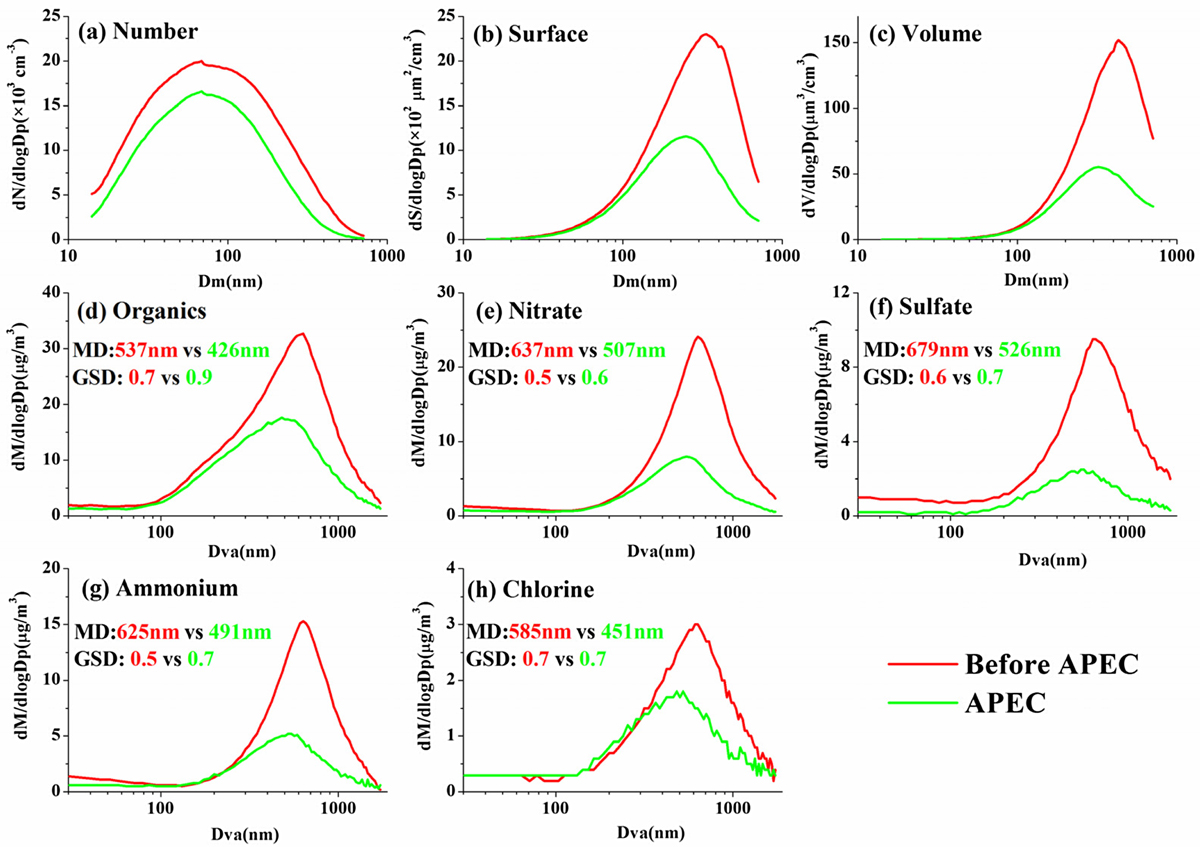
Fig. 2.

Average particle (a) number, (b) surface, (c) volume size distribution and (d–h) average mass size distributions of chemical components in PM1 measured before and during the APEC summit. The median diameters (MD) and GSD for the mass size distributions of chemical components in PM1 are also shown.

Table 1.

Summary of average meteorological parameters, particle matter and gaseous species, PNC in different modes, PSC, particle volume concentration (PVC) and mass concentrations of PM1 species for the entire study, before and during APEC, and also the change percentages during APEC.
Entire studyBefore APECAPECChange (%)Meteorological parametersT (°C)13.3 14.7 9.7 34.1 RH (%)45.5 49.8 34.7 30.3 PM (μg/m 3 ) & Gaseous species (ppb)PM10169.3196.1102.347.8 PM2.599.2117.653.354.7 NO35.4 39.0 26.3 32.5 NO235.9 39.6 26.5 33.1 SO25.3 5.6 4.6 17.3 O316.1 15.7 17.3 –10.6Particle number, surface & volume concentrationsNucleation (×103 cm−3)3.1 3.3 2.4 29.5 Aitken(×103 cm−3)9.0 9.6 7.7 19.1 Accumulation(×103 cm−3)7.5 8.3 5.4 35.9 Total PNC (×103 cm−3)19.0 20.4 15.5 24.0 Total PSC((×102 μm2 cm−3)12.9 15.0 7.7 48.7 Total PVC(μm3 cm−3)60.5 72.0 31.6 56.1 Chemical species in PM1(μg/m 3 )Organics28.4 32.7 18.2 44.3 Nitrate16.6 20.7 7.1 65.7 Sulphate8.6 10.9 3.0 72.2 Ammonium8.0 10.0 3.3 67.0 Chlorine2.3 2.6 1.5 41.0 BC5.3 6.0 3.7 37.3
Fig. 3.

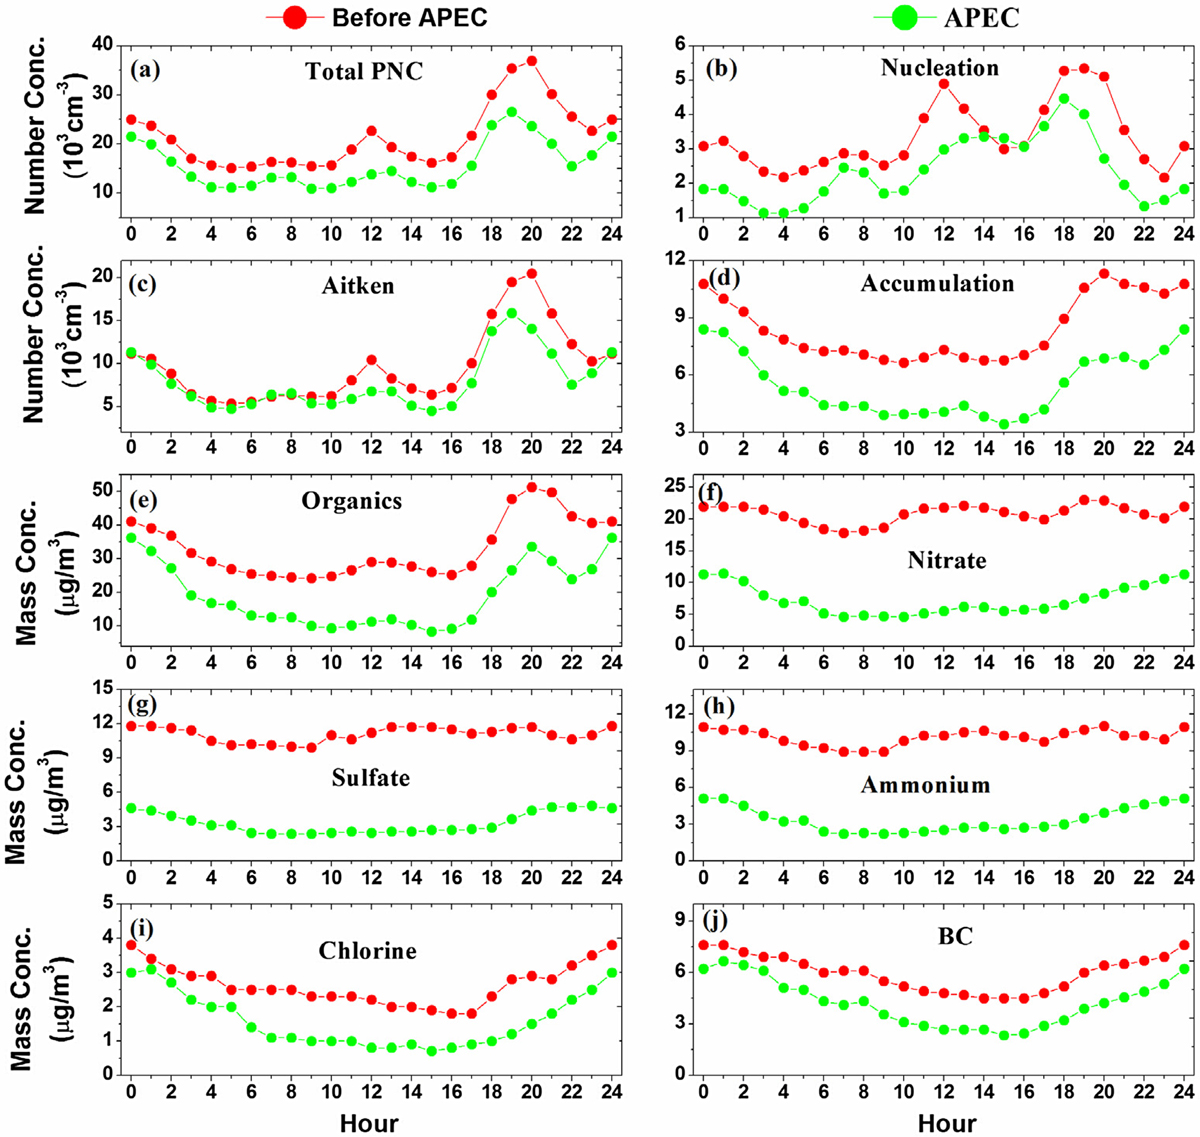
Diurnal profiles of the total PNC, PNC in different modes and mass concentrations of PM1 species measured before and during the APEC summit.

Table 2.

The PMF revolved factors for particle number concentration (PNC) for the entire study, before and during APEC, and also the change percentages during APEC.
Factors (×103 cm−3)Entire studyBefore APECAPECChange (%)Traffic 12.1 2.4 1.4 40.2 Traffic 26.9 7.4 5.9 20.5 Traffic 30.9 1.0 0.6 36.7 Cooking2.1 2.2 2.0 8.0 Combustion 14.6 4.7 4.5 4.3 Combustion 21.2 1.6 0.3 82.7 Secondary aerosol0.2 0.2 0.2 −5.9 Regional aerosol1.5 1.8 0.6 69.7
Fig. 4.

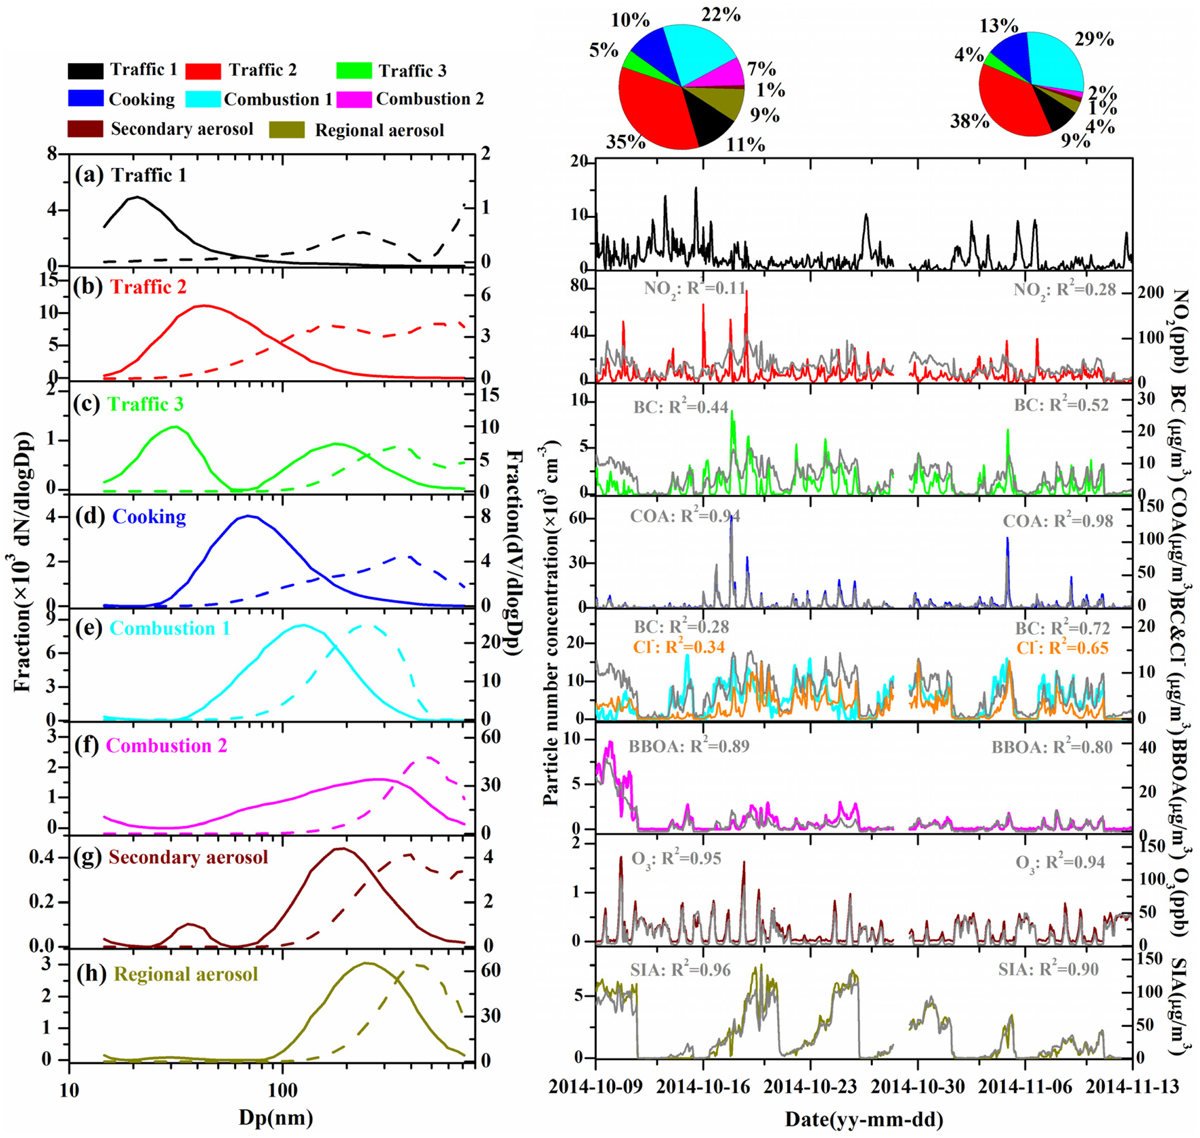
Normalized feature profiles for particle number and volume size distribution (left panel) and time series (right panel) of eight PNC factors resolved by the PMF. Also shown in the right panel are the time series of external tracers including black carbon (BC), Chlorine (Cl), O3, SIA (sulphate + nitrate + ammonium) and two organic aerosol components (cooking (COA) and (BBOA)). The two pie charts show the average source composition of PNC measured before and during the APEC summit, respectively. The correlation coefficients between PNC factors and external tracers measured before and during APEC are also shown in the figure.
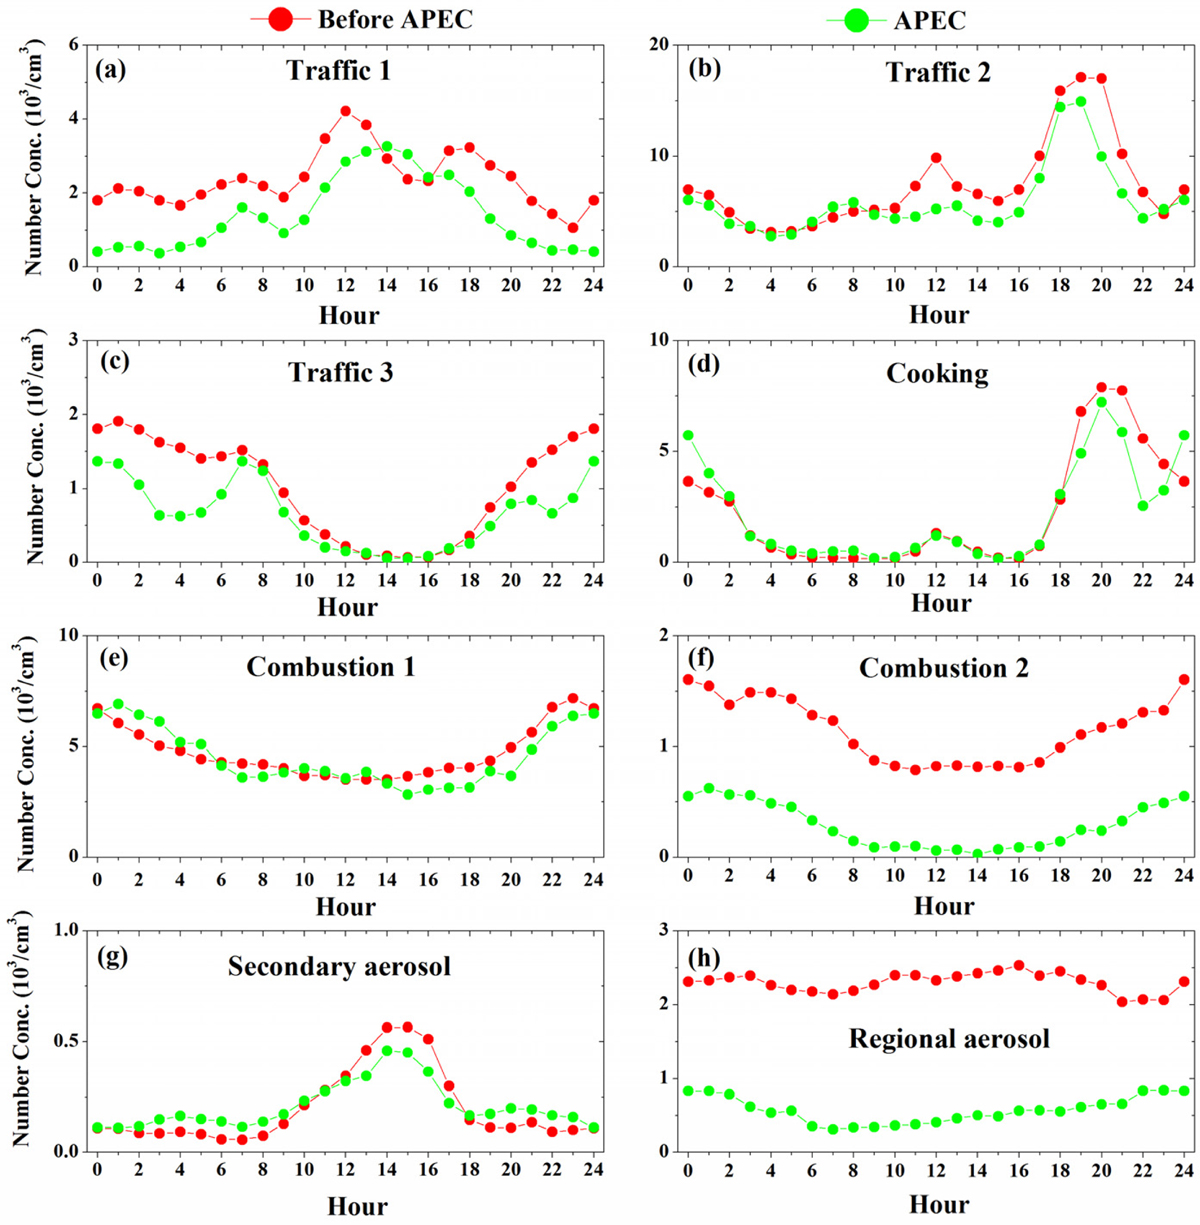
Fig. 5.

Diurnal profiles of the number concentrations of PNC factors measured before and during the APEC summit.

Table 3.

Correlation coefficients between PNC factors source profiles and external tracers.
Before APECAPECTraffic 1 vs. NO 0.11*0.41*Traffic 2 vs. NO20.36*0.60*Traffic 3 vs. BC0.440.52Cooking vs. COA0.940.98Combustion 1 vs. BC0.280.72Combustion 1 vs. Cl0.340.65Combustion 2 vs. BBOA0.890.80Secondary aerosol vs. O30.950.94Regional aerosol vs. SIA0.960.90

* Correlation coefficients were calculated only in the morning and evening rush hours.

Fig. 6.

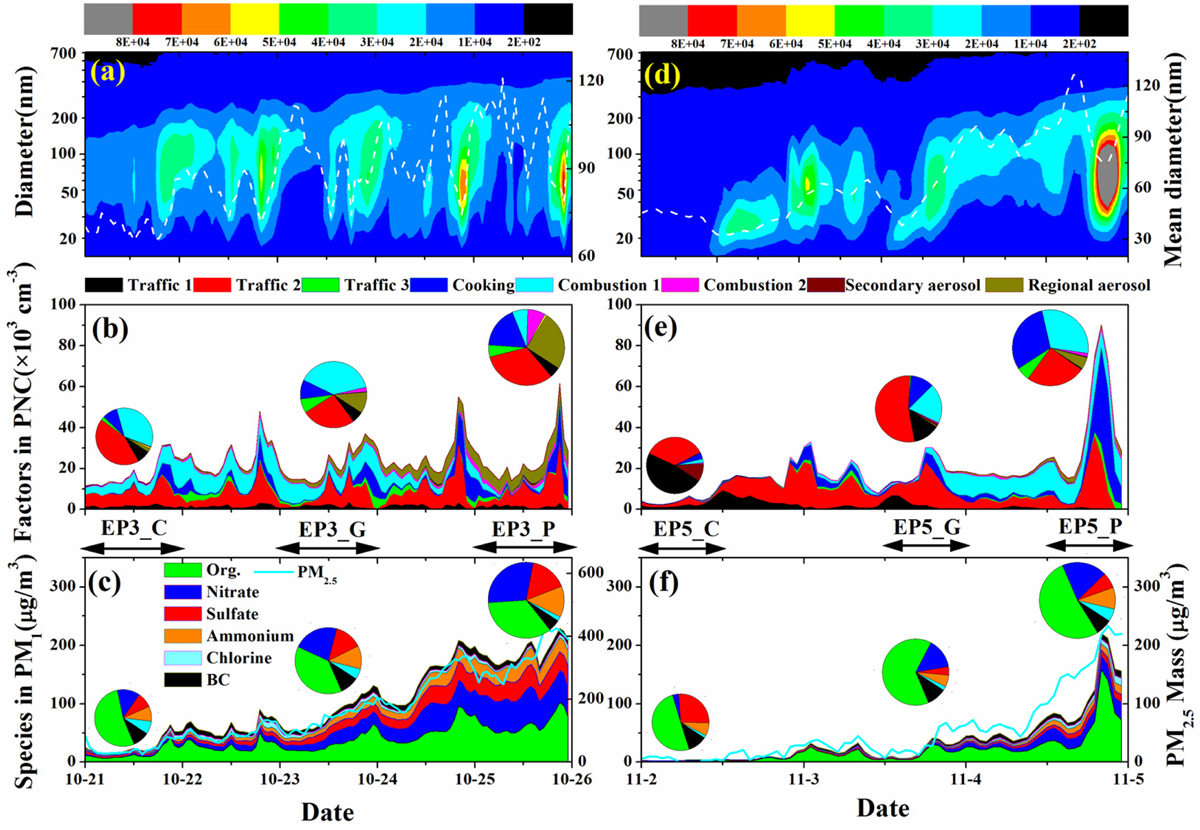
Temporal evolutions of (a, d) PNSD and mean diameter (white dashed curve), (b, e) particle number concentration (PNC) factors and (c, f) PM1 species during the pollution episodes on 21–25 October and 2–4 November. The pie charts show (b, e) the average source contribution of PNC and (c, f) the average chemical composition of PM1 for each stage.

Table 4.

The average number concentration of PNC factors and the average mass concentrations of PM1 species for each stage during pollution episodes before and during APEC (stages EP3_C, G, P, and EP5_C, G, P as marked in Fig. 6).
EP3_CEP3_GEP3_PEP5_CEP5_GEP5_PPNC Factors (×10 3  cm −3 )Traffic 11.3(8%)*1.2(6%)1.1(5%)47.8(48%)12.9(13%)0.5(0%)Traffic 27.5(43%)5.7(26%)7.9(32%)35.5(36%)53.5(53%)25.4(25%)Traffic 30.4(2%)1.5(7%)1.2(5%)0.2(0%)0.6(1%)5.8(6%)Cooking1.5(9%)2.0(9%)4.4(18%)3.5(4%)11.5(11%)30.6(31%)Combustion 16.1(35%)8.5(39%)1.6(7%)2.3(2%)19.2(19%)30.8(31%)Combustion 20.1(0%)0.5(2%)1.8(8%)0.6(1%)0.6(1%)1.5(1%)Secondary aerosol0.2(1%)0.0(0%)0.2(1%)10.0(10%)1.1(1%)0.3(0%)Regional aerosol0.4(2%)2.3(10%)6.2(25%)0.0(0%)0.6(1%)5.1(5%)Chemical species in PM1(μg/m 3 )Organics14.3(53%)30.9(38%)65.6(35%)1.6(50%)13.8(64%)62.9(52%)Nitrate3.5(13%)17.9(22%)55.0(29%)0.1(3%)3.2(15%)23.0(19%)Sulphate2.4(9%)10.9(14%)30.6(16%)0.9(27%)0.9(4%)8.1(7%)Ammonium2.3(8%)9.1(11%)25.0(13%)0.2(7%)1.2(6%)11.1(9%)Chlorine2.0(7%)4.1(5%)3.6(2%)0.0(1%)0.4(2%)6.5(5%)BC2.6(10%)7.5(9%)9.7(5%)0.3(11%)2.1(10%)8.3(7%)

* The source contribution of PNC factors and chemical composition of PM1 present in bracket.

Fig. 7.

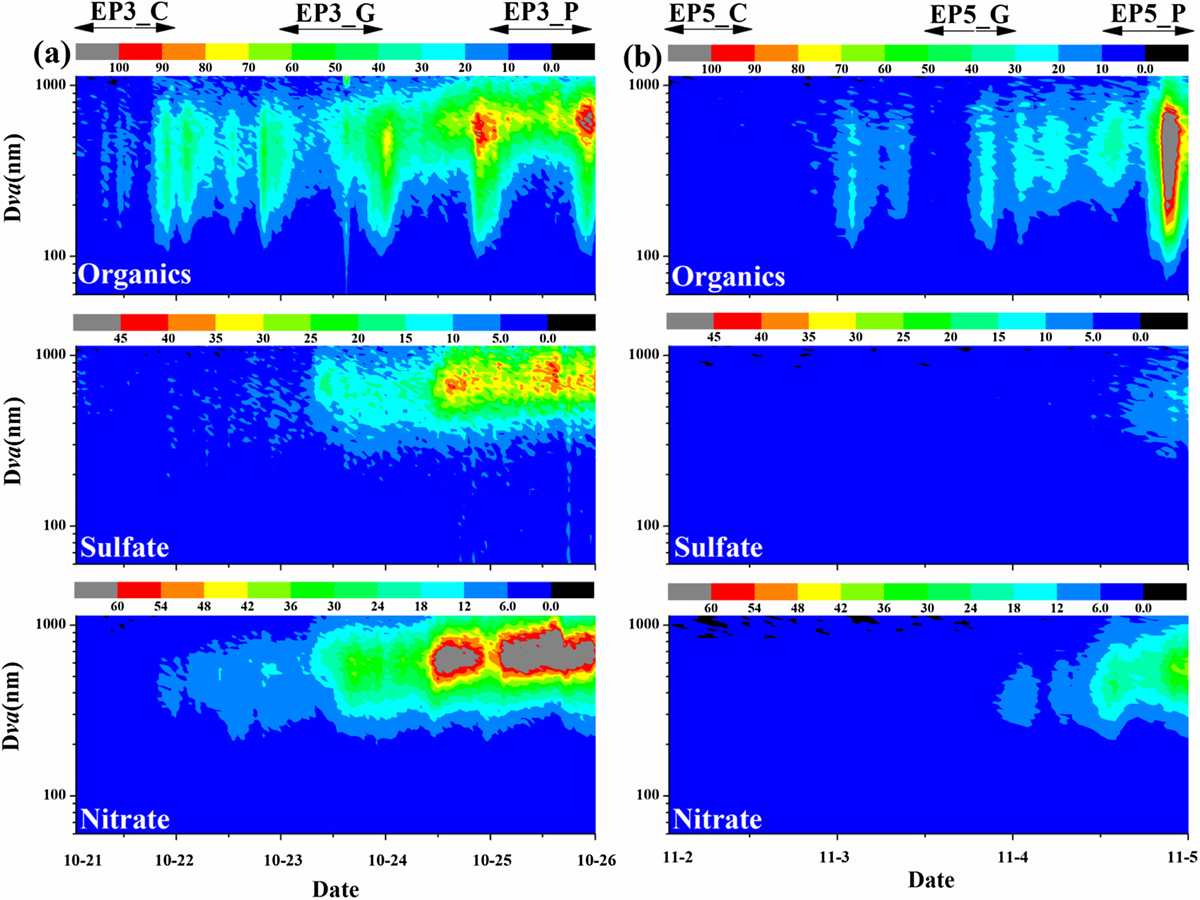
Evolution of size distributions of organics, sulphate and nitrate during the pollution episodes on (a) 21–25 October and (b) 2–4 November.
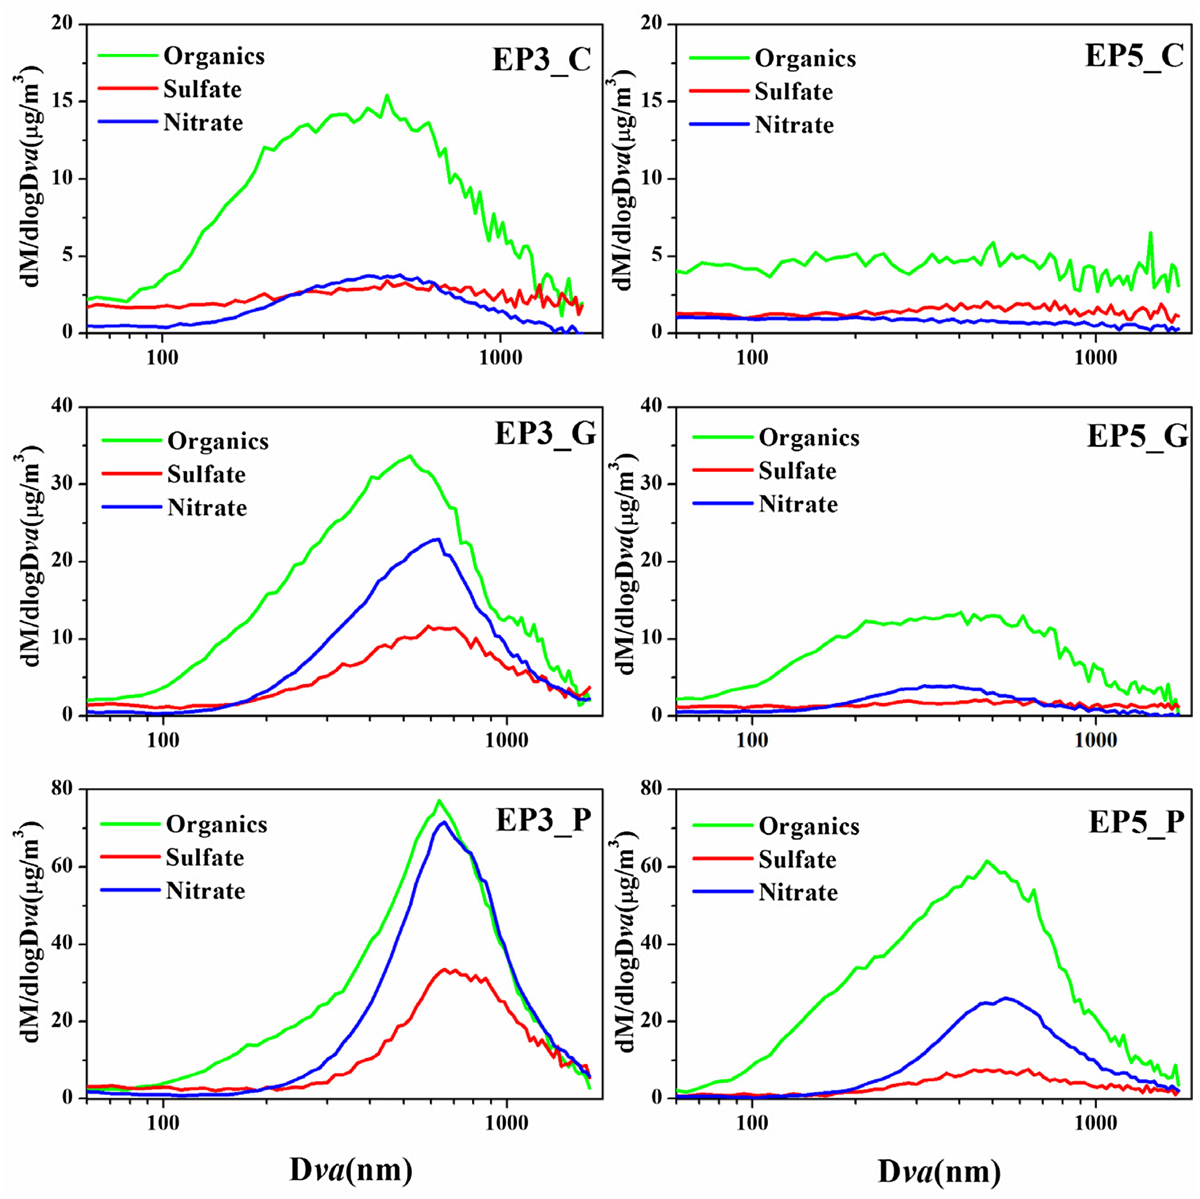
Fig. 8.

Average size distributions of particle chemical species (organics, sulphate and nitrate) for each stage during the pollution episodes as marked in Figs. 6 and 7.

Language: English
Page range: 1303228 - 1303228
Submitted on: Mar 28, 2016
Accepted on: Dec 16, 2016
Published on: Jan 1, 2017
Published by: Stockholm University Press
In partnership with: Paradigm Publishing Services

© 2017 Zirui Liu, Bo Hu, Junke Zhang, Jinyuan Xin, Fangkun Wu, Wenkang Gao, Mingxing Wang, Yuesi Wang, published by Stockholm University Press
This work is licensed under the Creative Commons Attribution 4.0 License.