
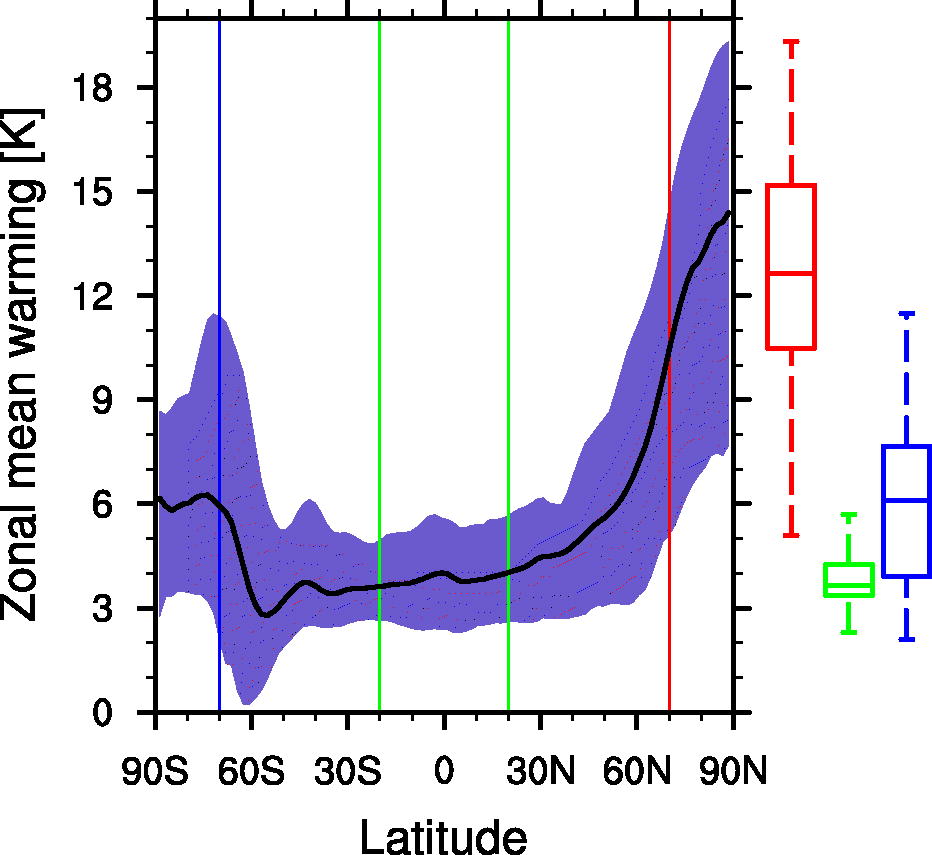
Fig. 1.
Multimodel zonal mean surface temperature change between the abrupt4xCO2 and the piControl experiment for the last 50 years of a 150-year simulation. The black line shows the multimodel average and the shaded area includes all individual model surface temperature changes. The box-whisker plots show the minimum, the 25th percentile, the median, the percentile and the maximum of surface temperature change of all models for the Arctic (70–90° N) [red], the Tropics (20° S - 20° N) [green] and Antarctica (70-90° S) [blue], respectively.
Table 1.
Model and institute name of the 13 CMIP5 global climate models considered in this study.
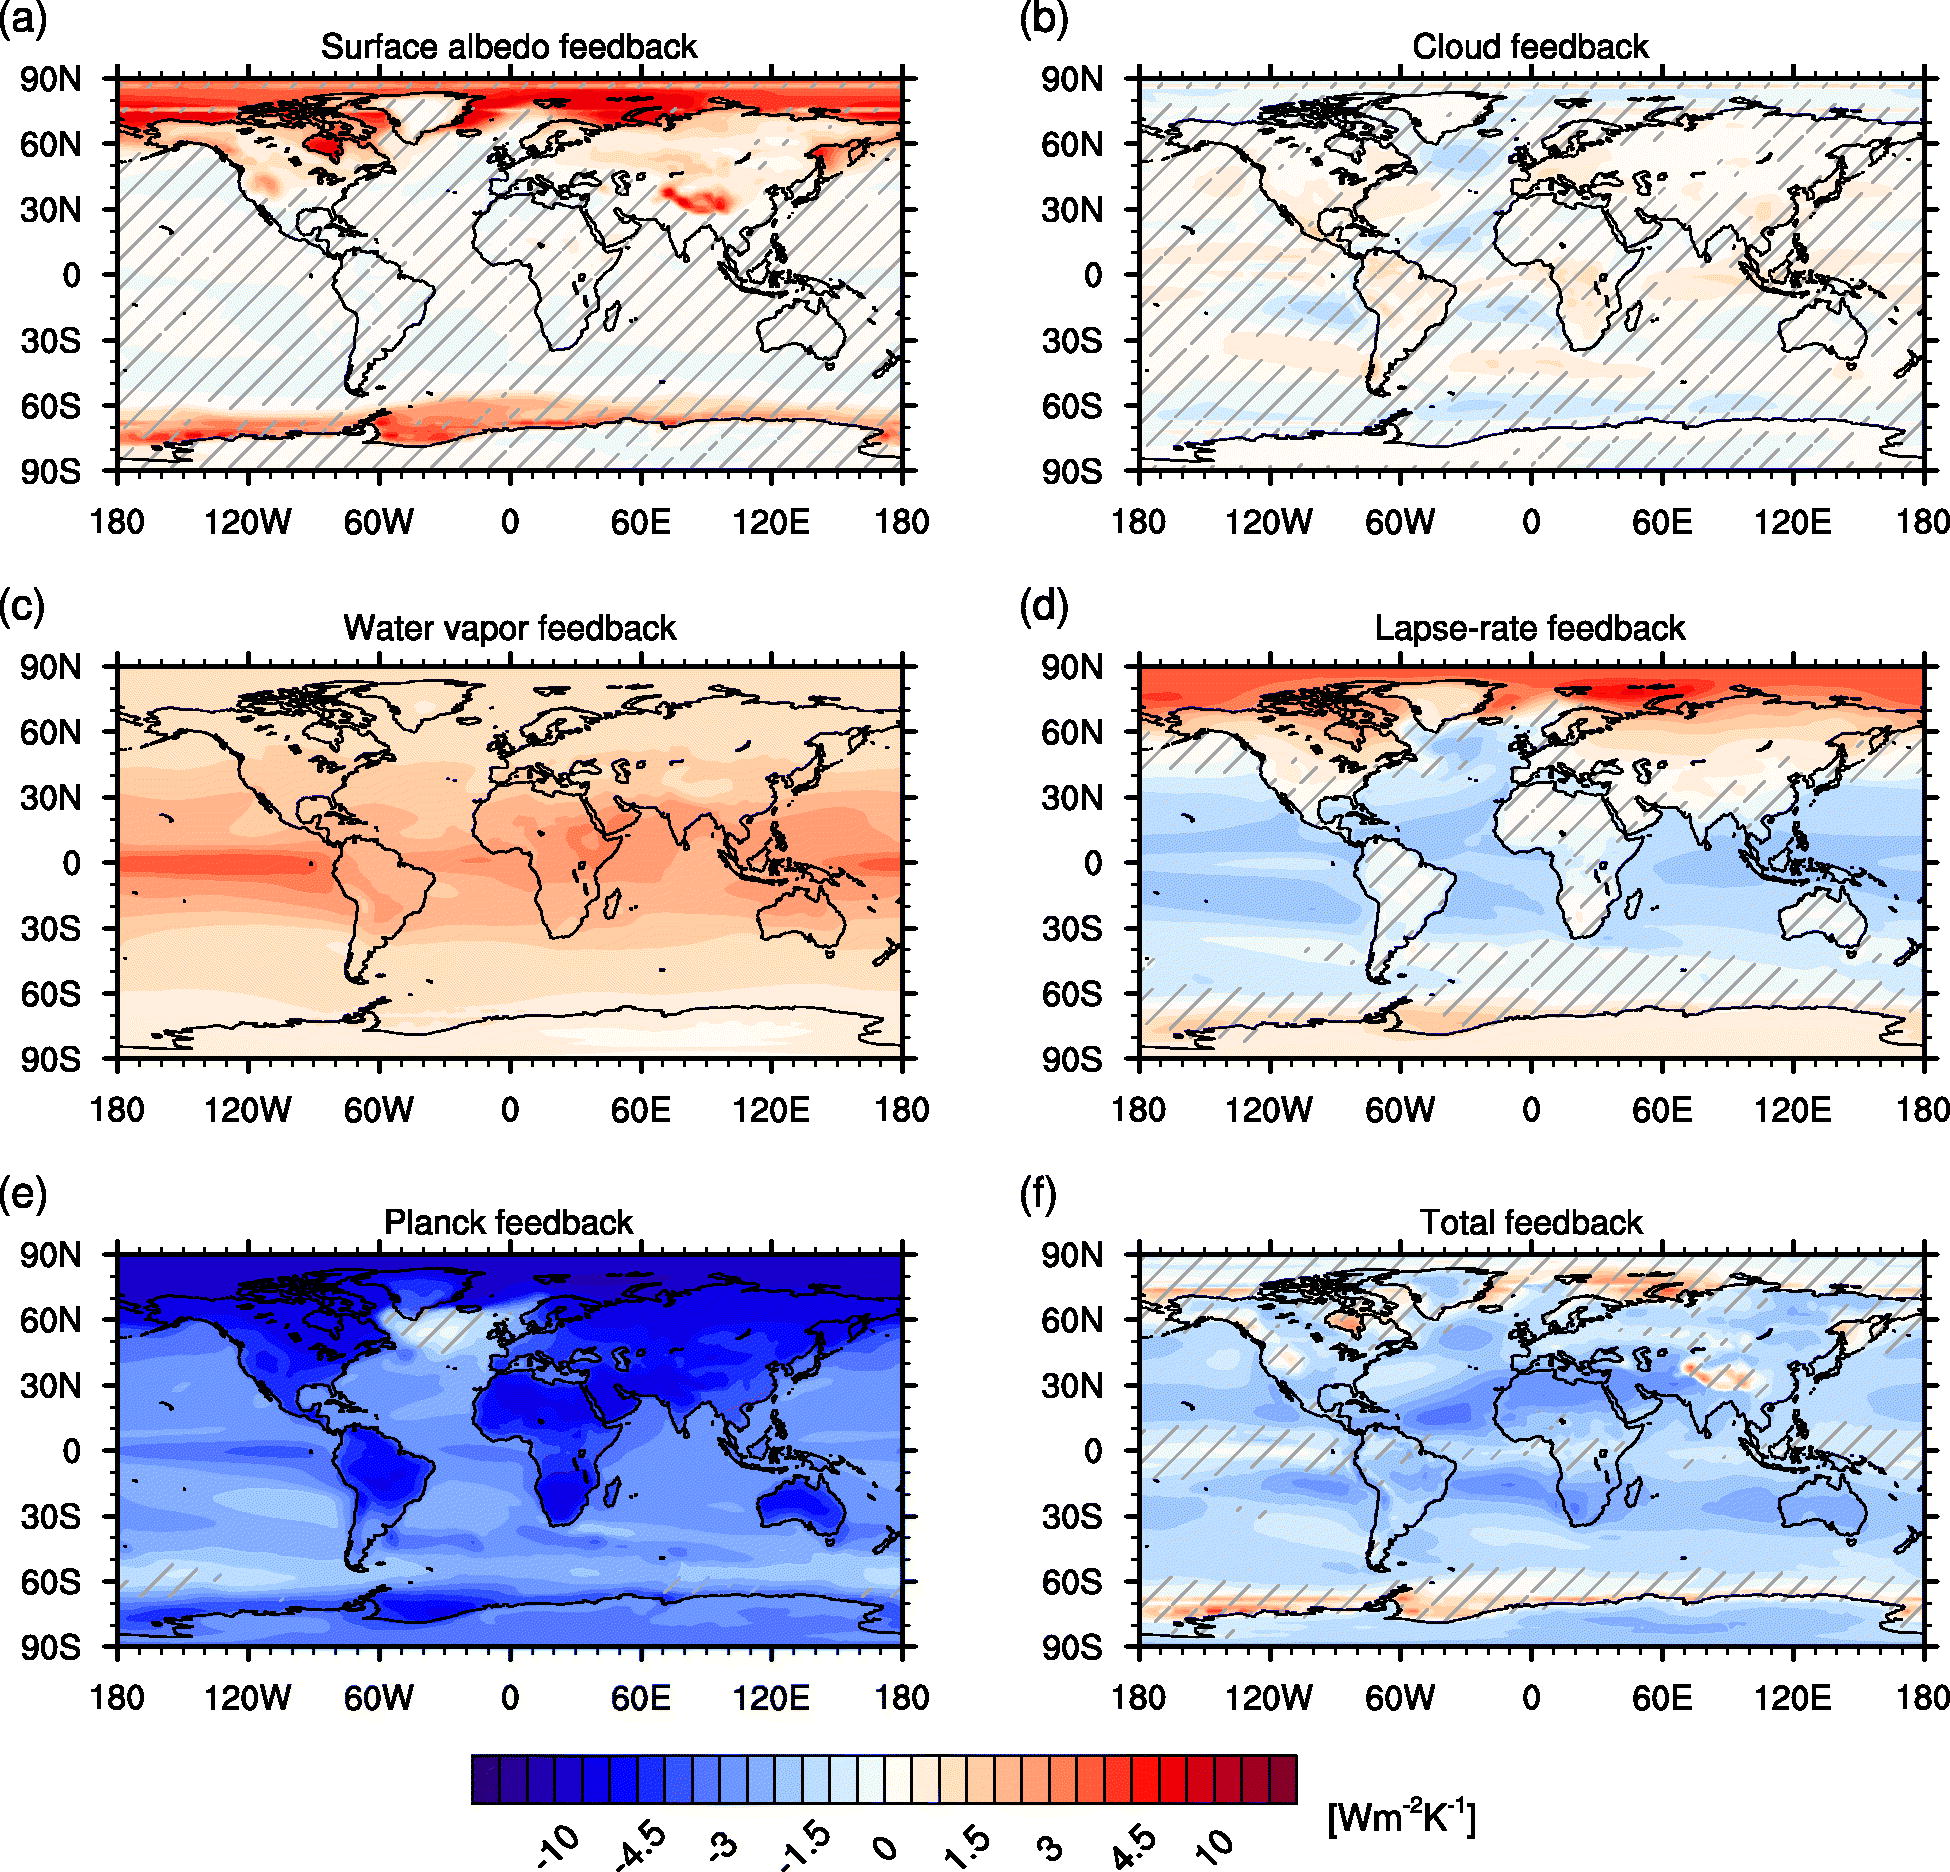
Fig. 2.
Global distributions of multimodel-mean TOA radiation feedbacks [W m−2 K−1] from changes in surface albedo (a), clouds (b), water vapour (c), lapse rates (d), surface temperatures (e) and the sum of these components (f), which have been computed using the two sided PRP method for a quadrupling of CO2. Positive values denote increased downward radiation and thus an amplified surface warming. Hatching represents areas where less than 12 models (92% of data sample) agree with the sign of the multimodel-mean and are therefore considered to be insignificant.
Table 2.
Feedback parameters in [Wm−2K−1] computed from the abrupt4xCO2 and the piControl simulation with the two-sided PRP method.
[i] Values are the 50-year multimodel averages and their intermodel standard deviation for the respective area-weighted regions: the Tropics (20° S - 20° N), the Arctic (70° N - 90° N) and the Antarctic (70° S - 90° S), as illustrated in Figure 1.
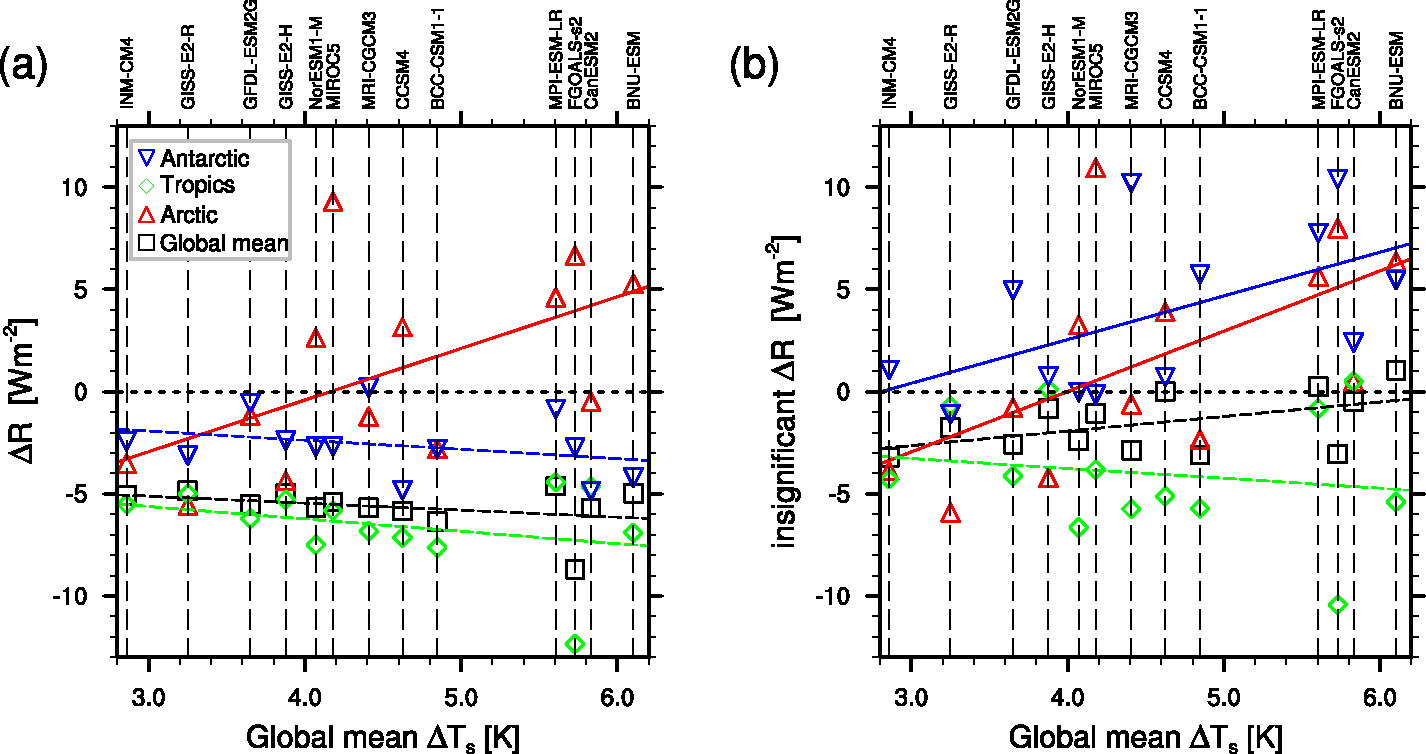
Fig. 3.
Feedback induced total TOA radiance change [W m-2] between the abrupt4xCO2 and the piControl experiment plotted against the global mean surface warming [K] from these experiments exhibited by 13 CMIP5 models. Area-weighted regional averages (markers) and corresponding linear regression lines are drawn for averages of the Globe, the Arctic (70-90° N), the Tropics (20° S - 20° N) and Antarctica (70-90° S). A comparison is made for (a), regional averages in which all data points are taken into account, and (b), regional averages in which only data points are used for which the multimodel mean total feedback has been shown to be insignificant (meaning that less than 12 of 13 models agree in sign). Regression lines are drawn solid for significant and dashed for insignificant regression coefficients at the 95% significance level.
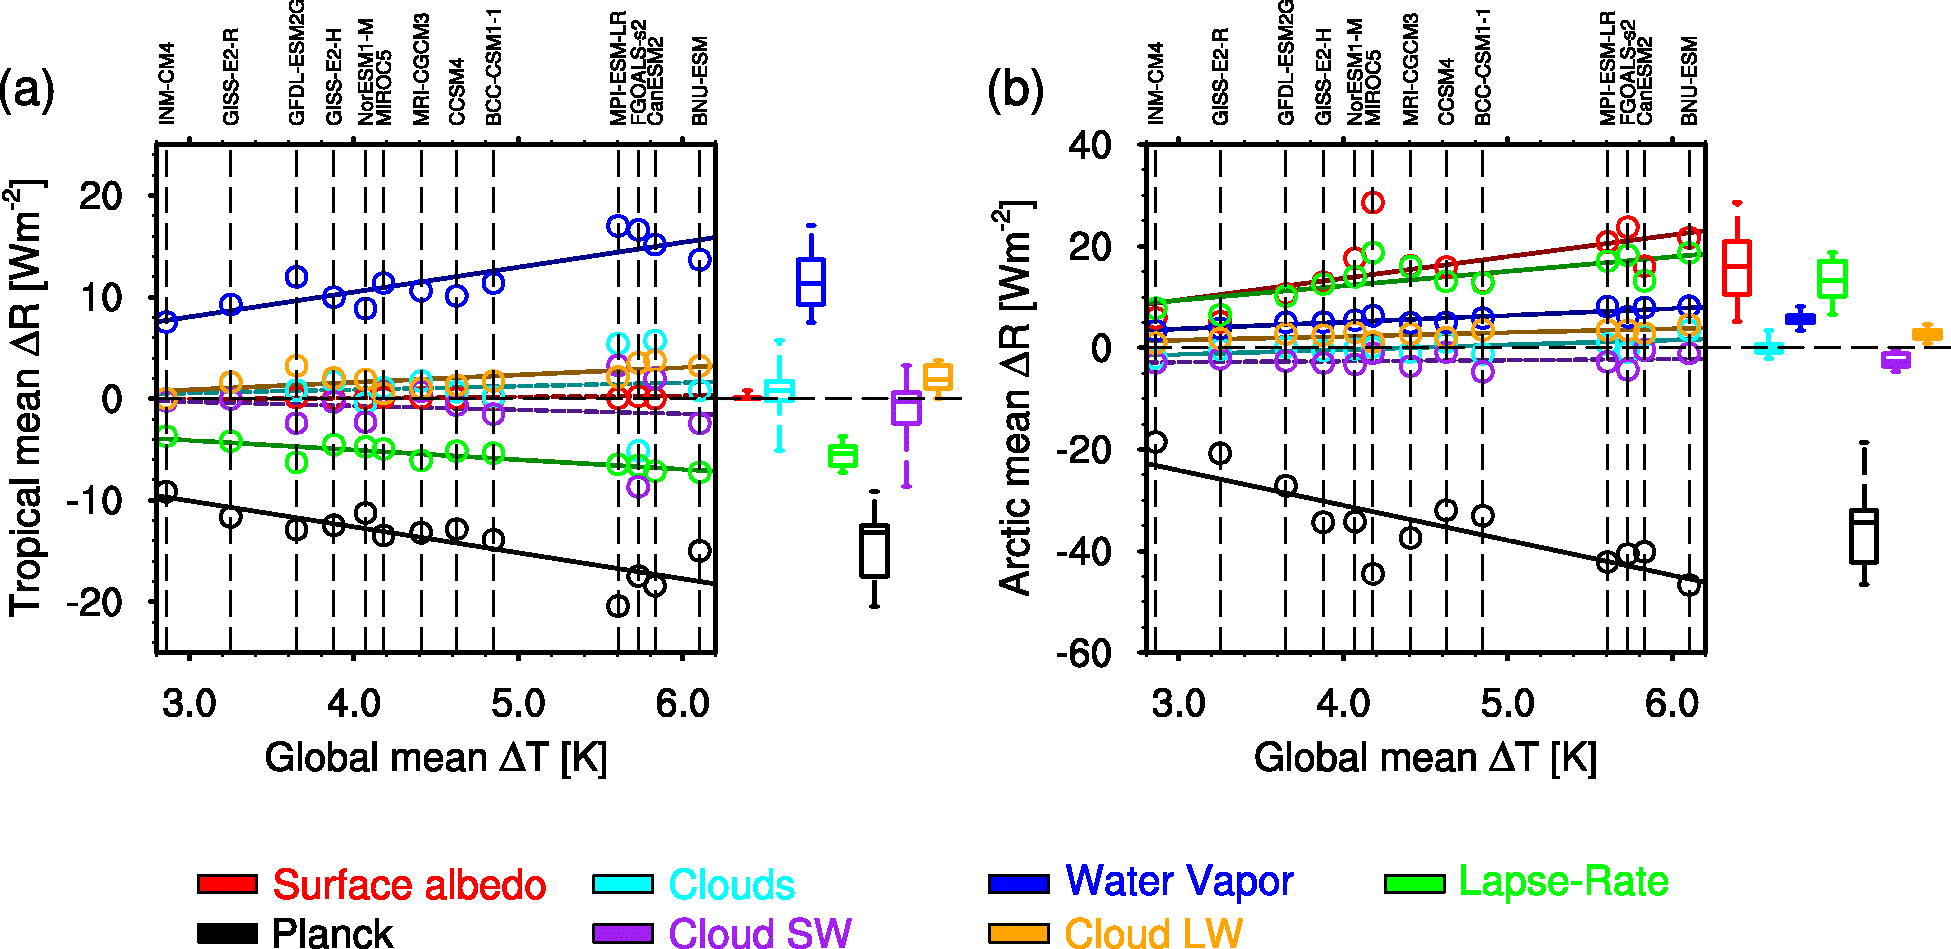
Fig. 4.
Feedback induced total TOA radiance change [W m−2] between the abrupt4xCO2 and the piControl experiment plotted against the global mean surface warming [K] from these experiments exhibited by 13 CMIP5 models. The respective radiation changes induced from surface albedo (red), Planck (black), Lapse rate (green), water vapour (blue) and cloud feedbacks (net: light blue; shortwave: purple; longwave: orange) are area-weighted averages from the Tropics (a) and the Arctic (b), respectively. Please note the different scales on the y-axis. Related uncertainties to the individual δR are illustrated to the right of (a) and (b) showing the median (lines), 25th and 75th percentile (boxes), and the full ensemble spread (whiskers). Regression lines are drawn solid for significant and dashed for insignificant regression coefficients at the 95% significance level.
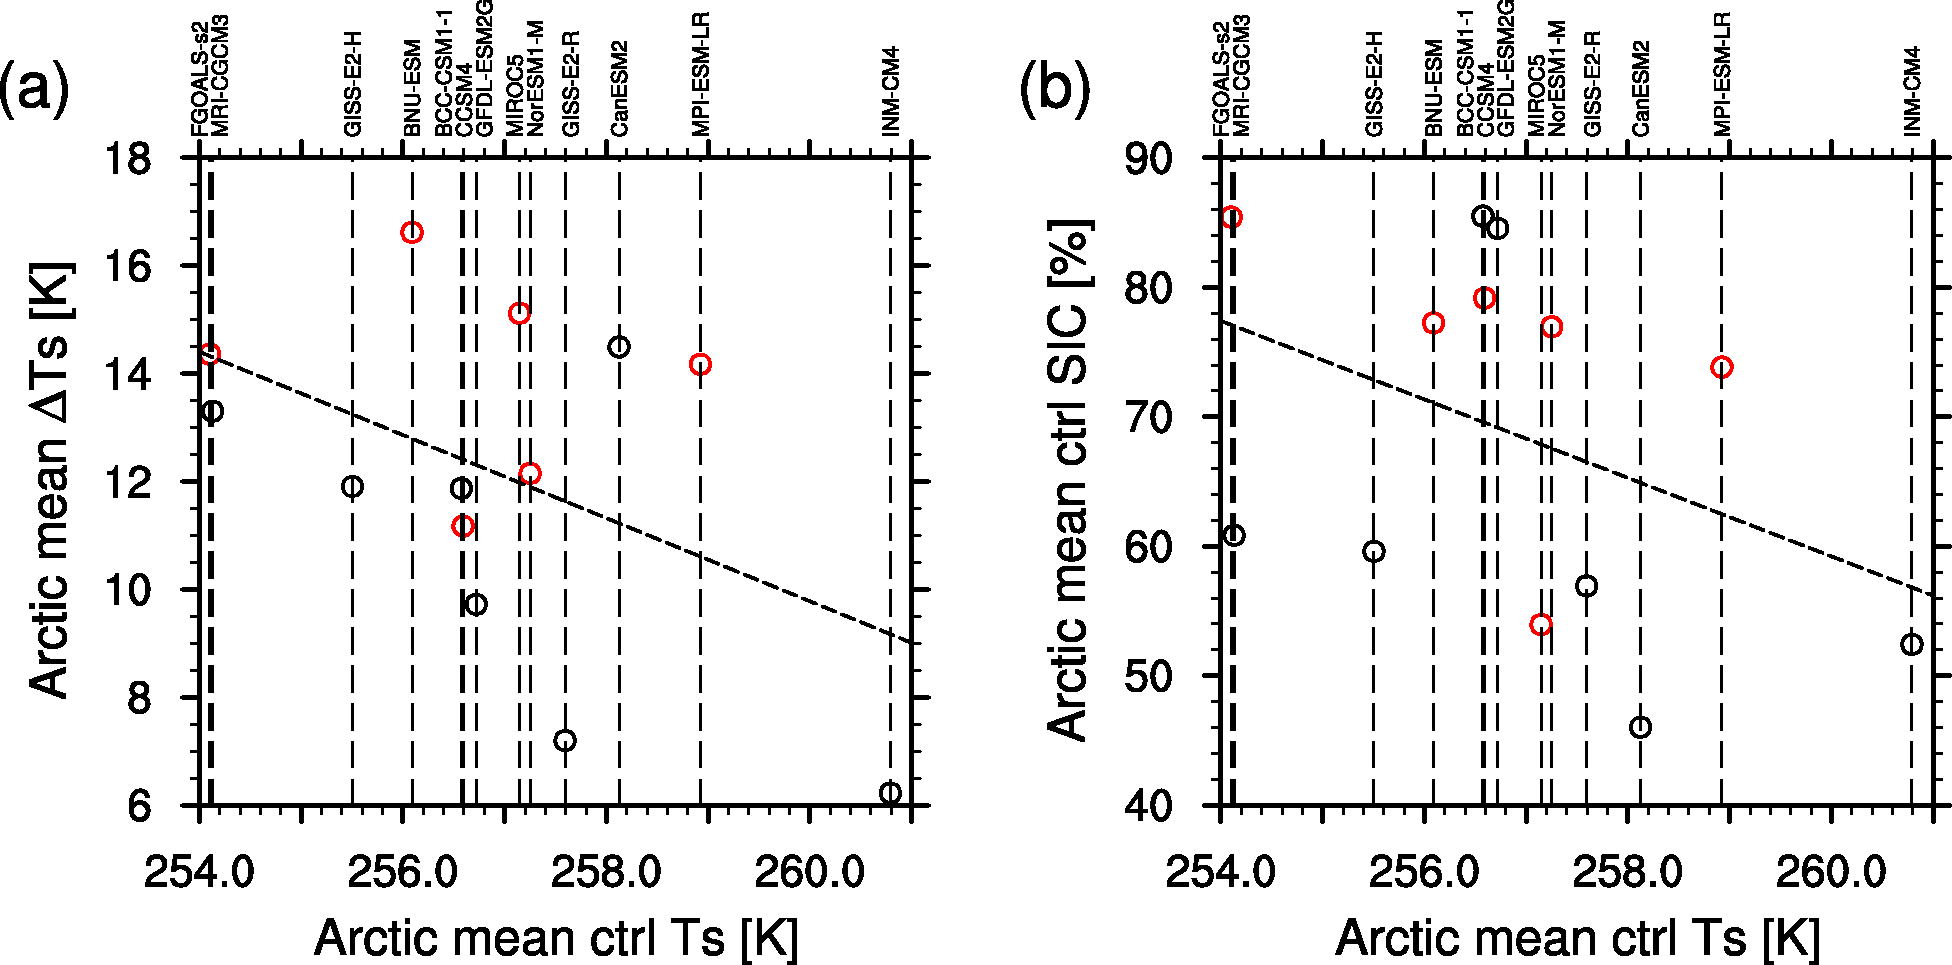
Fig. 5.
Relationships of (a) Arctic mean surface warming and (b) Arctic mean preindustrial (ctrl) sea ice cover (SIC) to Arctic mean preindustrial (ctrl) surface temperature. Red circles indicate models which show positive Arctic total feedbacks. Regression lines are drawn (dashed), but are insignificant at the 95% significance level.
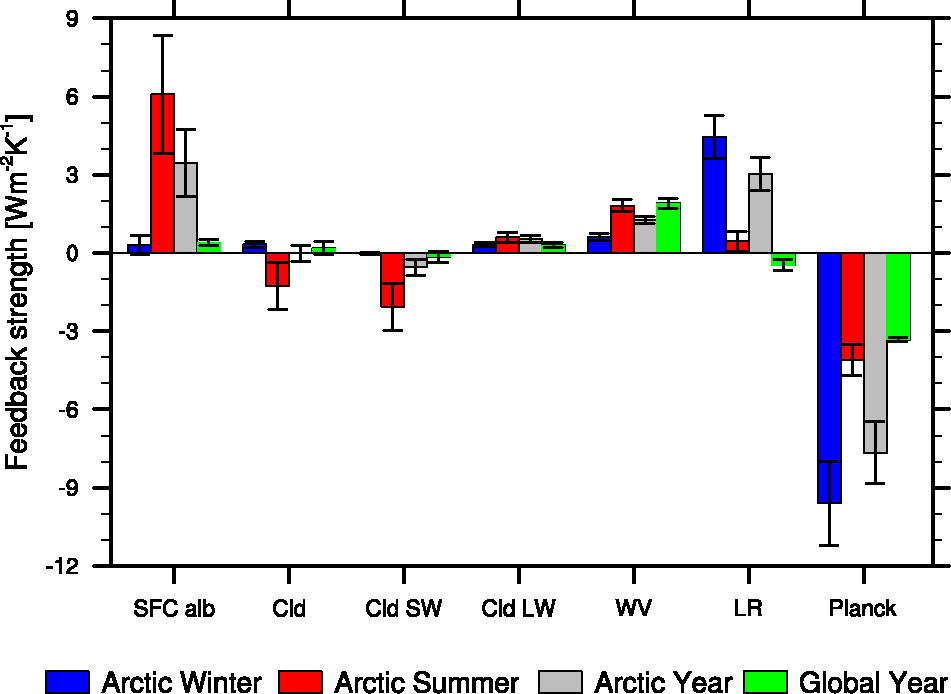
Fig. 6.
The multimodel mean area-weighted feedback strengths of each individual feedback are shown for different time periods and regions. Blue represents the Arctic winter (December, January, February) and red the Arctic summer (June, July, August) average. The yearly average is shown in grey for the Arctic and in green for the global mean, for reference. The error bars show the extent of one standard deviation of the multimodel distribution.