
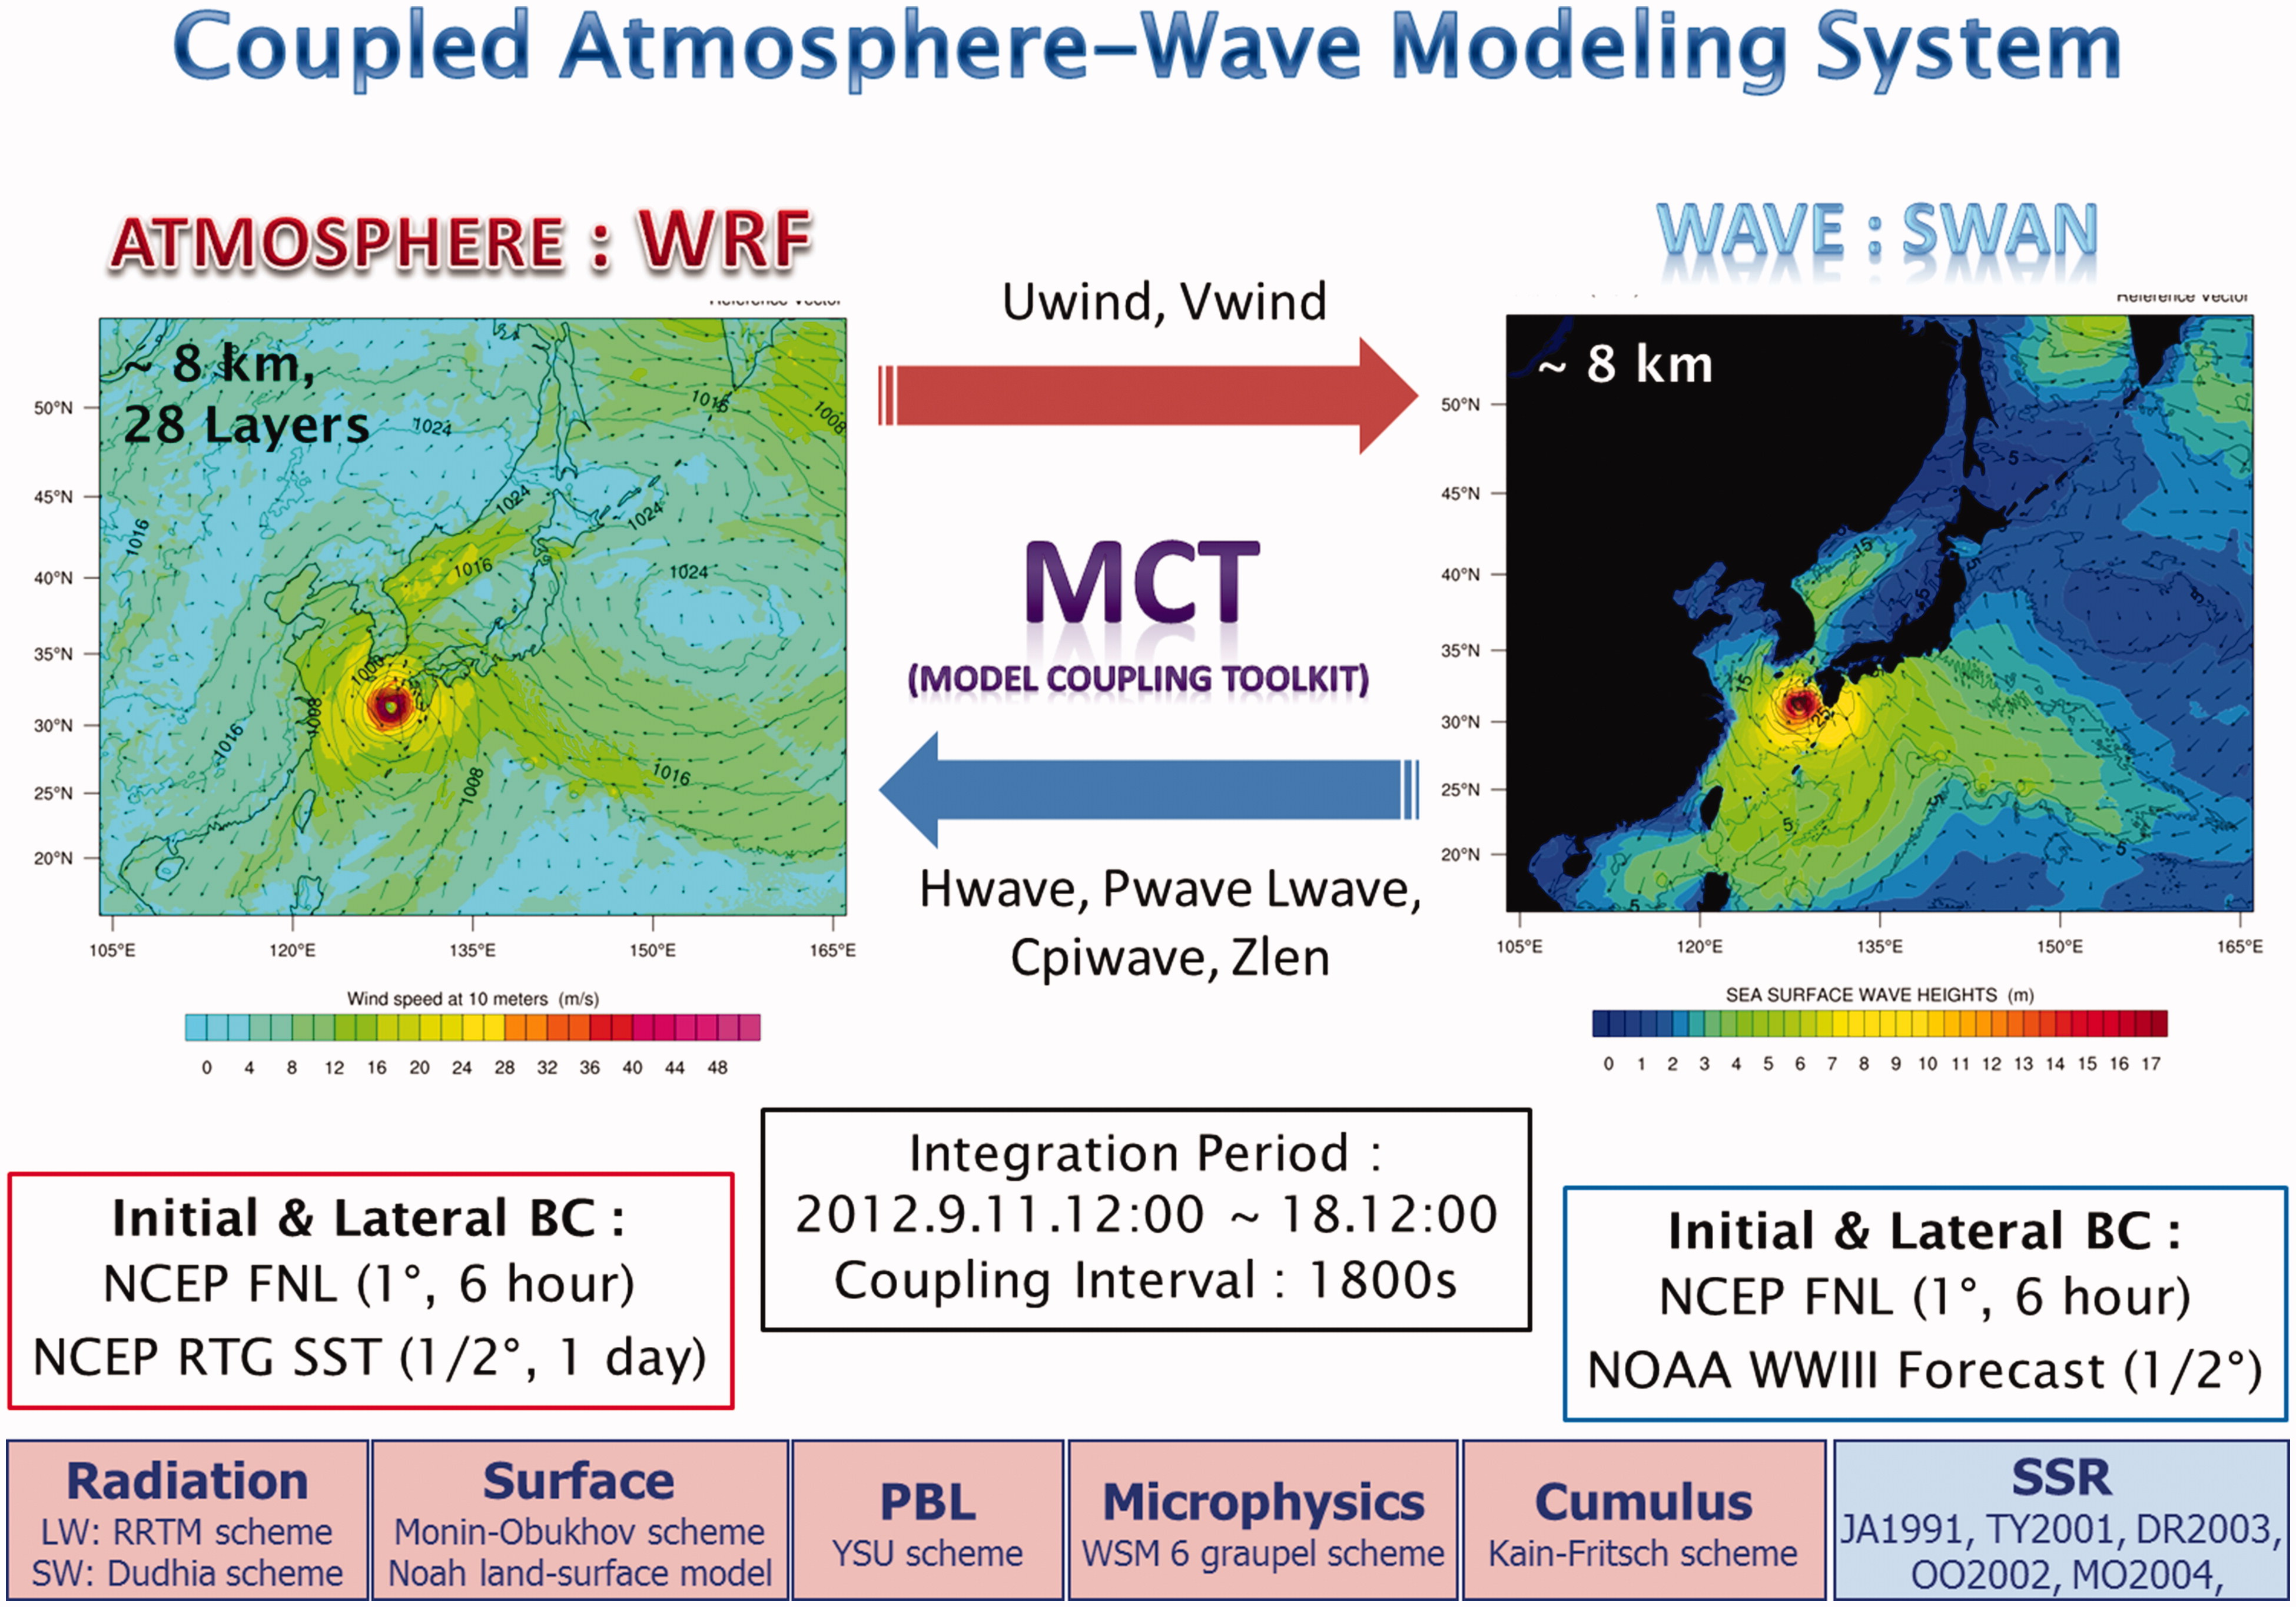
Fig. 1.
A schematic diagram of the coupled atmosphere–wave modelling system, and brief descriptions of the parameterisation schemes and model set-up considered in this study. The exchange variables between the models are surface wind (Uwind and Vwind) from WRF to SWAN, and the wave fields, such as wave height (Hwave), wave period (Pwave), wavelength (Lwave), SSR estimated in the wave model using the total stress (Zlen), and input wave age (Cpiwave), depending on the selected SSR parameterisation method, from SWAN to WRF.
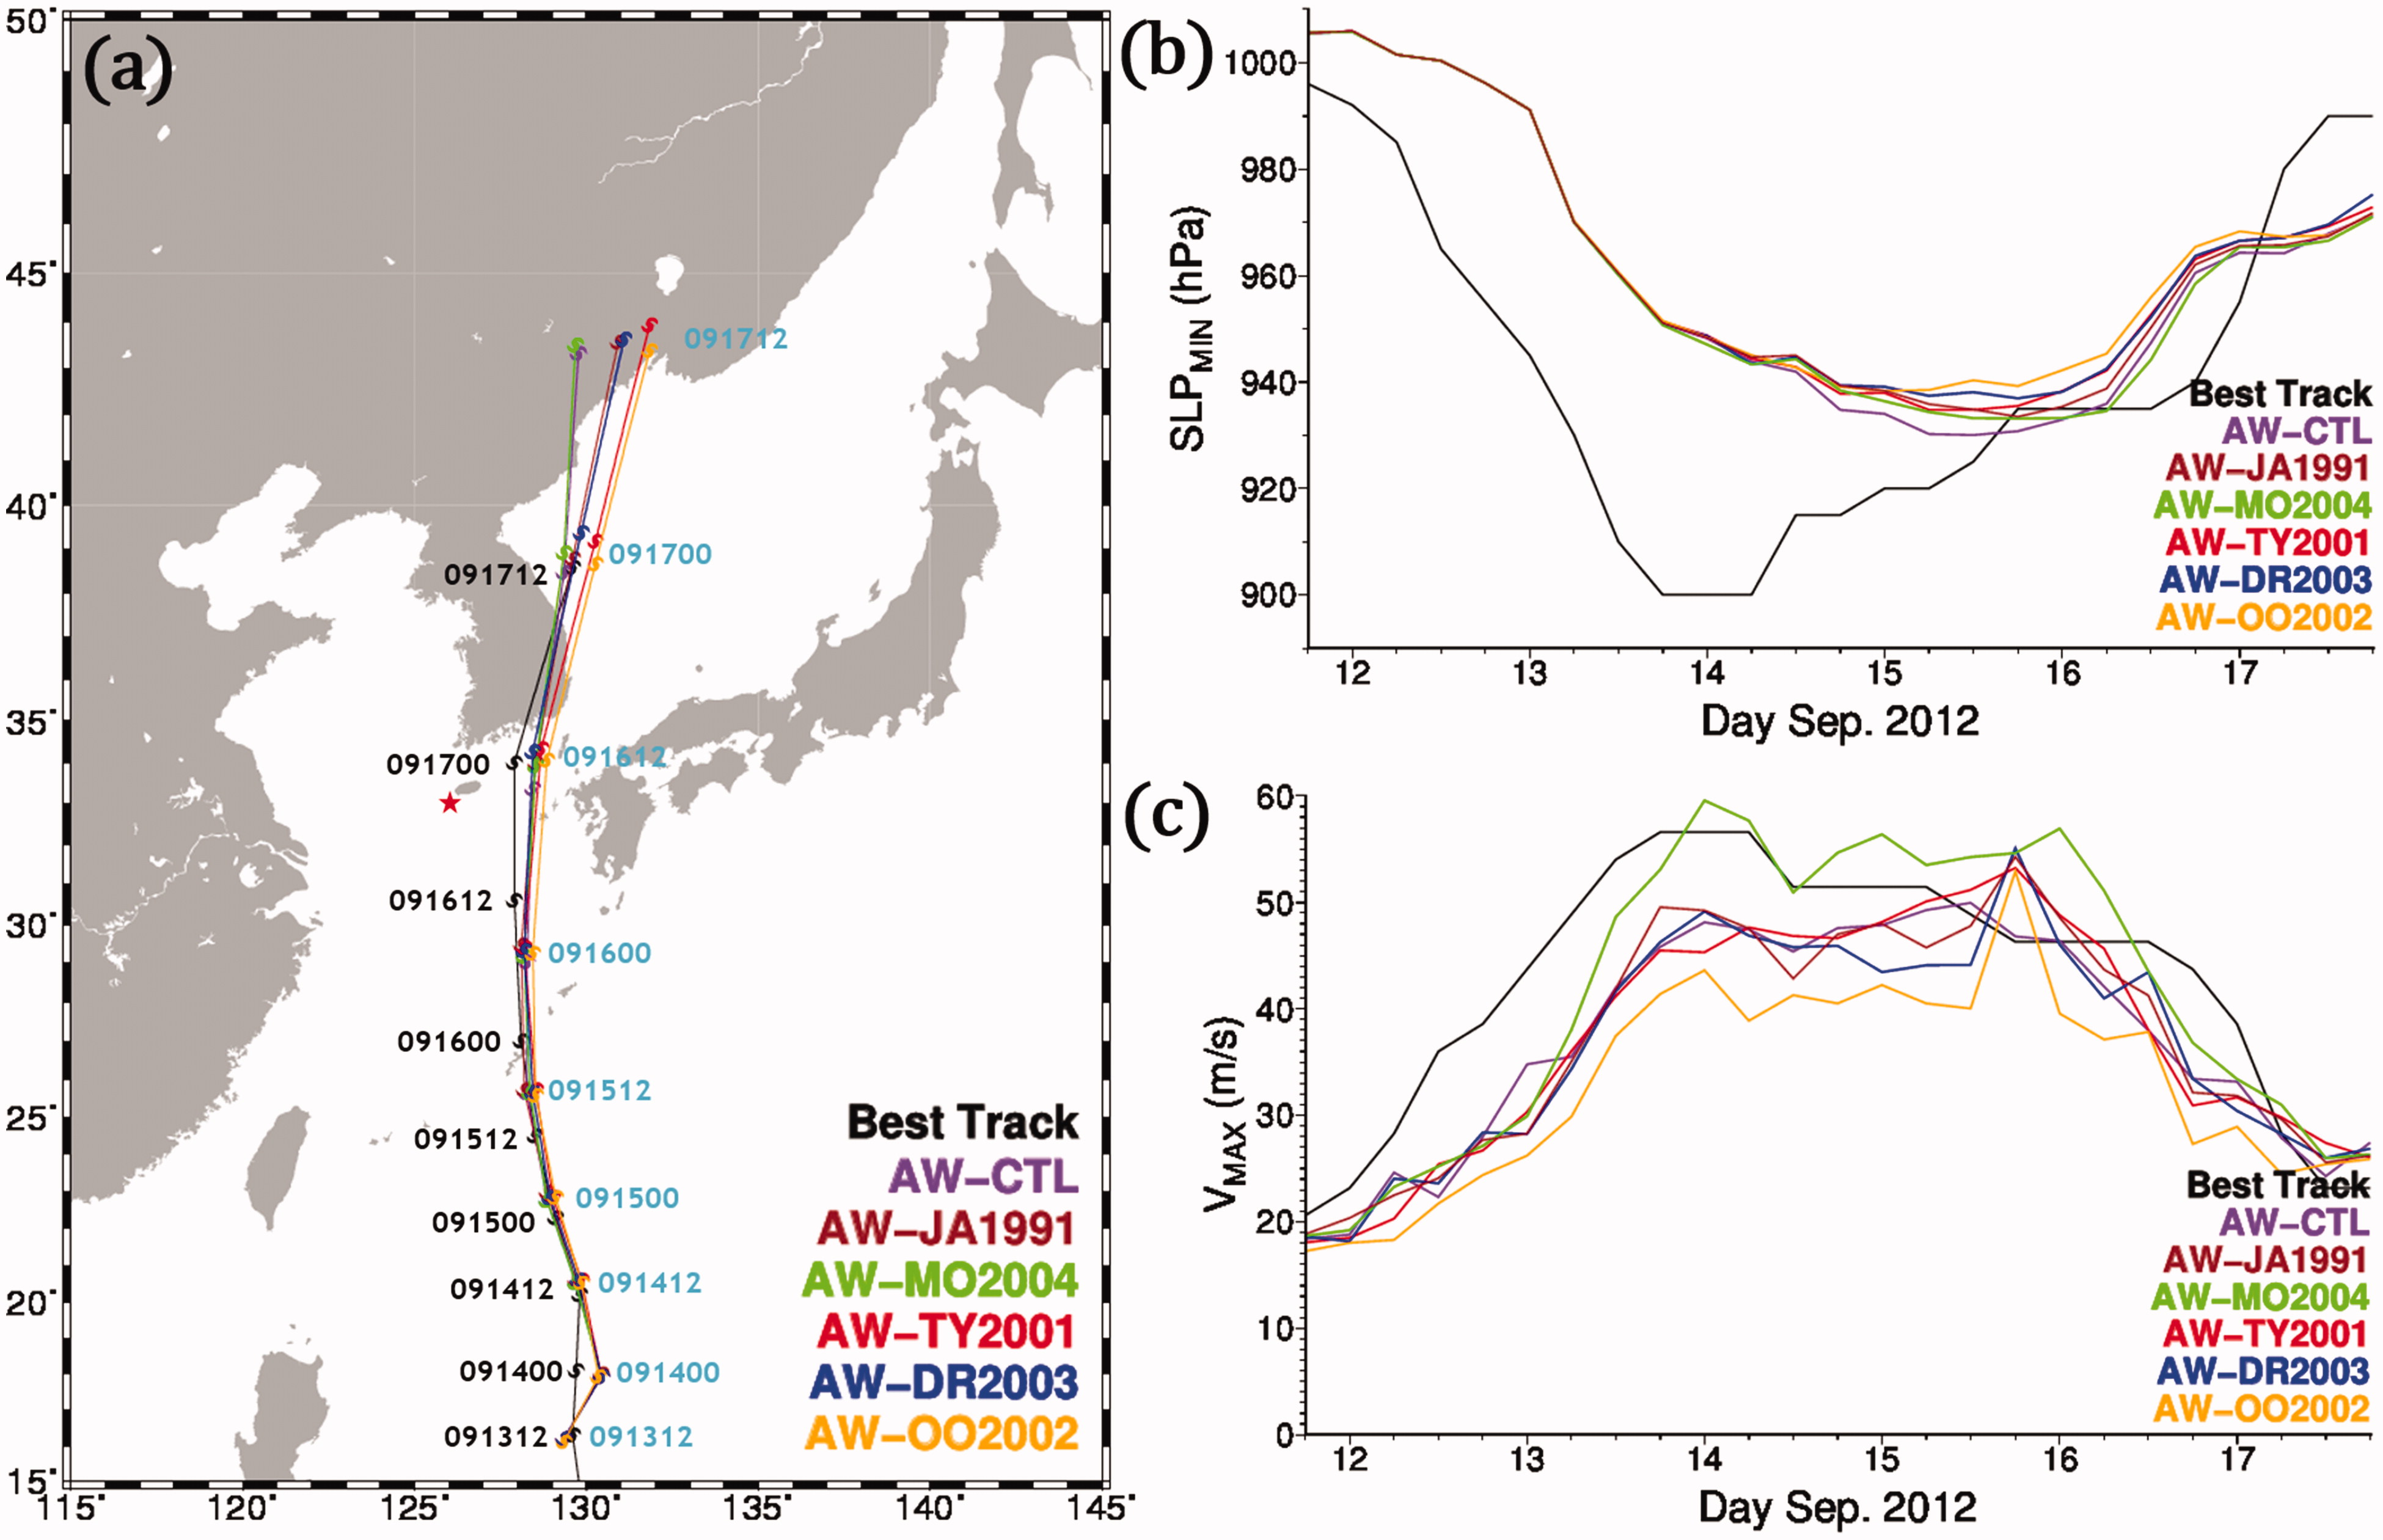
Fig. 2.
(a) Best track and time evolutions of (b) minimum sea level pressure and (c) maximum wind speed of Typhoon Sanba, provided from JTWC (black line) and simulated from each experiment (coloured lines). The red star in (a) indicates the position of Buoy 22107 for the time-series of wind and wave height in Fig. 8.
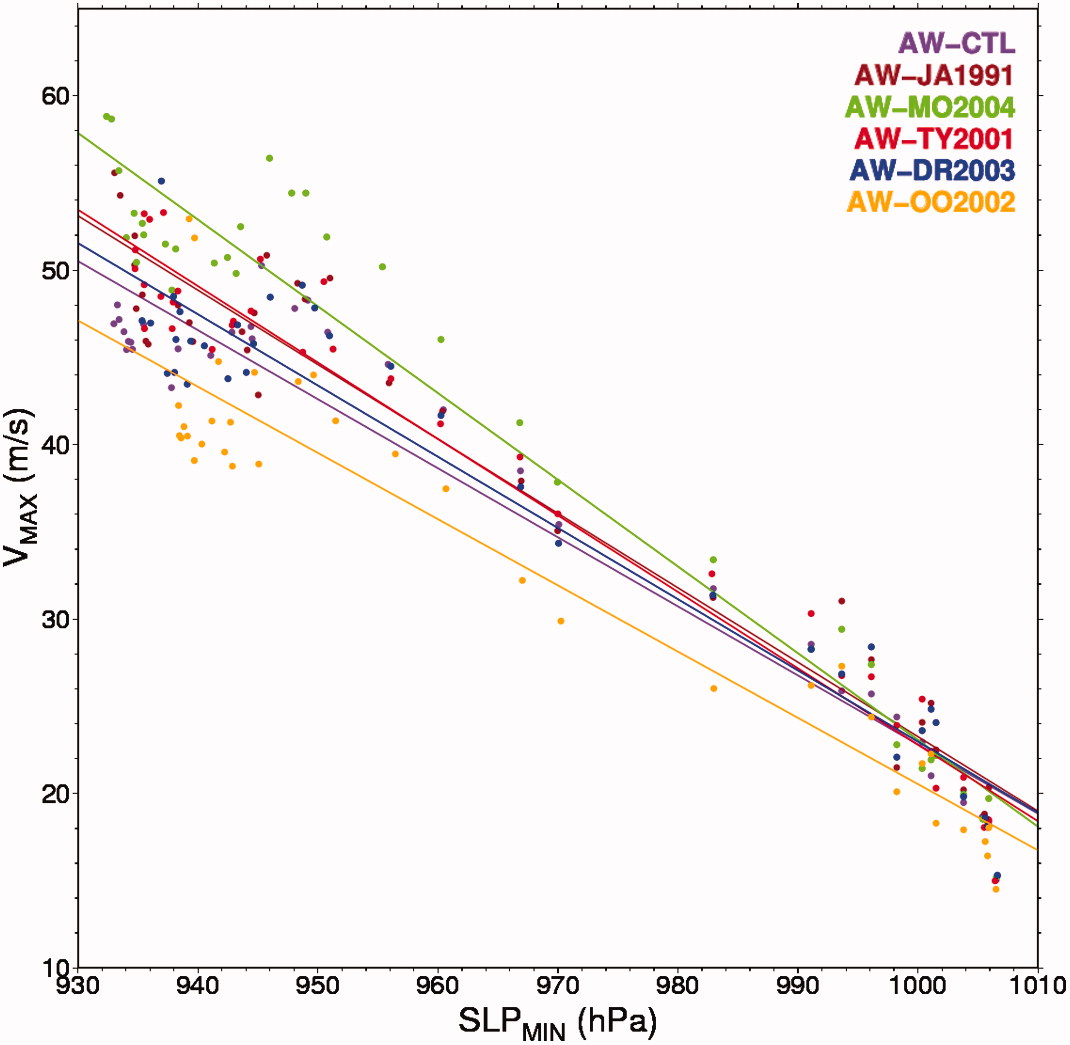
Fig. 3.
Plots of minimum sea level pressure vs maximum 10 m wind speed predicted from each experiment.
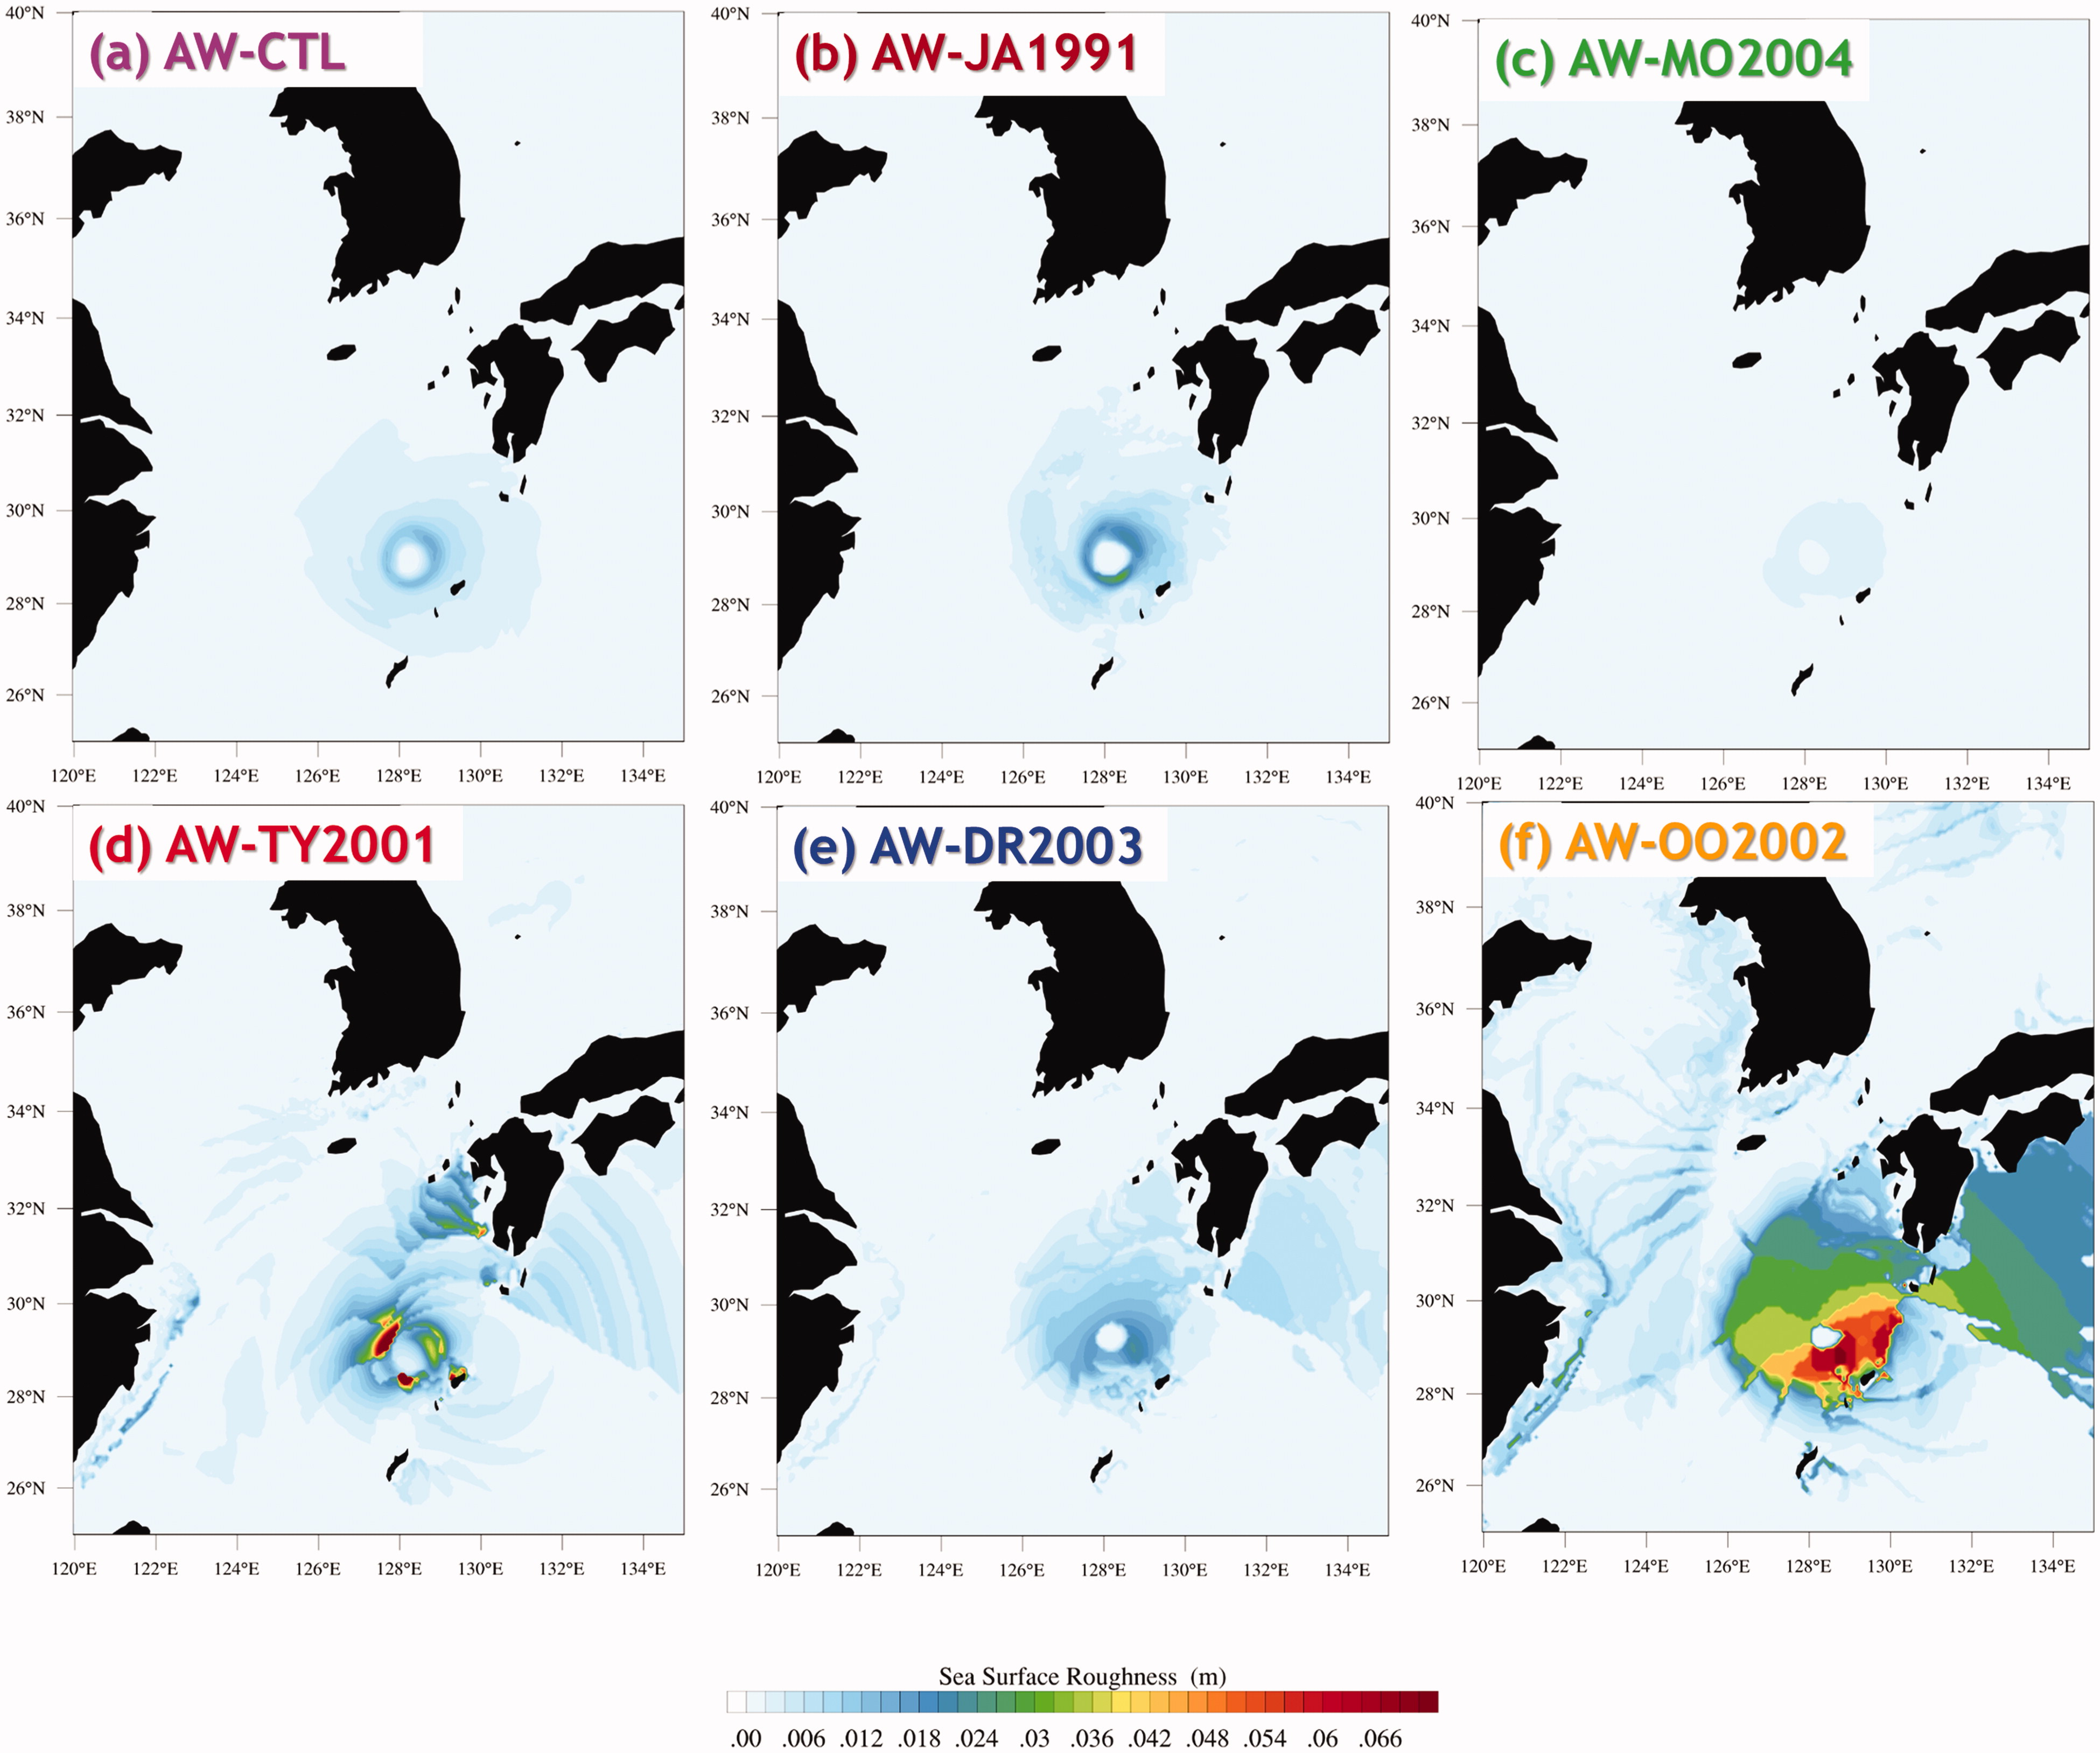
Fig. 4.
Spatial distribution of sea surface roughness estimated by each experiment at 00 UTC September 16, 2012; (a) AW-CTL, (b) AW-JA1991, (c) AW-MO2004, (d) AW-TY2001, (e) AW-DR2003, and (f) AW-OO2002.
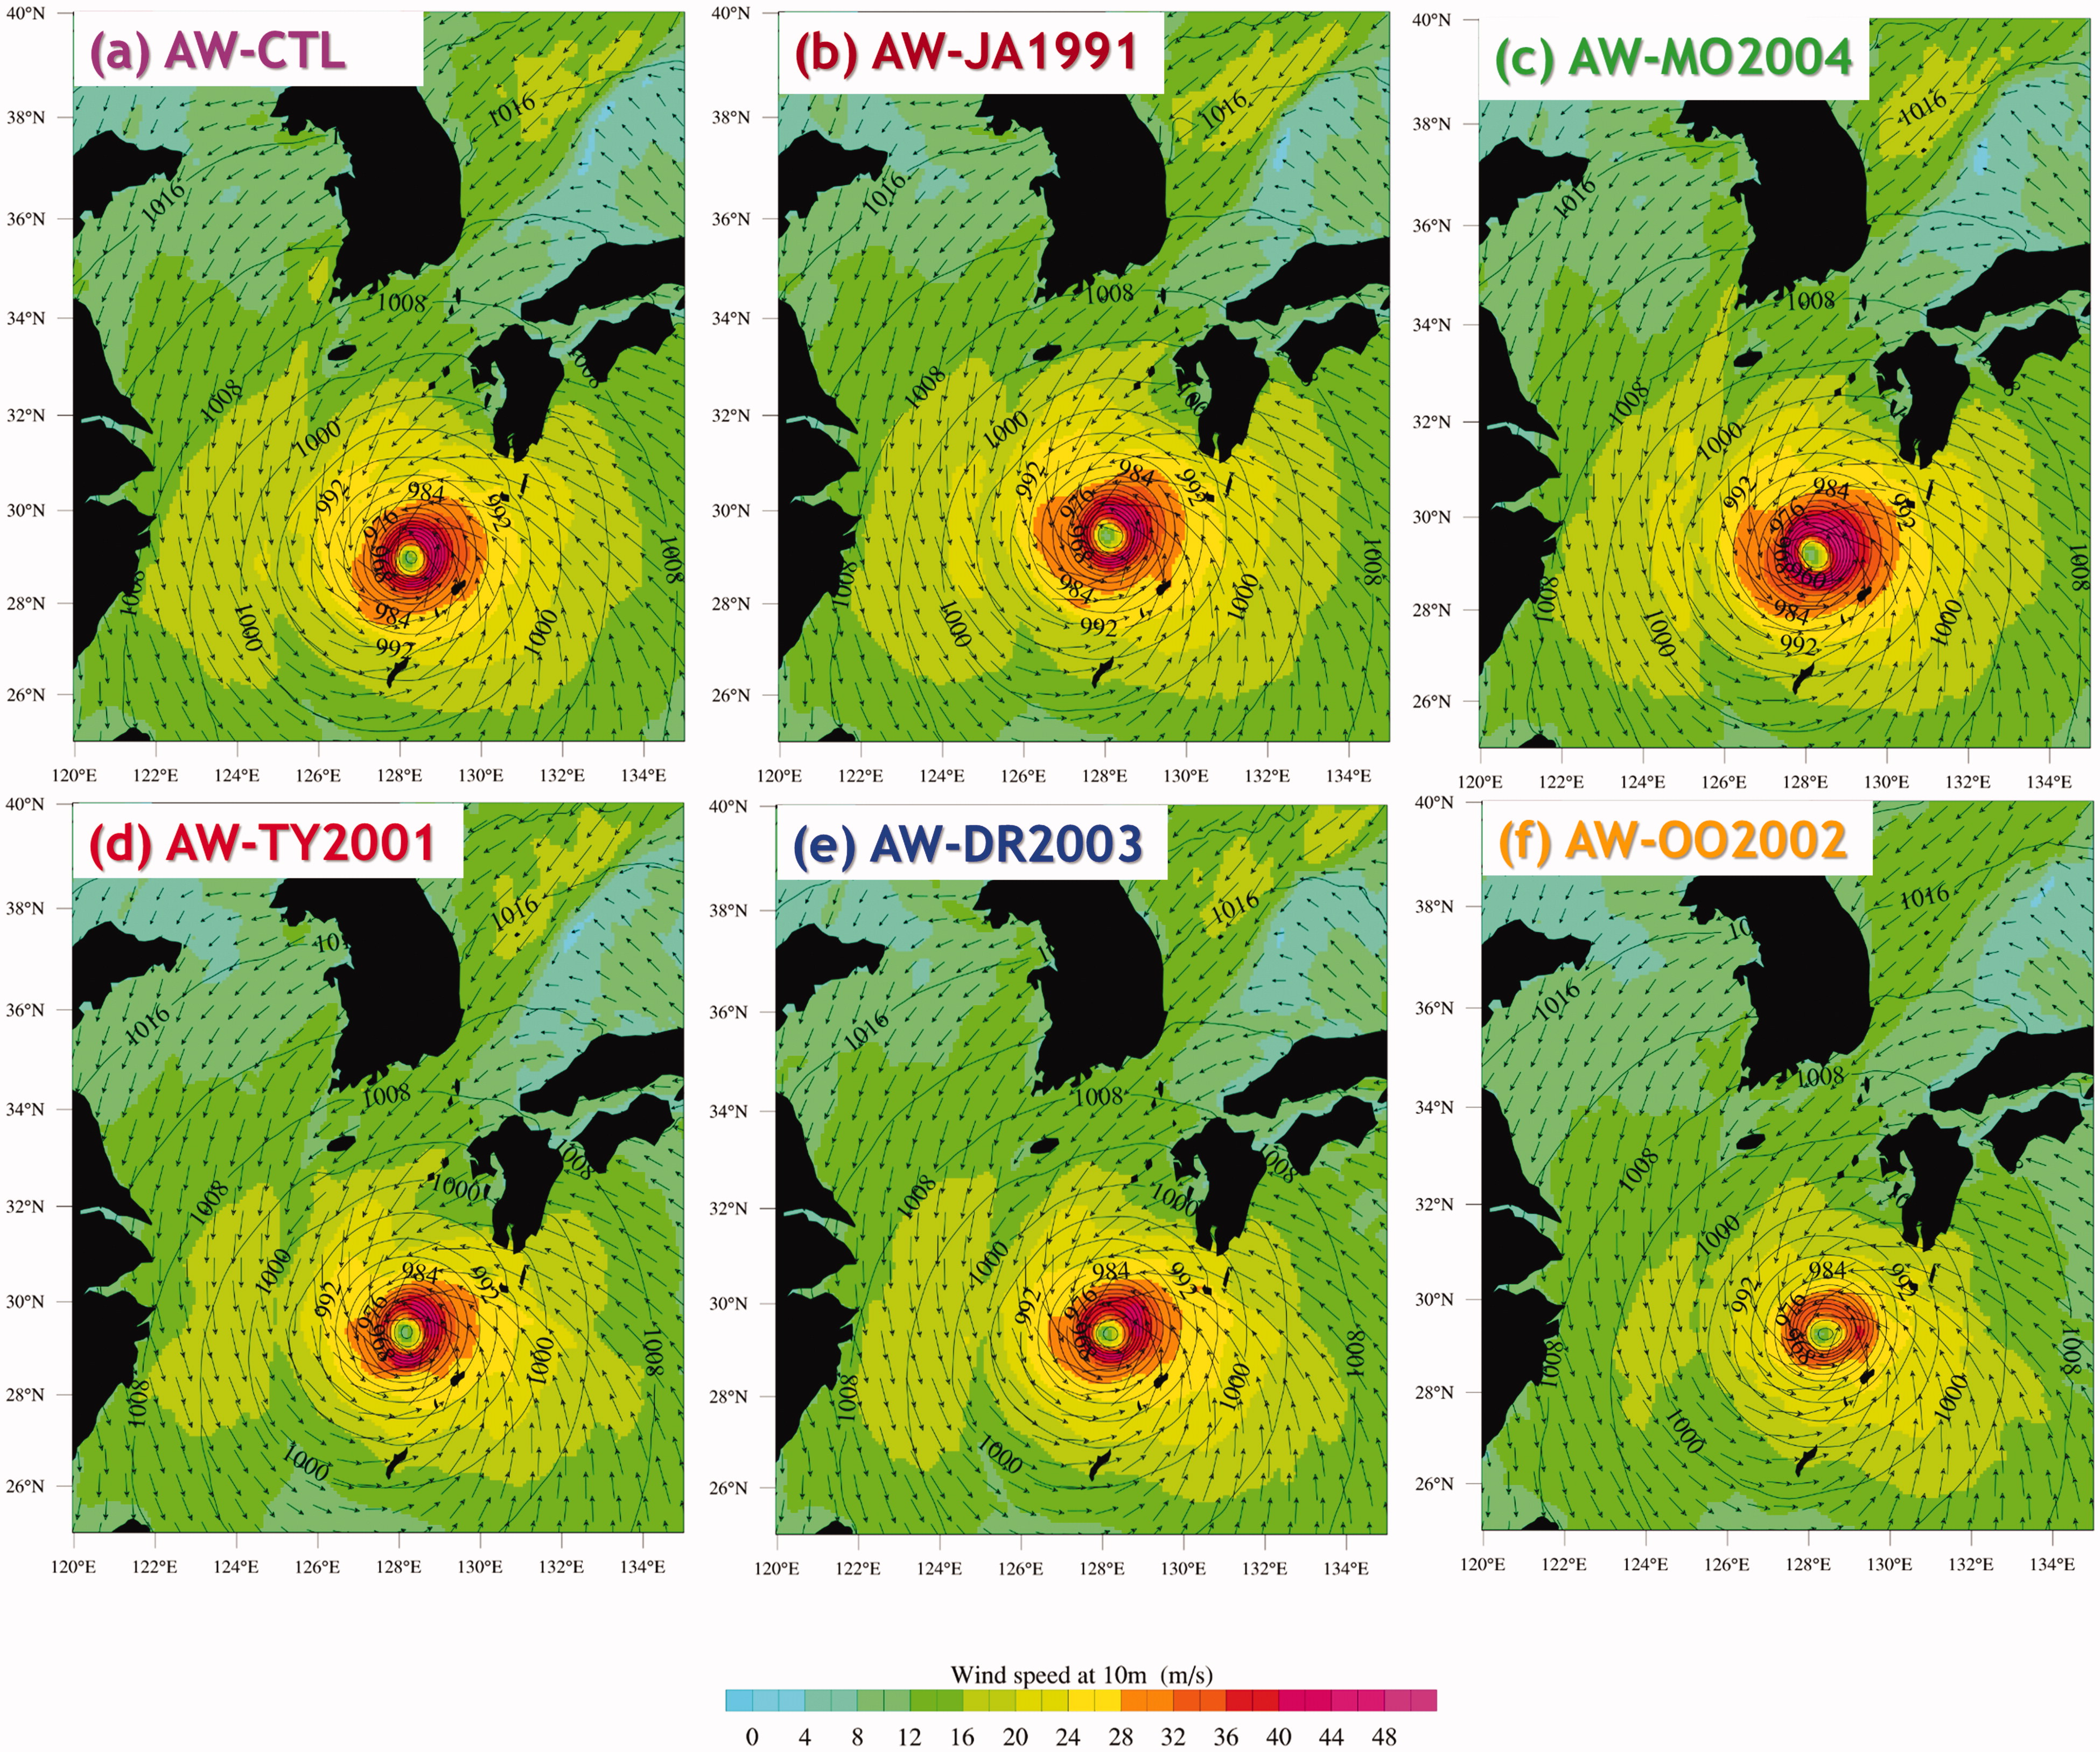
Fig. 5.
Horizontal distribution of 10 m wind fields (arrows and colour shading) and sea level pressure (contours) calculated from each experiment at 00 UTC September 16, 2012; (a) AW-CTL, (b) AW-JA1991, (c) AW-MO2004, (d) AW-TY2001, (e) AW-DR2003, and (f) AW-OO2002.
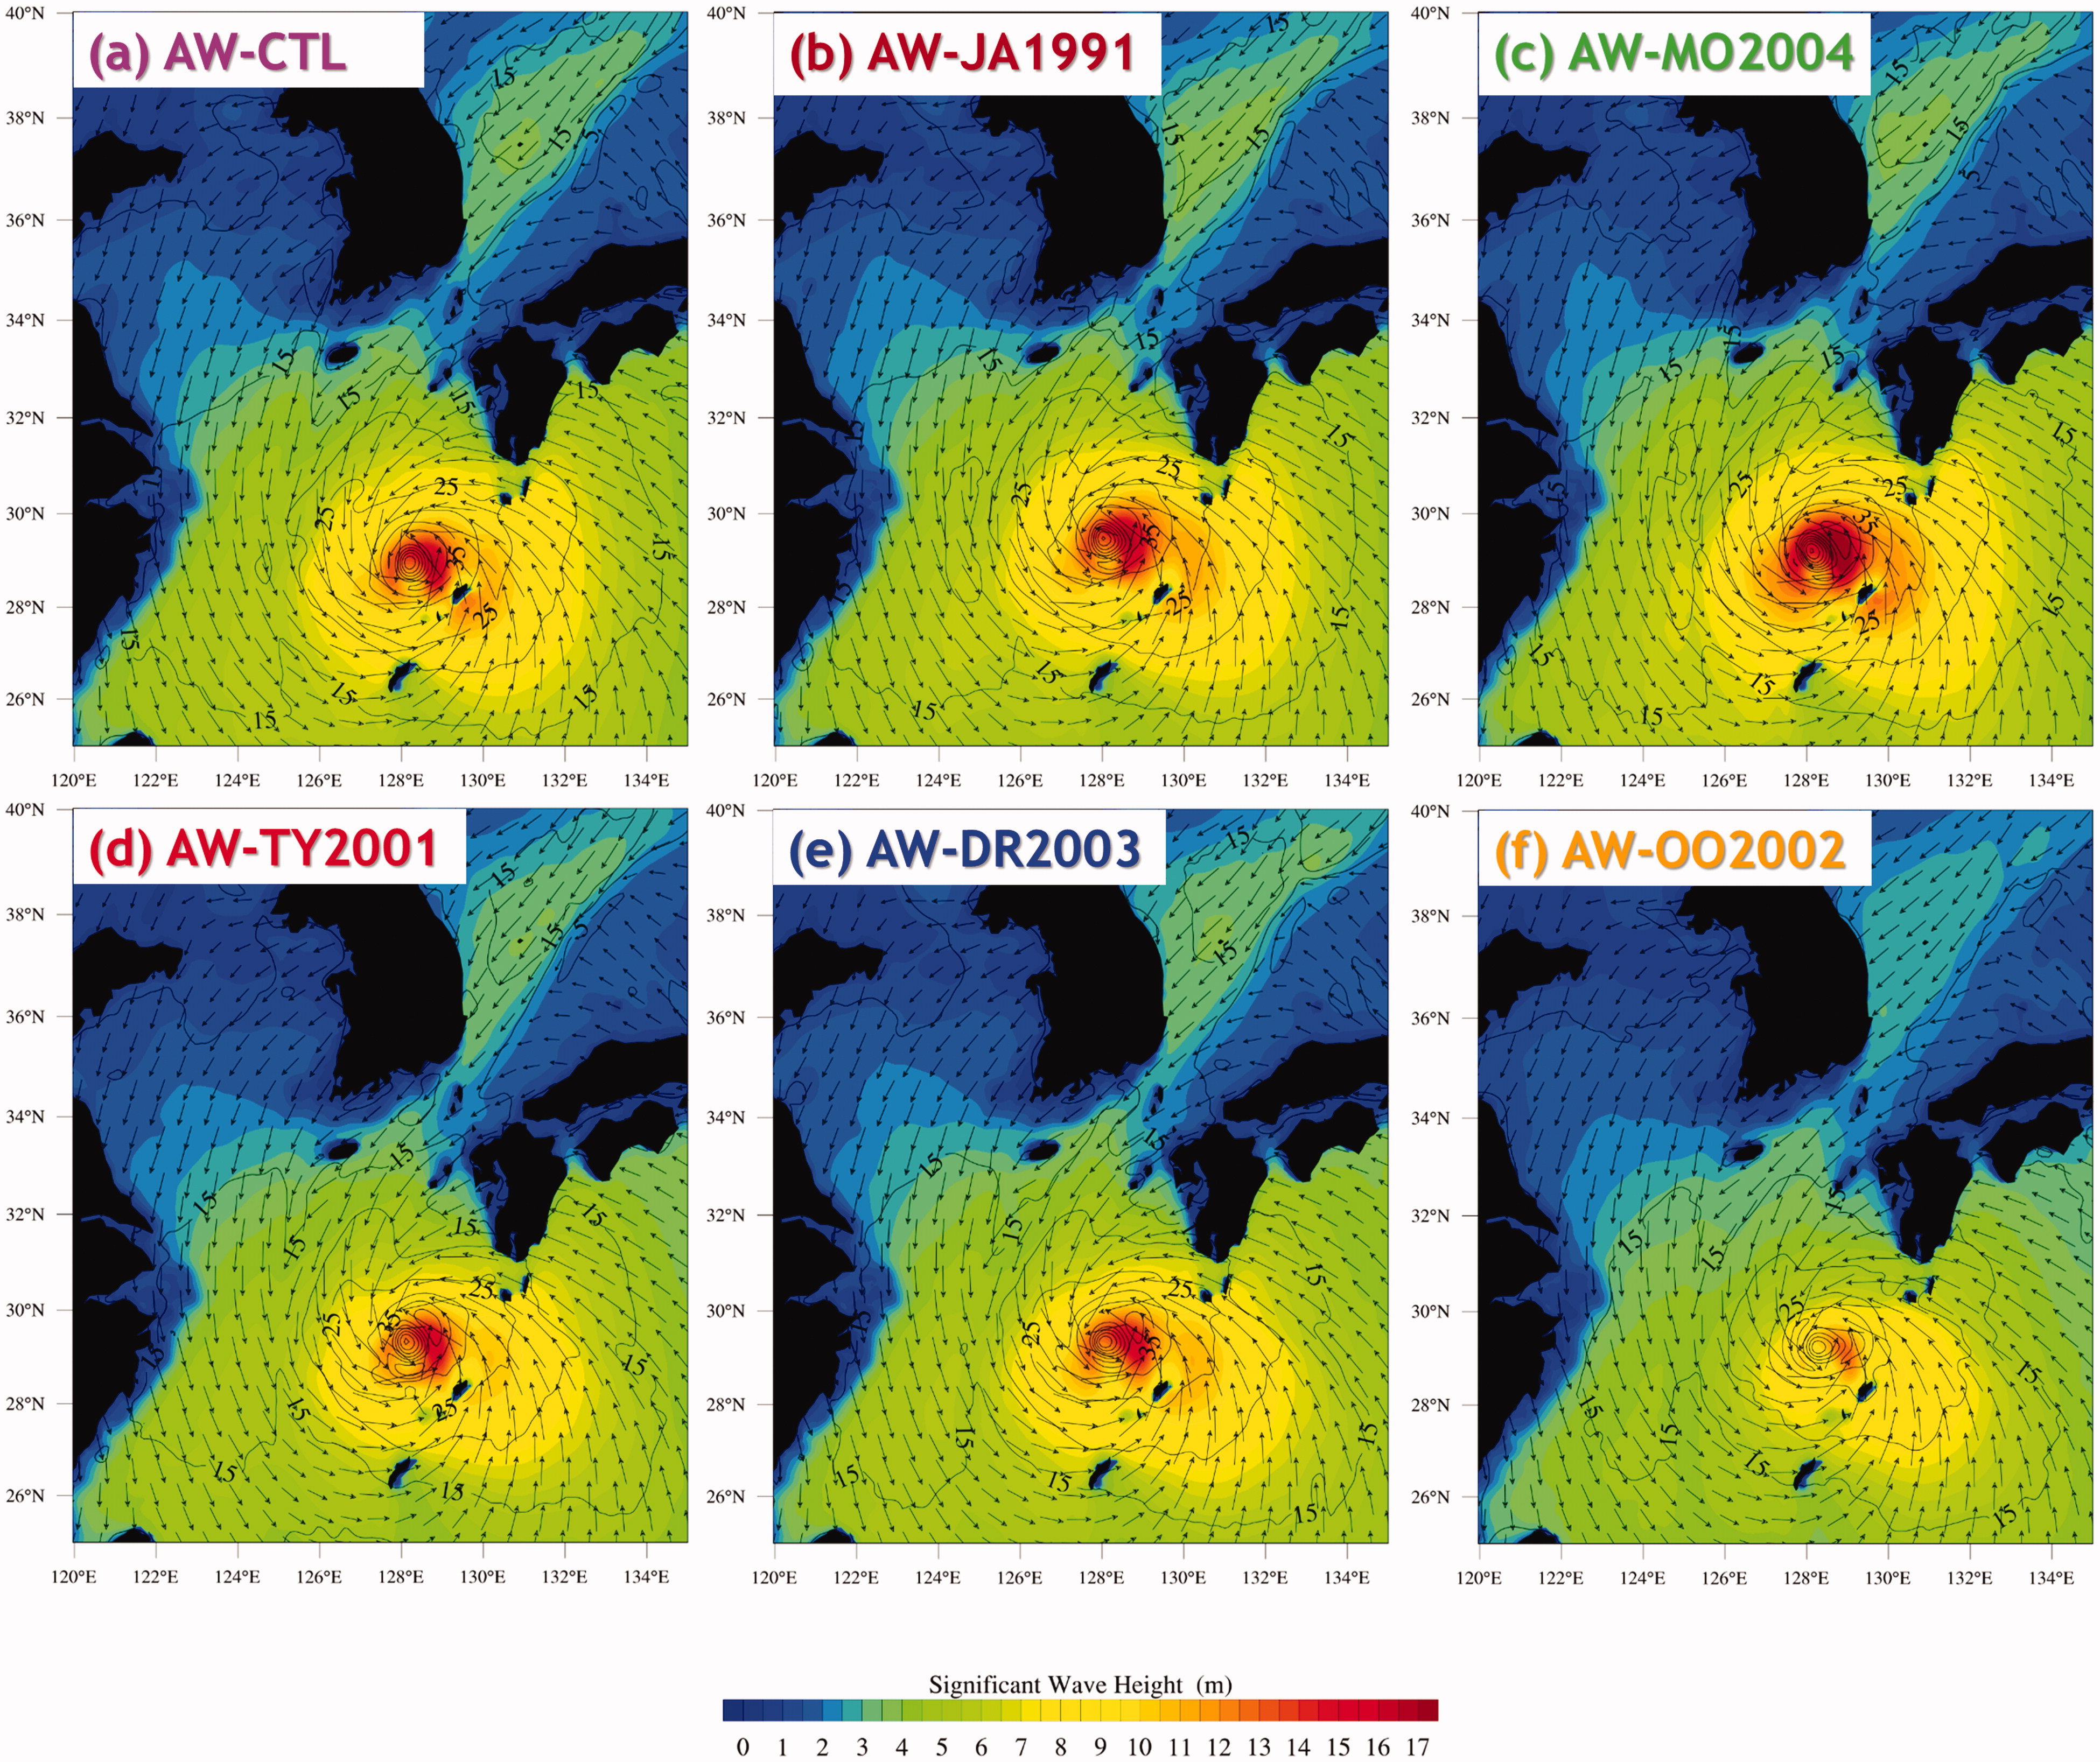
Fig. 6.
The same as Fig. 5, but for wind fields (arrows and contours) and significant wave height (colour shading).
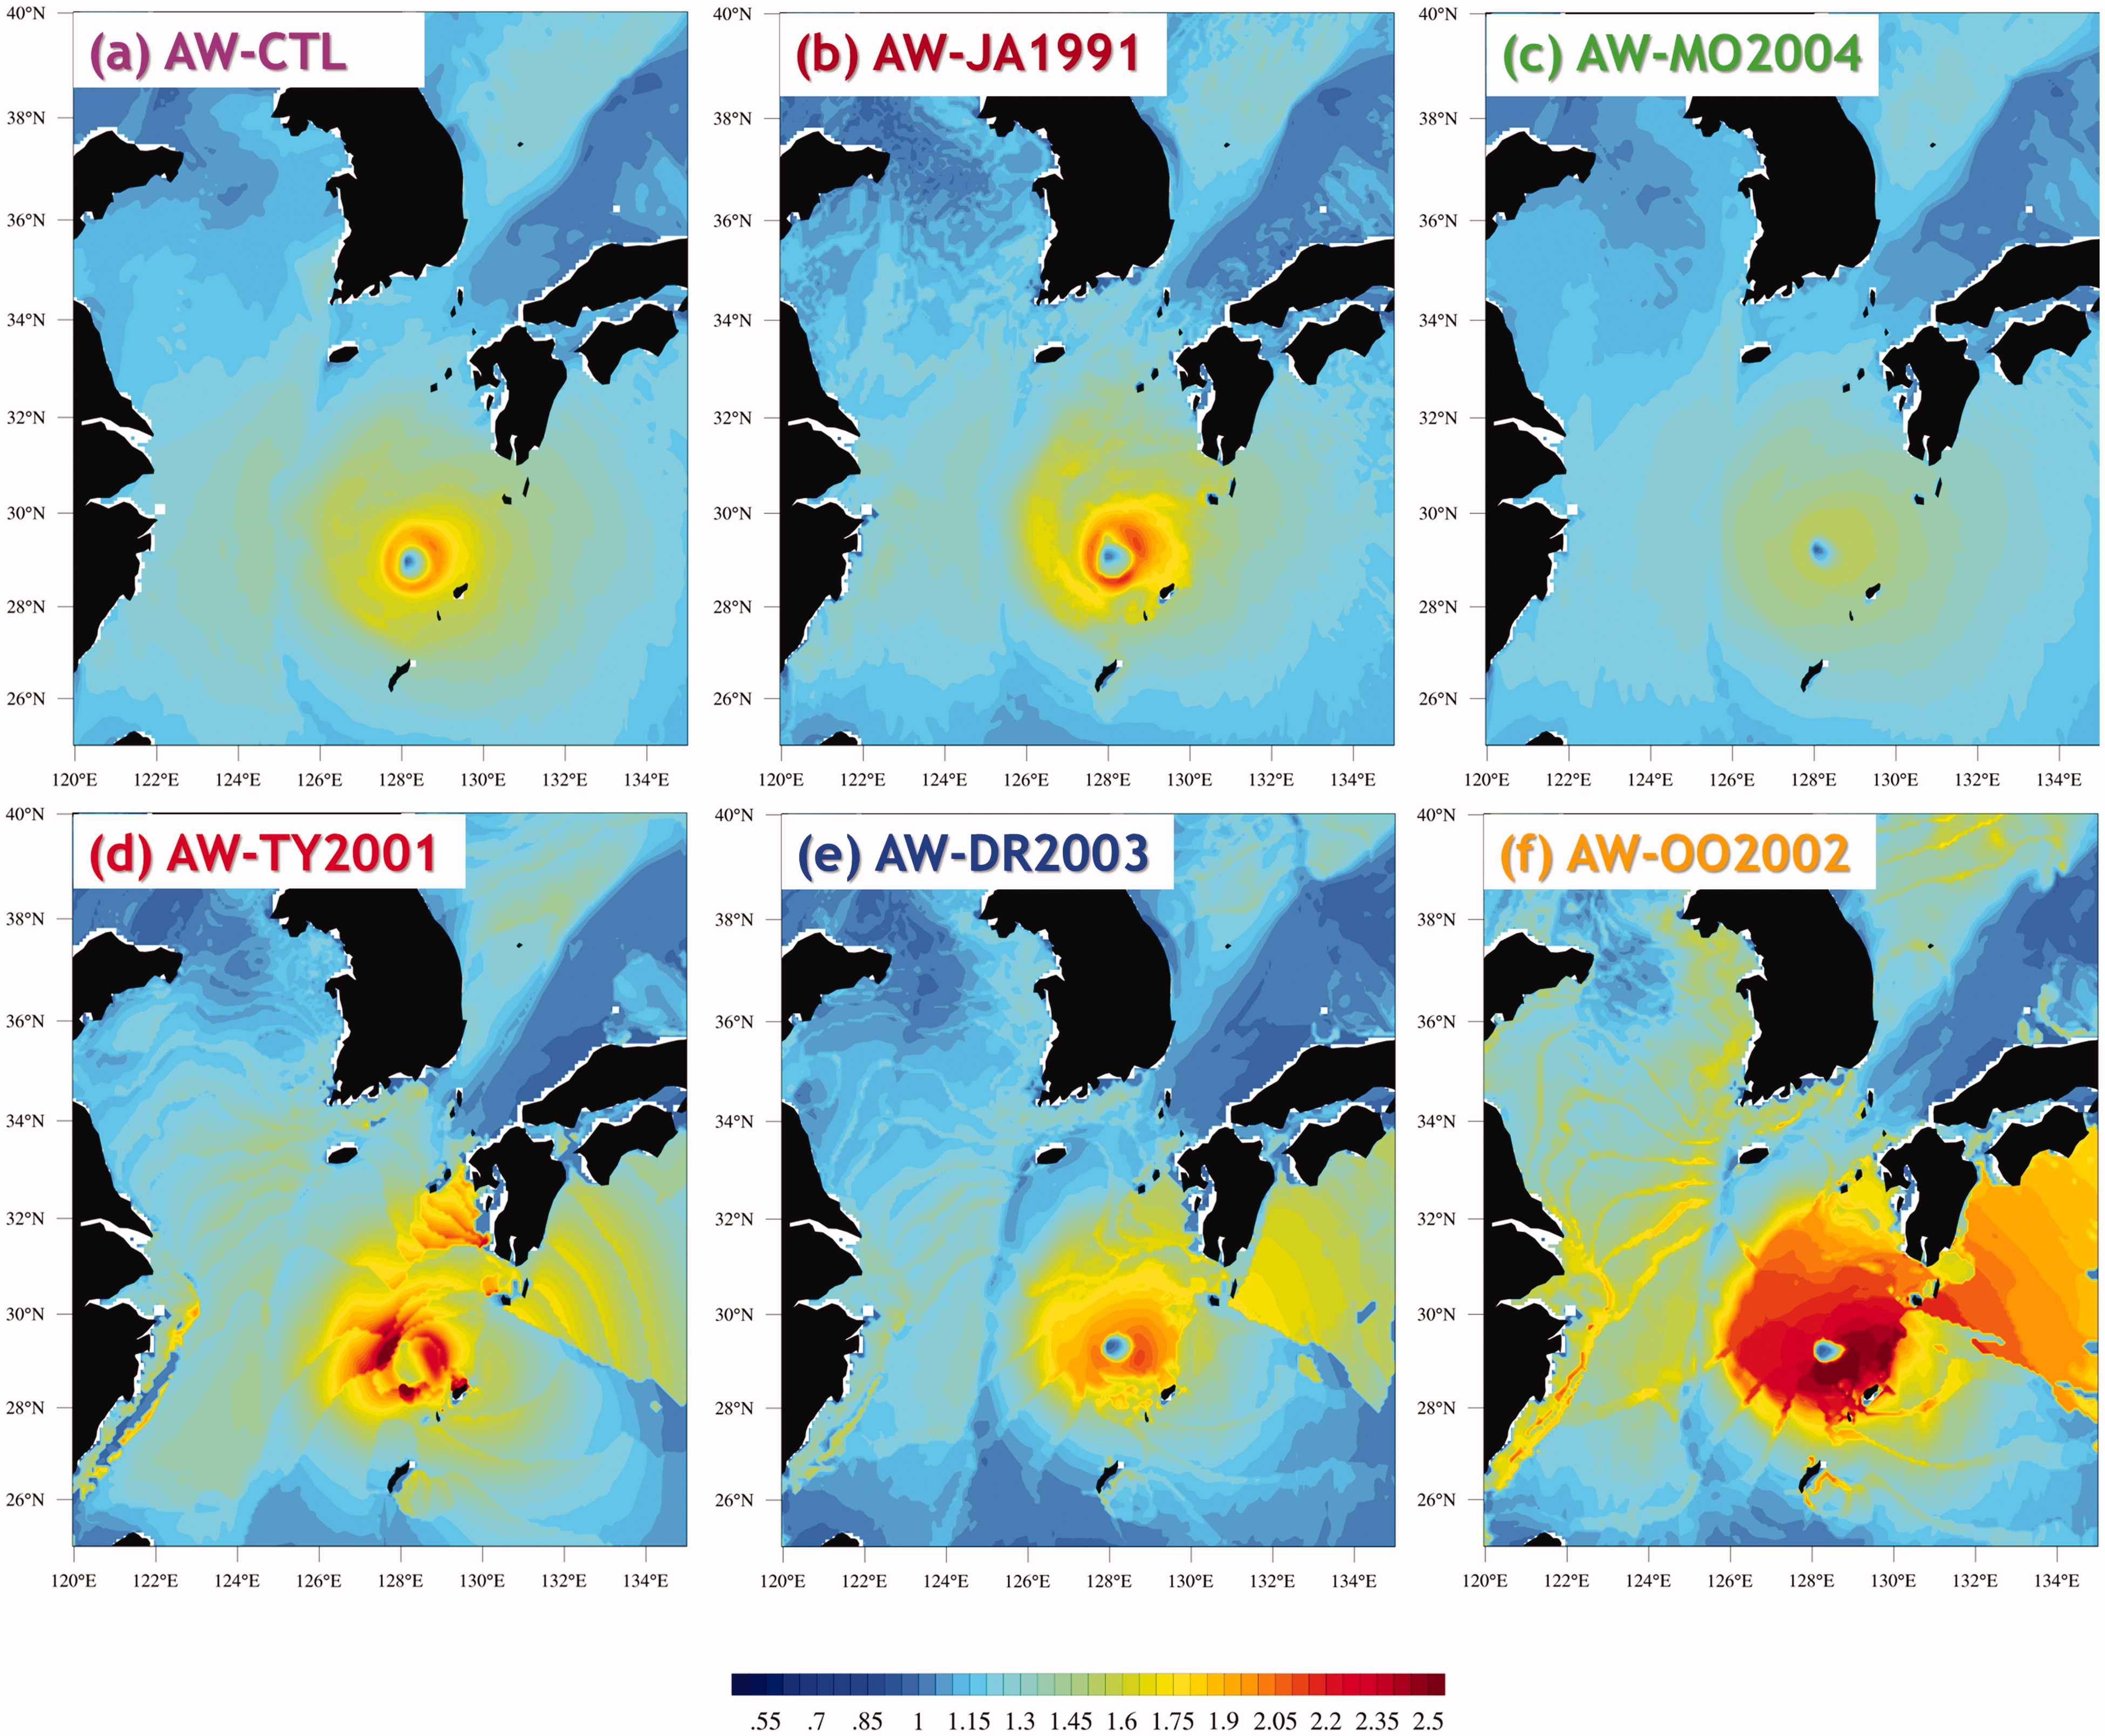
Fig. 7.
The same as Fig. 5, but for the ratio.
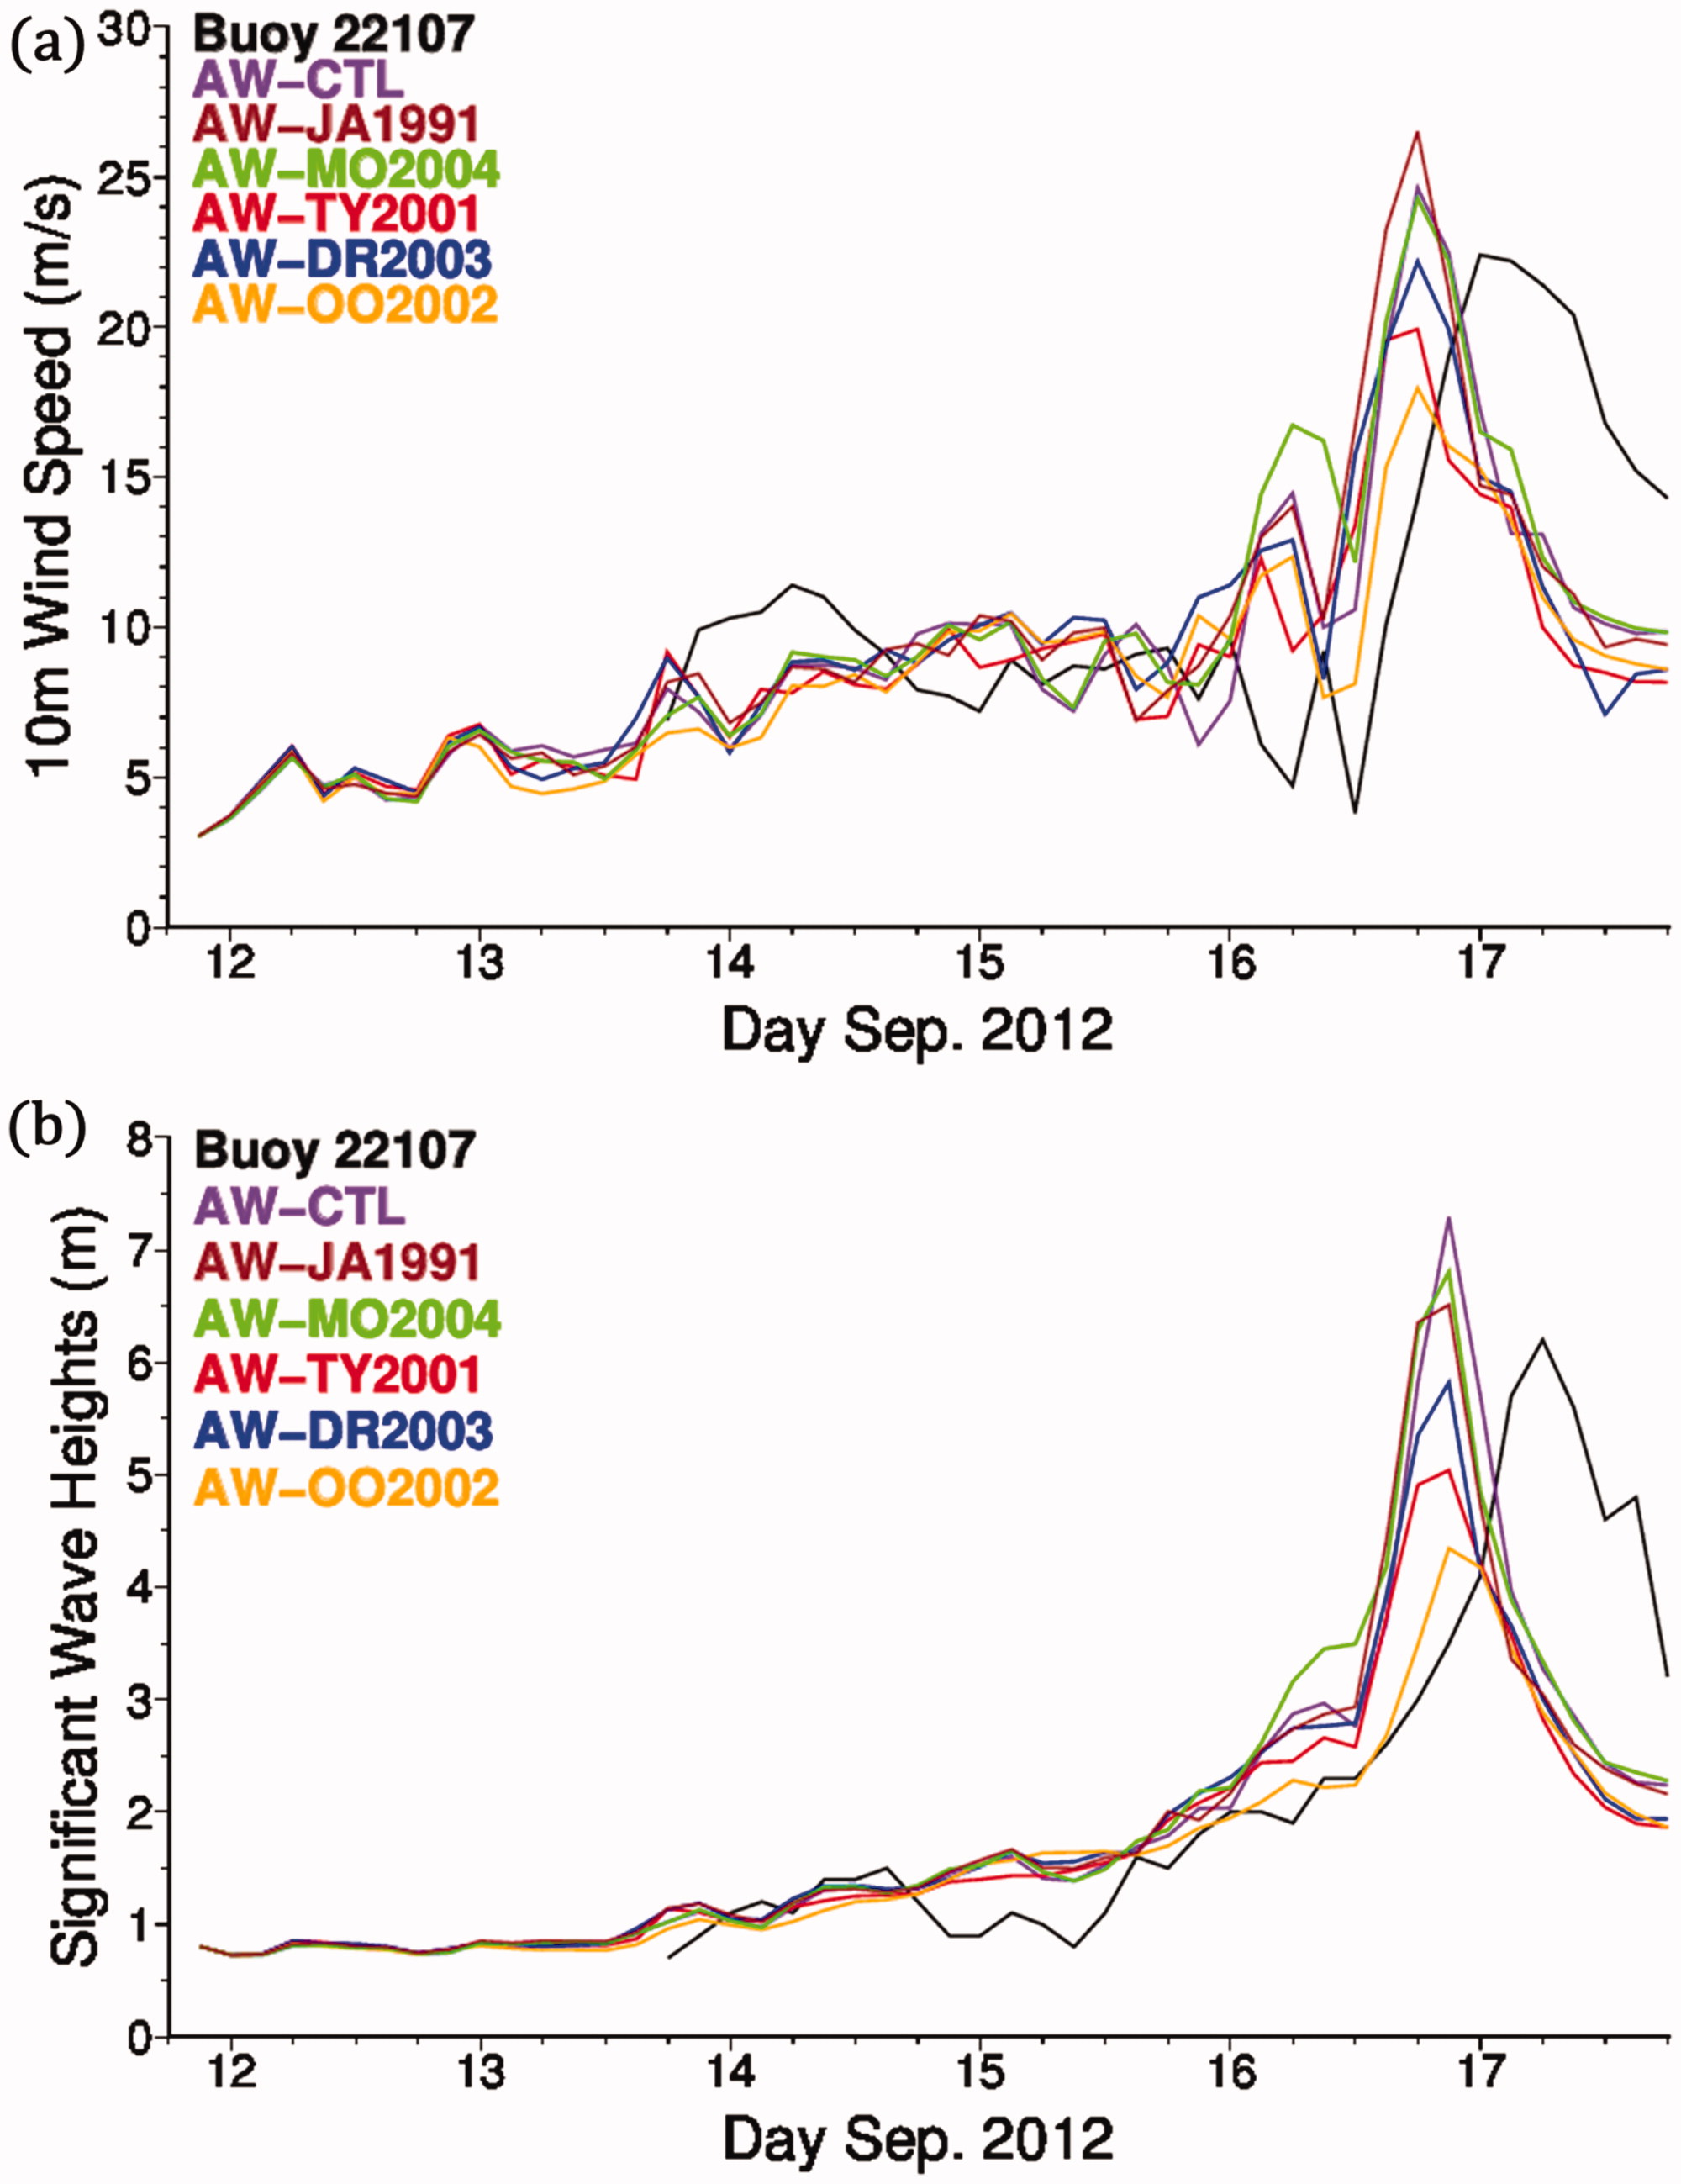
Fig. 8.
Time series of measured (black lines) and simulated (coloured lines) (a) wind speed and (b) significant wave height at Buoy 22107 (33.0833°N, 126.033°E), shown as a red star in Fig. 2a.
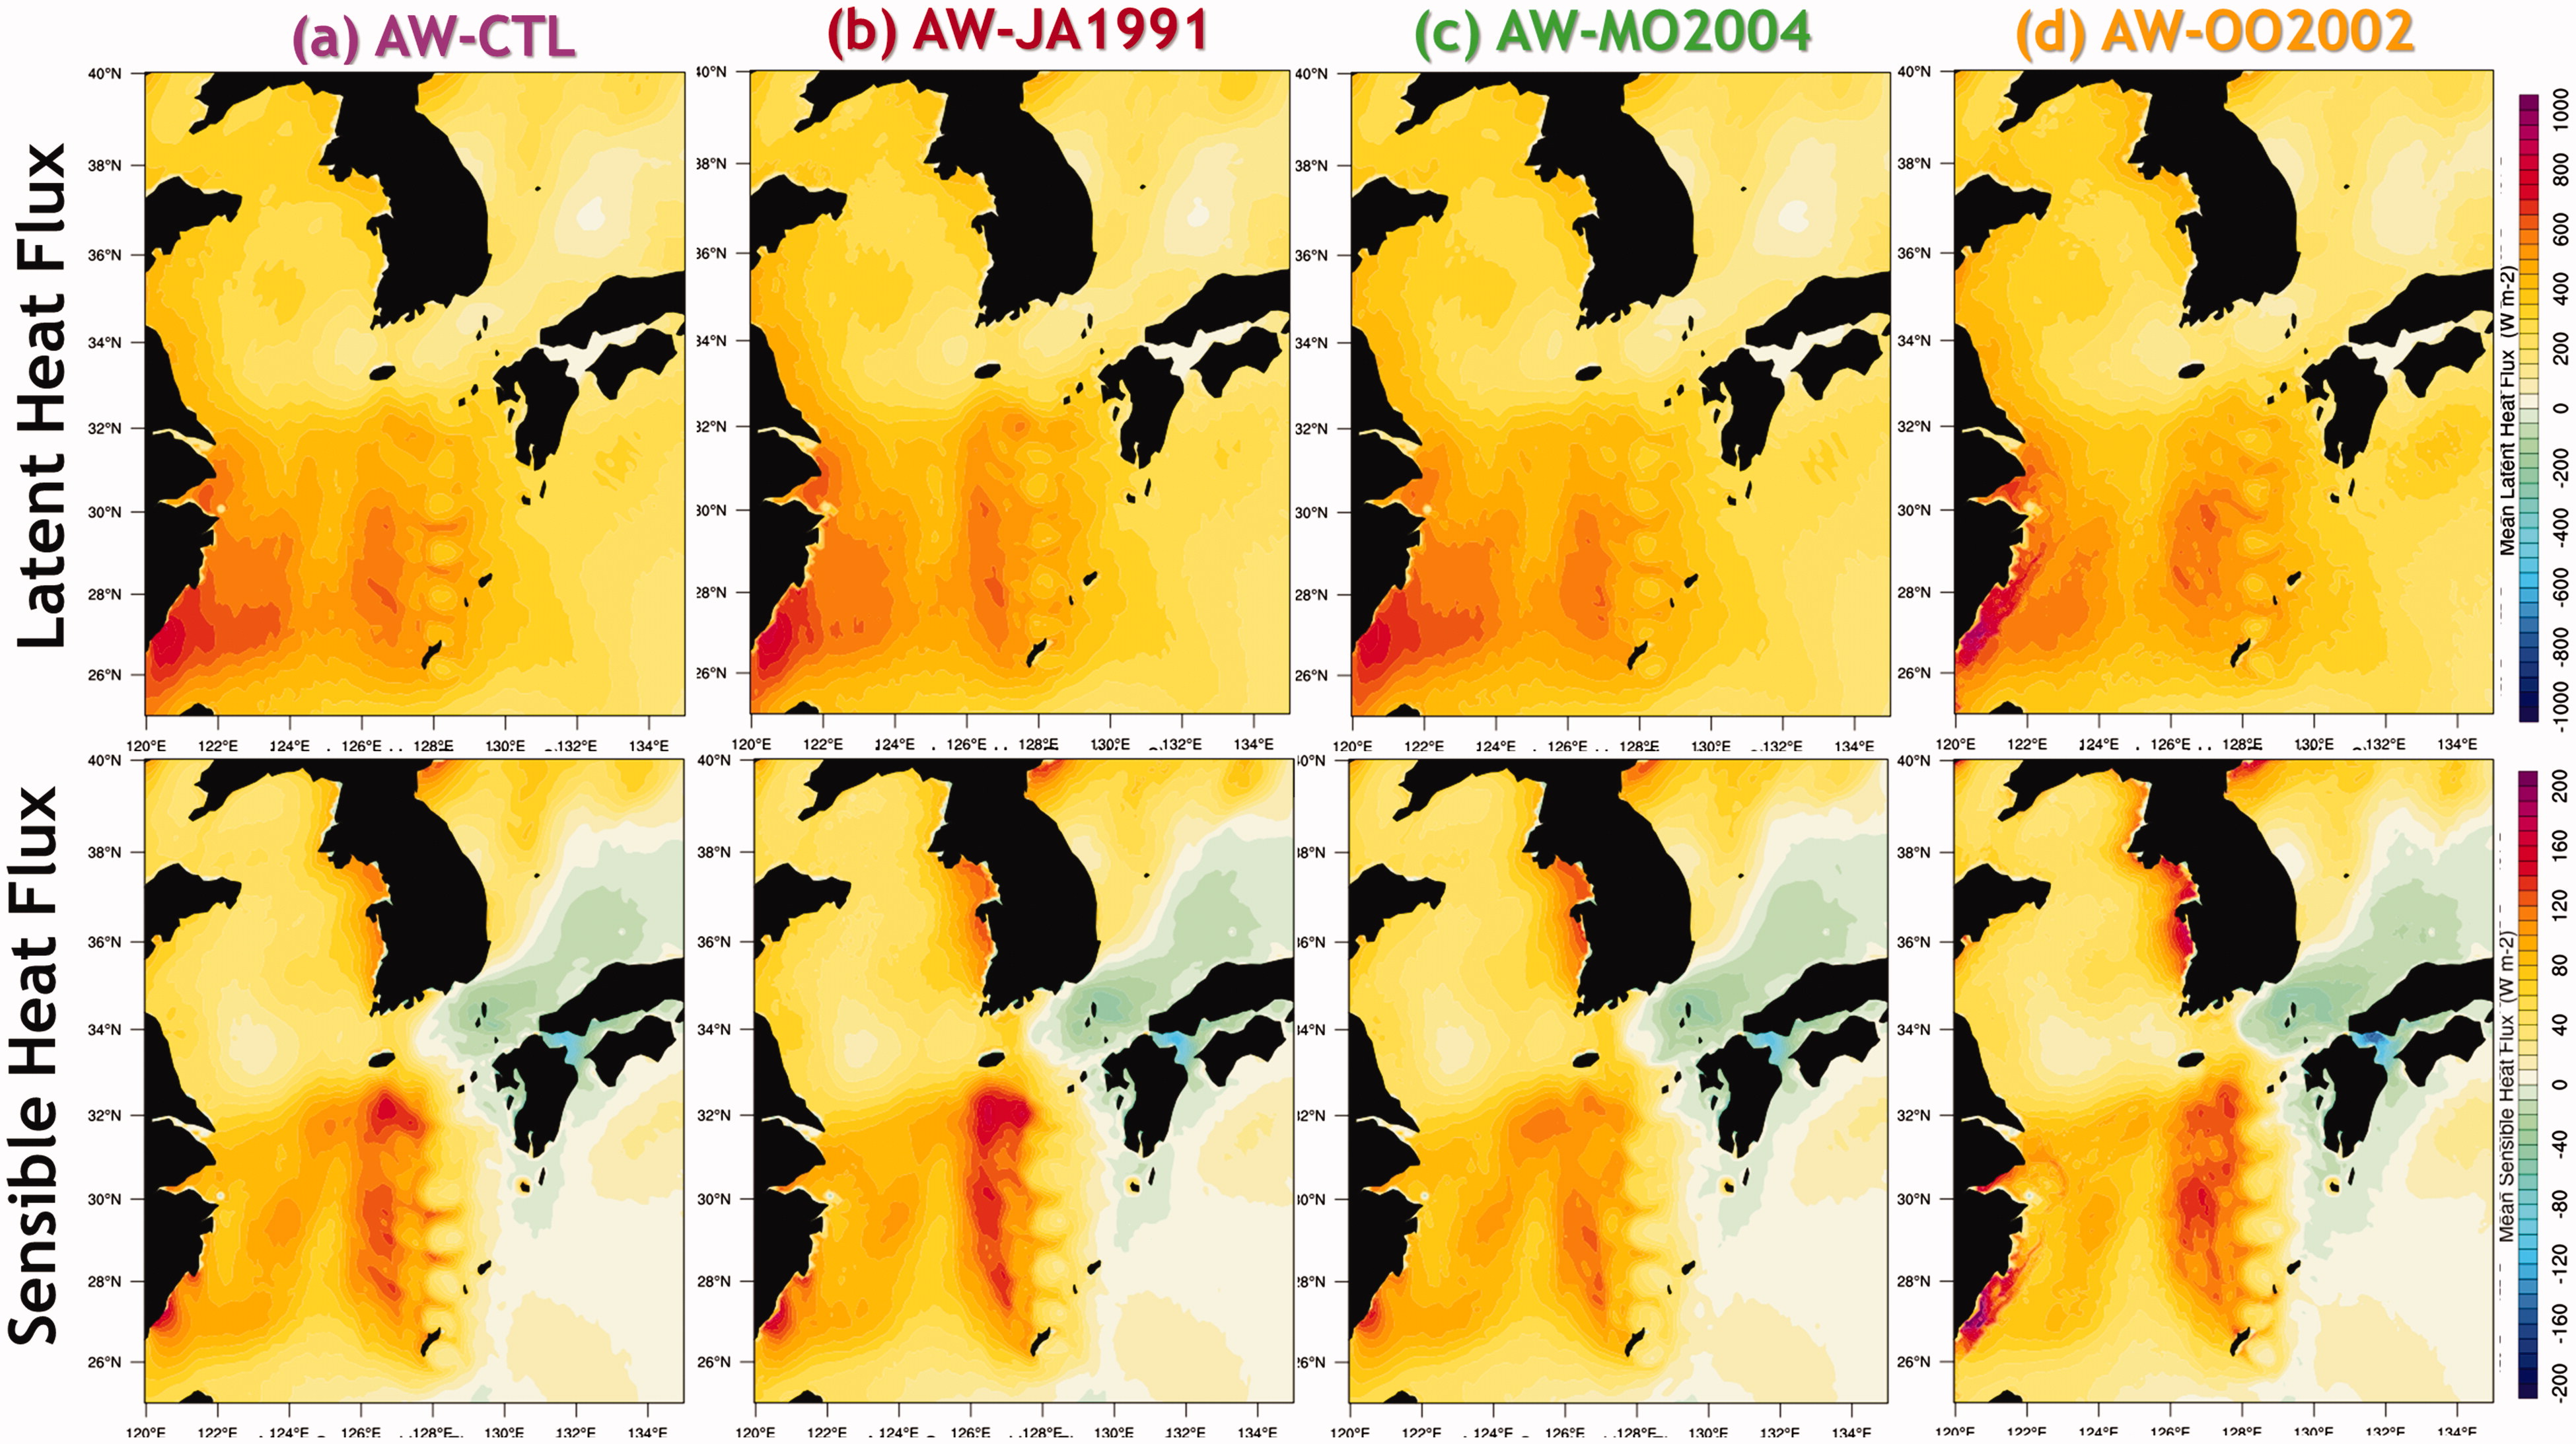
Fig. 9.
Horizontal distribution of daily mean latent (top row) and sensible (bottom row) heat fluxes calculated from experiments on September 16; (a) AW-CTL, (b) AW-JA1991, (c) AW-MO2004, (d) AW-OO2002.
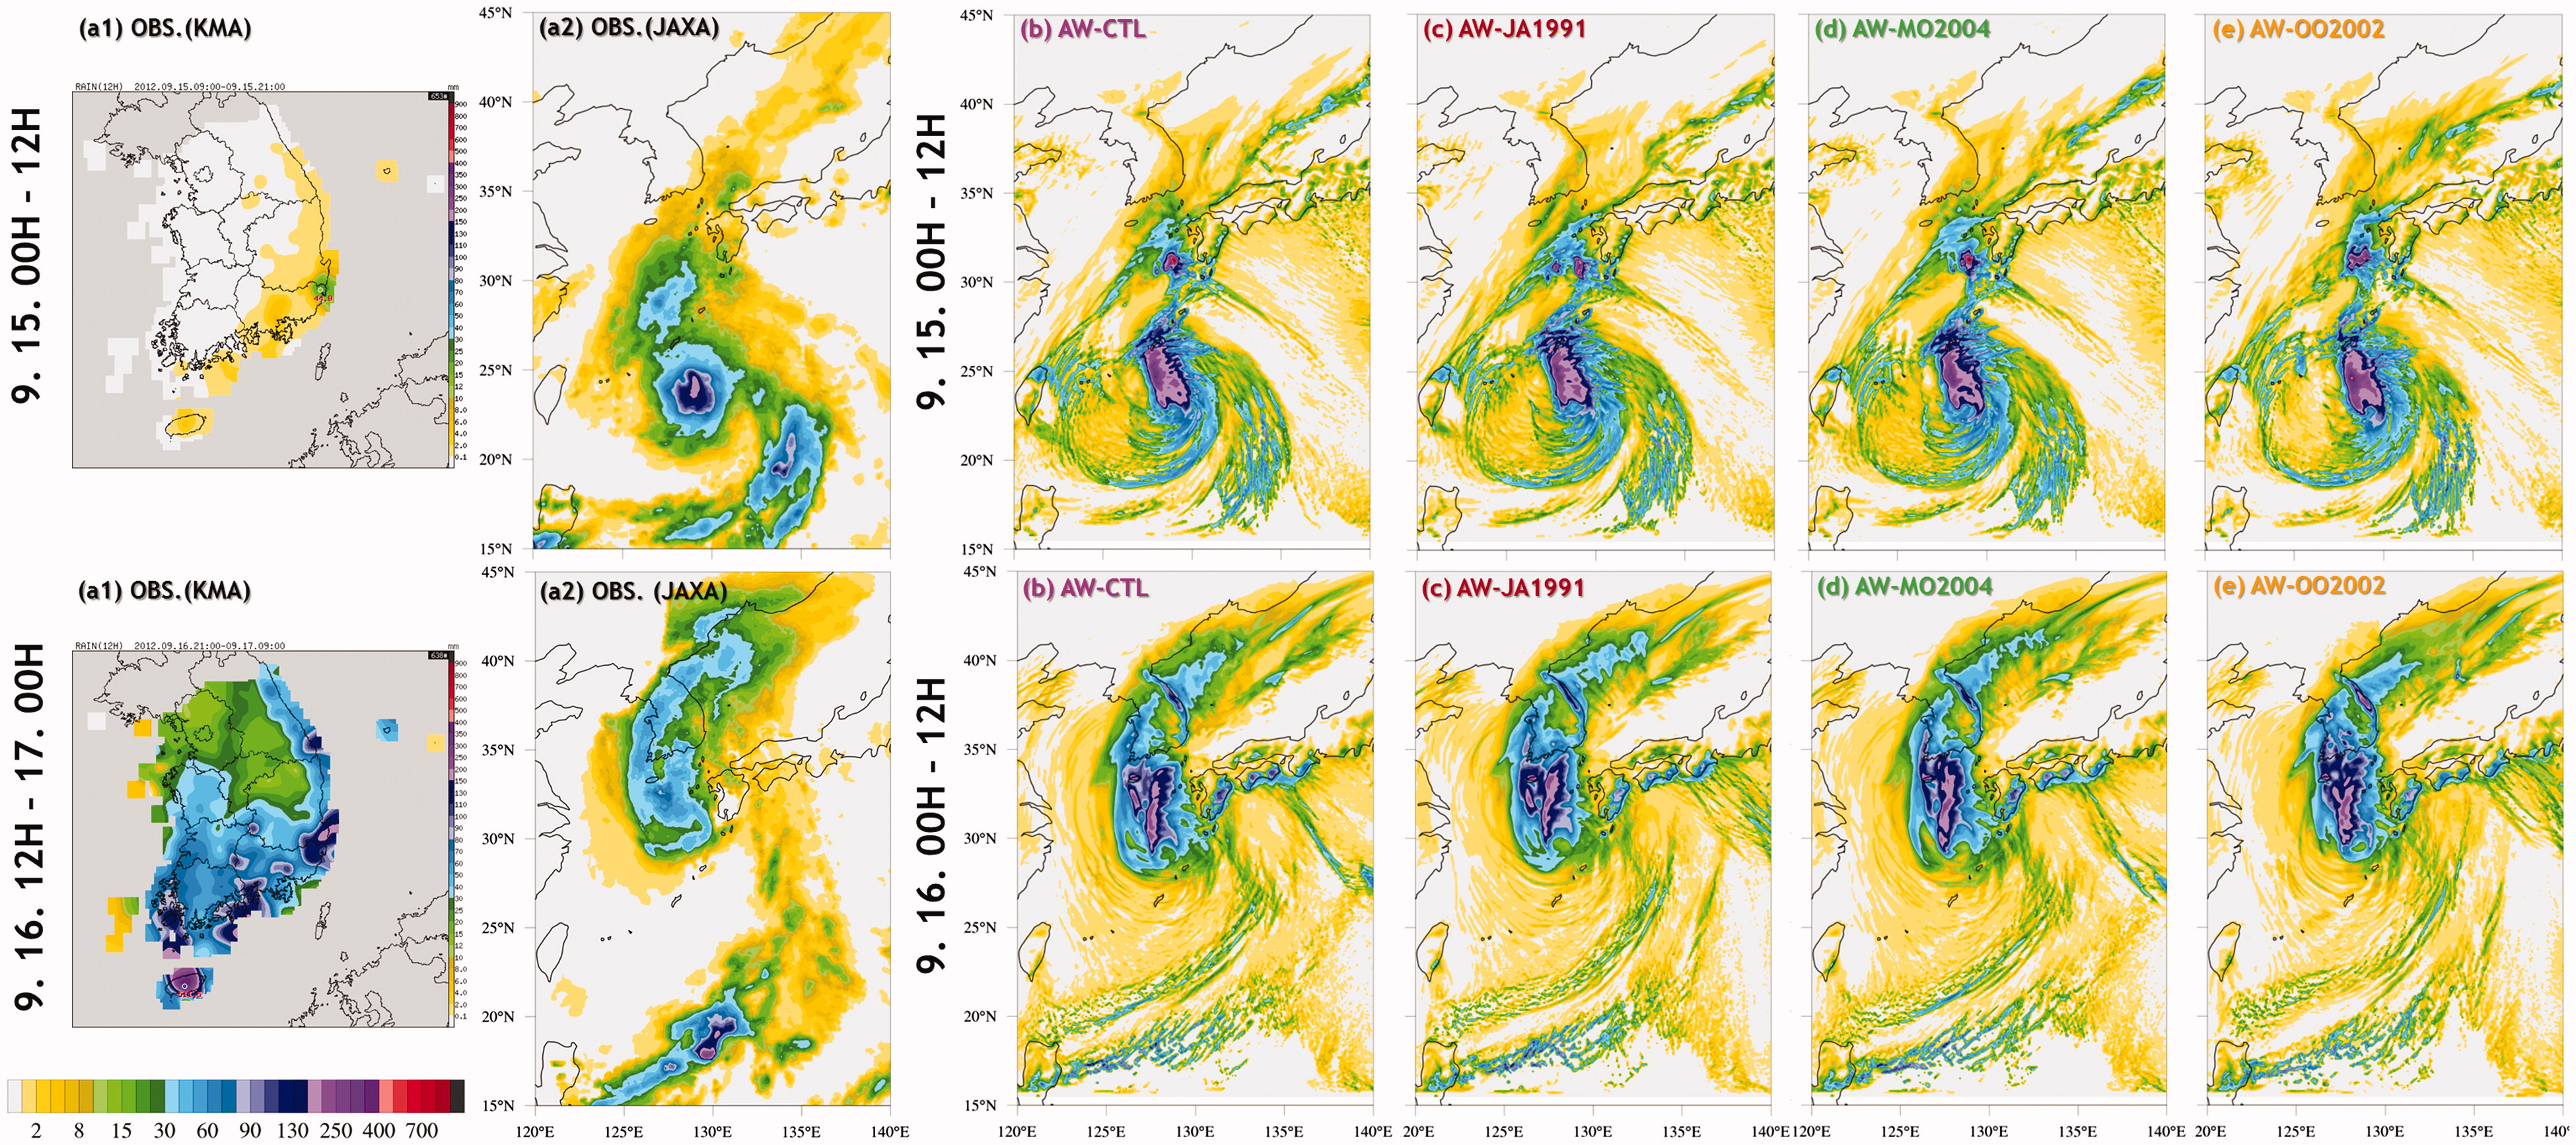
Fig. 10.
Comparison between measured and modelled 12 hours accumulated precipitation (shaded in colour): (a1) surface observations provided from the Korea Meteorological Administration (KMA), (a2) global rainfall observed by satellites, which is provided from the Japan Aerospace eXploration Agency (JAXA) Global Satellite Mapping of Precipitation (GSMap), (b) AW-CTL, (c) AW-JA1991, (d) AW-MO2004, (e) AW-OO2002.