Have a personal or library account? Click to login
Decadal differences of the diurnal temperature range in the Aral Sea region at the turn of the century Cover

Decadal differences of the diurnal temperature range in the Aral Sea region at the turn of the century

Open Access
|Jan 2018

Figures & Tables

Fig. 1.

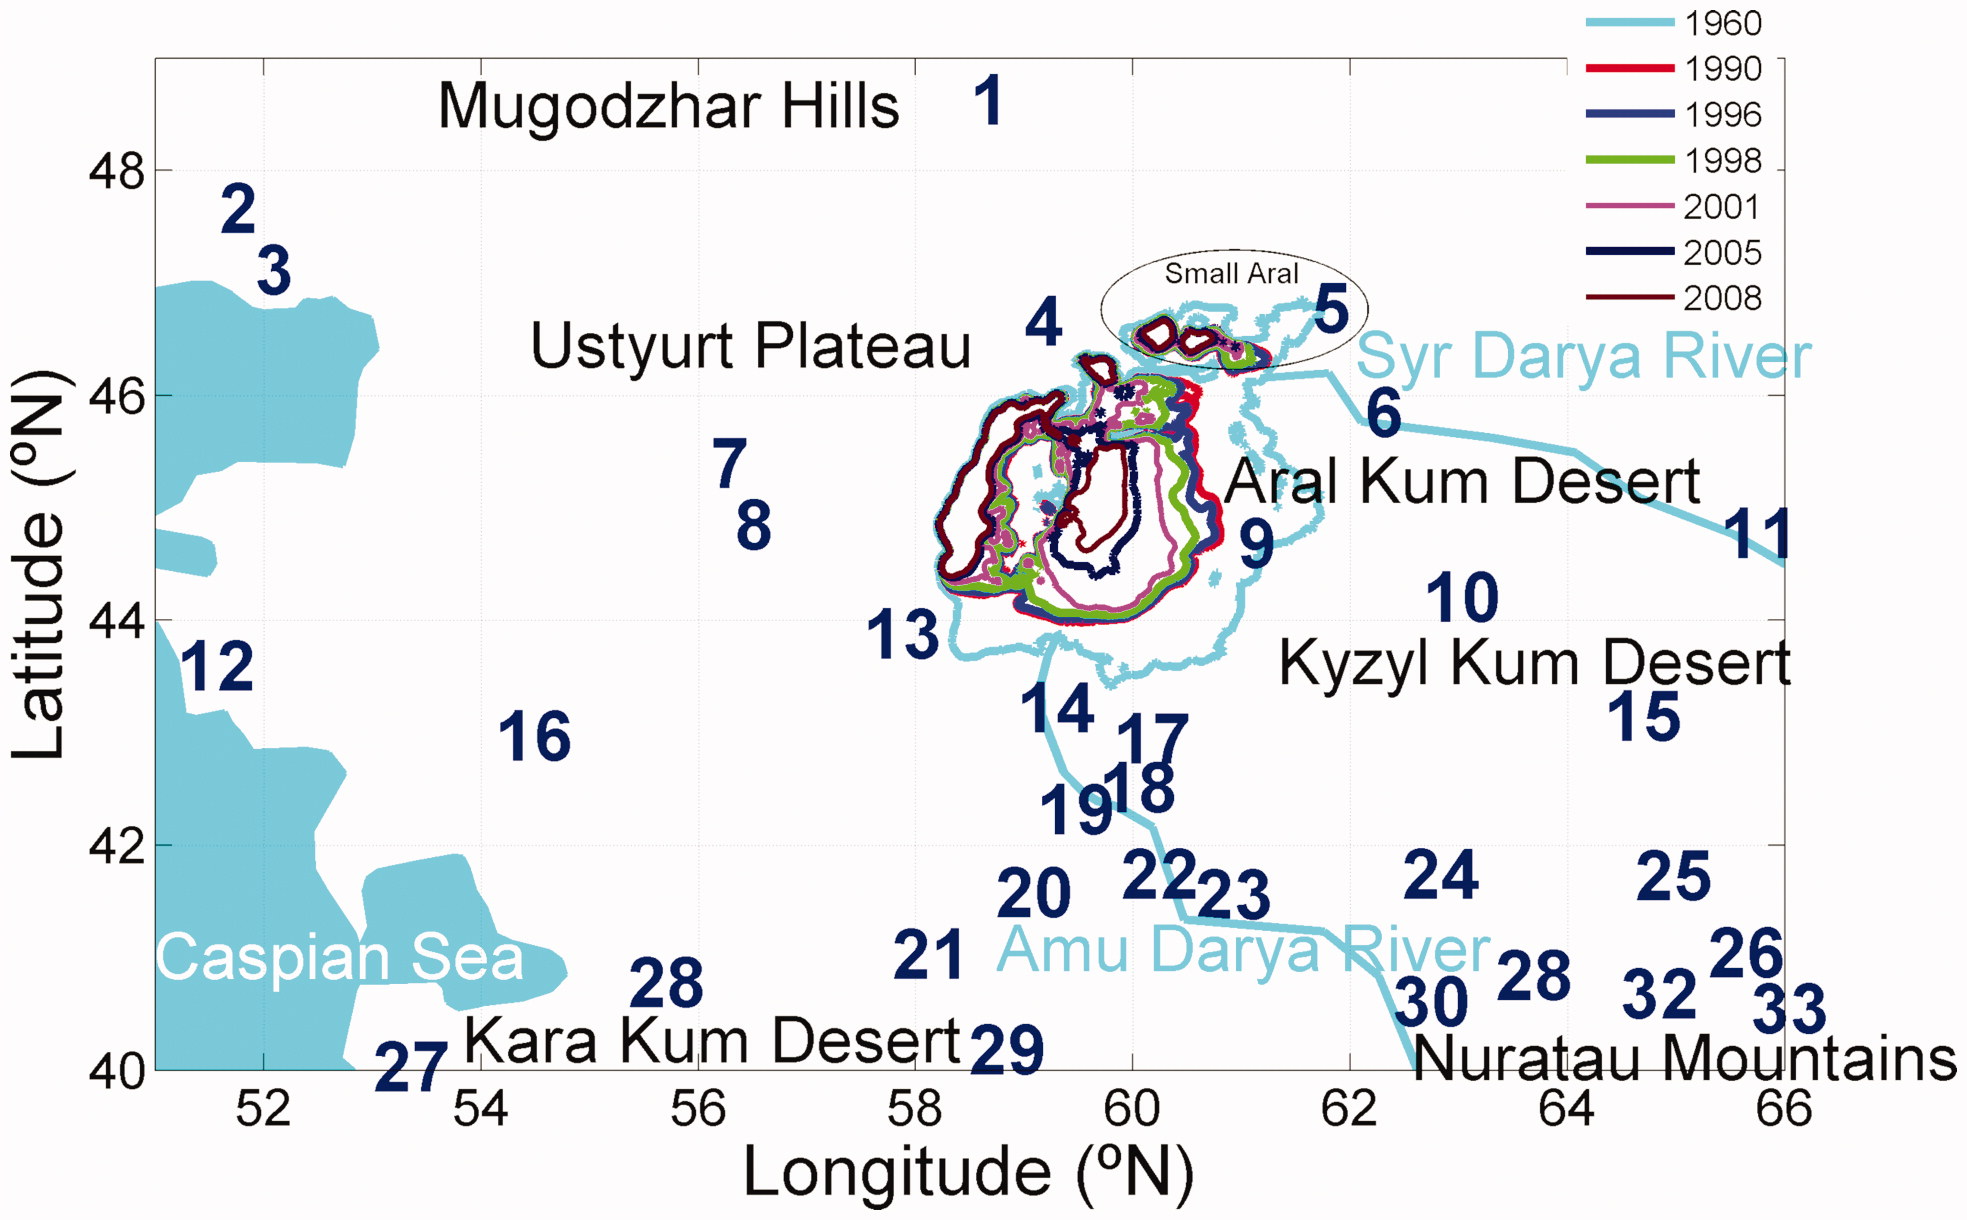
Map of the area studied presenting the different locations of the Aral Sea shoreline during its recession. The two main tributaries of the lake and other relevant geographical features of the region are also shown. The locations of the meteorological stations used in this study are indicated by their reference number (see Table 1).

Table 1.

Locations of the meteorological stations used in this study.
ReferenceRIHMI-WDC codeNameLat (°N)Lon (°E)High (m asl)135532MUGODZARSKAJA48.63358.500398235605MAHAMBET47.66751.583–18335700ATYRAU47.11751.917–22435739AQKKUM46.66759.000111535746ARALSKOE MORE46.78361.65062635849KAZALINSK45.76762.11768735925SAM45.40056.11788838023KARAKALPAKIJA44.85056.333126938044UQLY44.58360.933551038049IRIK-RABAT44.06762.900881138062KYZYLORDA44.85065.5001301238111SHEVEHENKO43.60051.183–281338141JASLYK43.88357.5171281438149KUNGRAD43.08358.933641538178AK-BAJTAL43.15064.3332341638232AKKUDUK42.96754.117781738262CHIMBAJ42.95059.817661838264NUKUS42.45059.617771938267KENEURGENCH42.30059.133712038383SHASENEM41.58358.717622138388EKEZHE41.03357.767622238392DASHKHOVUZ41.75059.817822338396URGENCH41.56760.5671012438403BUZAUBAJ41.75062.467982538413TAMDY41.73364.6172372638427MASHIKUDUK41.05065.2832002738507TURKMENBASHI40.03352.983902838511CHAGYL40.78355.3331152938529DEVERZE40.18358.483843038545DARGANATA40.46762.2831423138551DZANGELDY40.85063.3332083238553AYAKAGITMA40.68364.4832193338565NURATA40.55065.683485
Fig. 2.

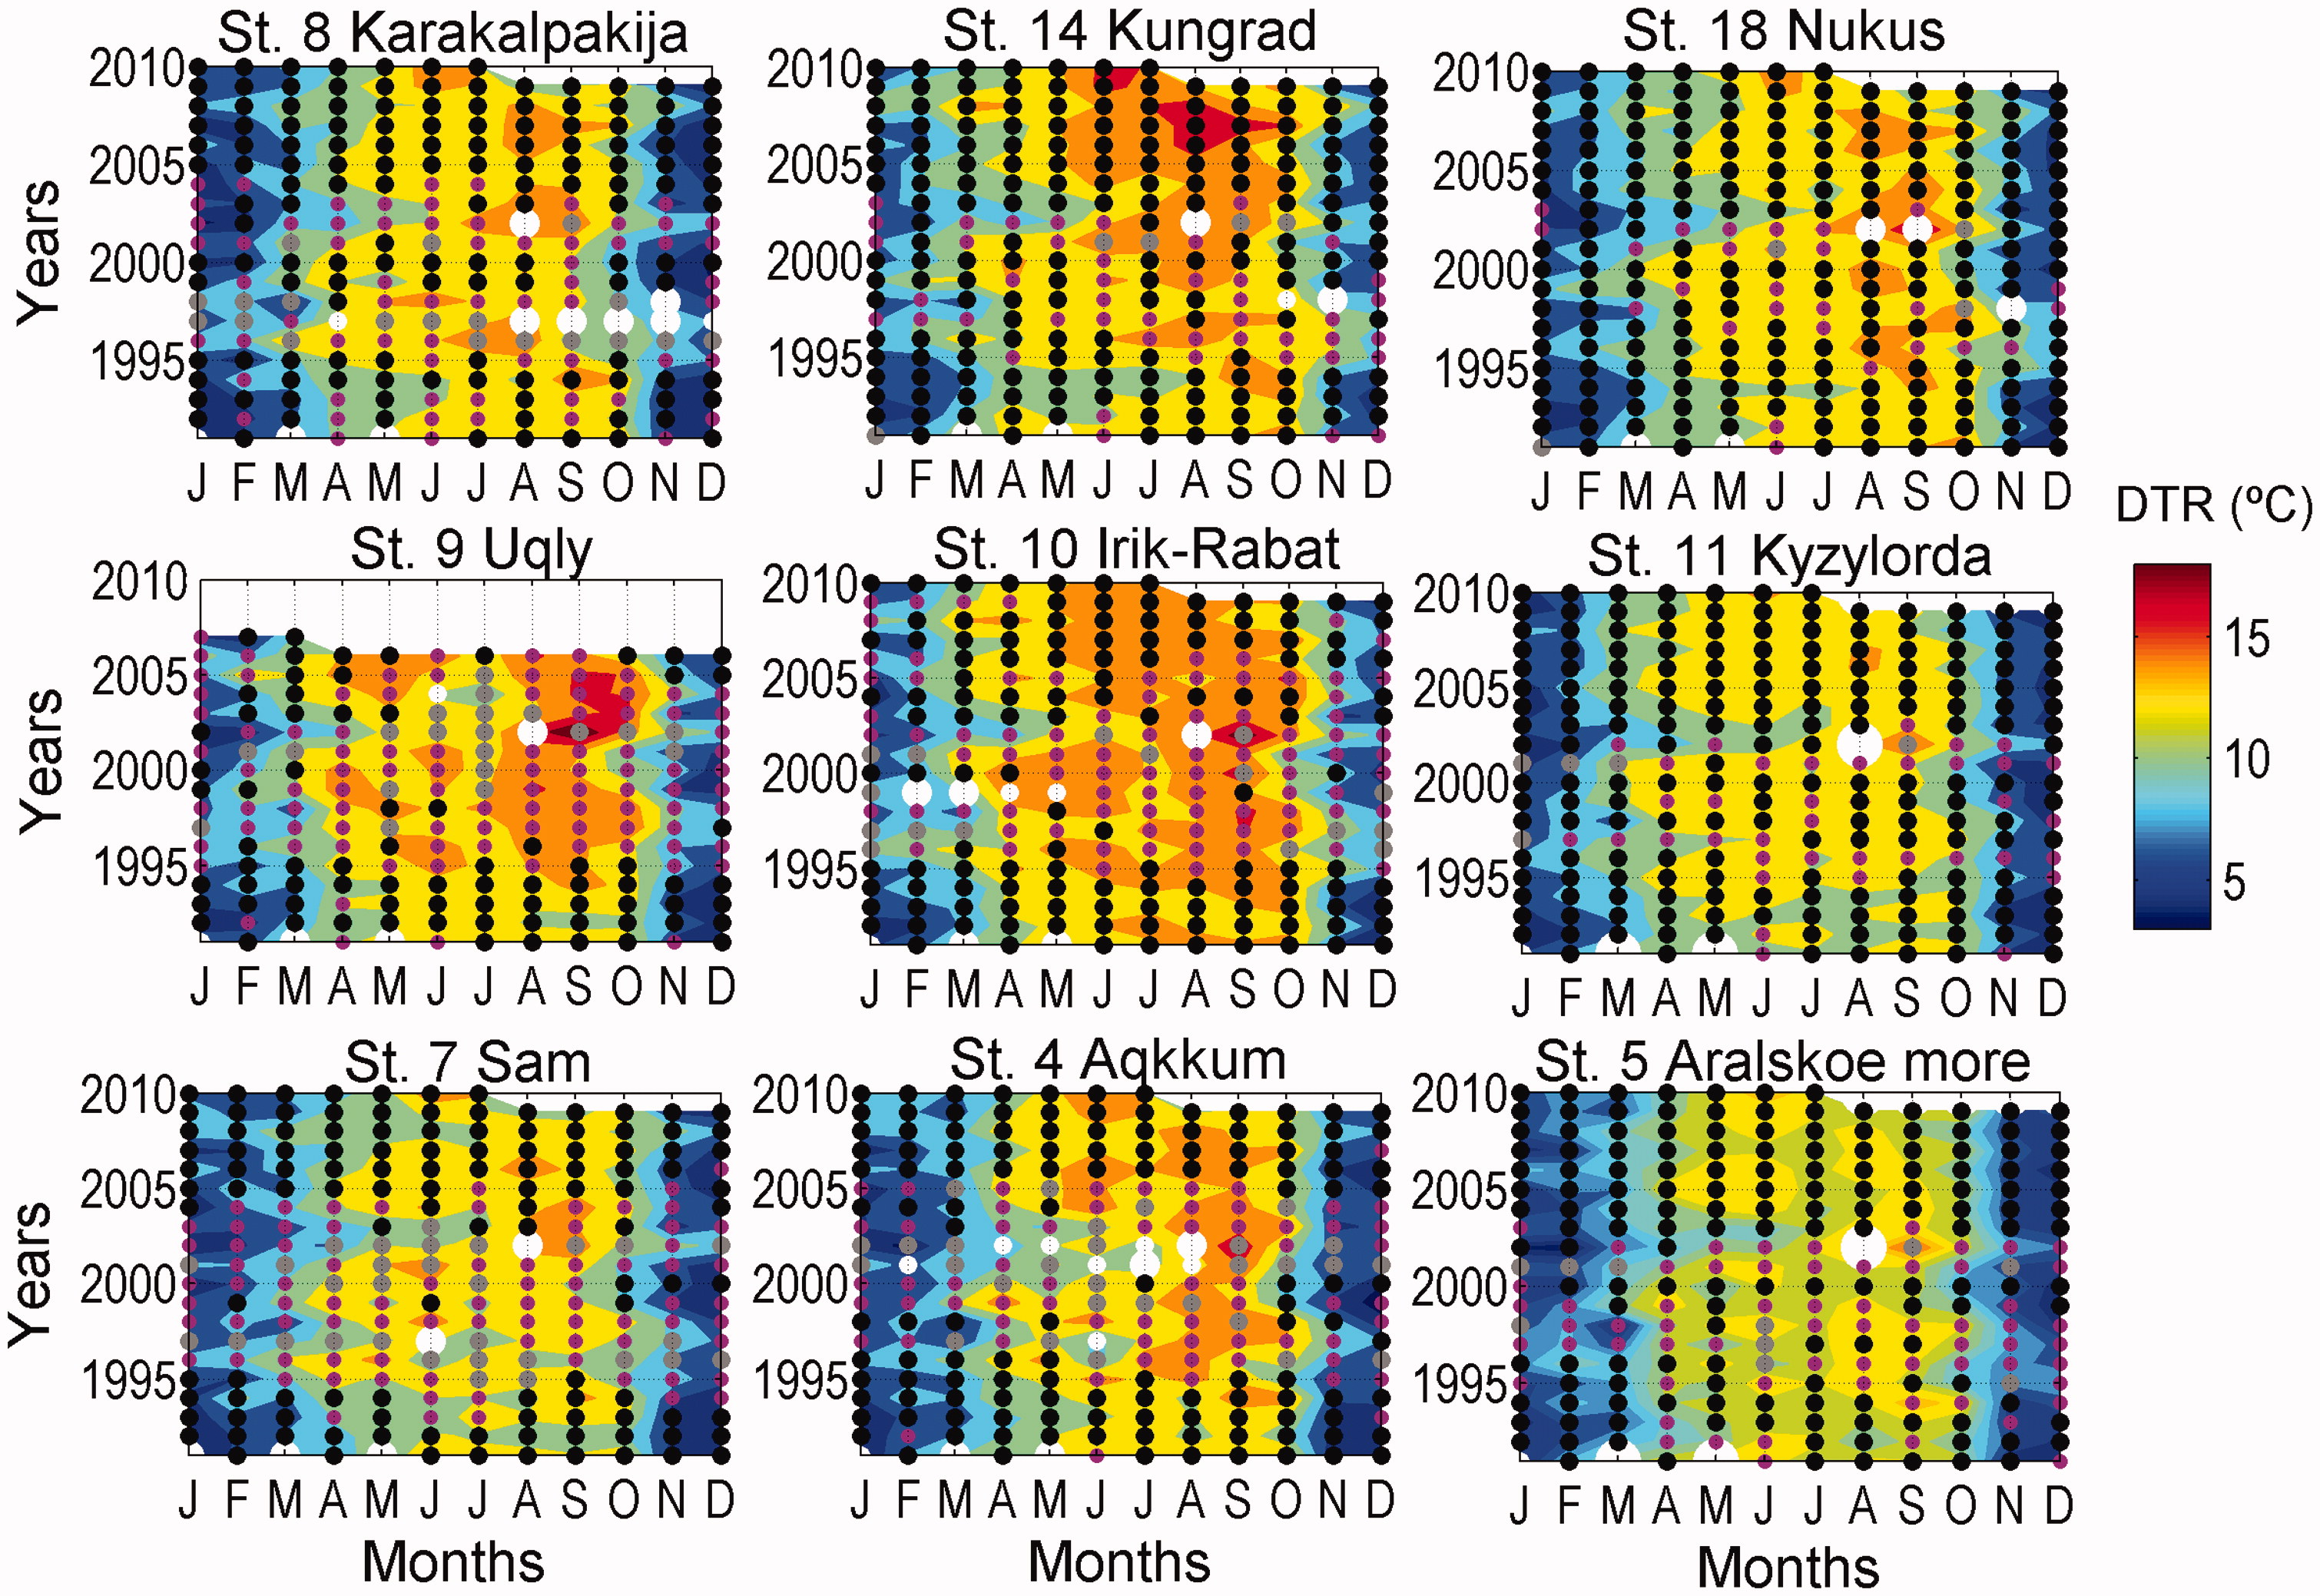
Monthly mean of the DTR from 1991 to 2010 at several representative stations. On the plots, large white circles indicate the months in which there were no data and the small different coloured circles indicate the number of missing days in each month: white circles more than 85%, grey circles between 80 and 50%, magenta circles between 50 and 15% and black below 15%.
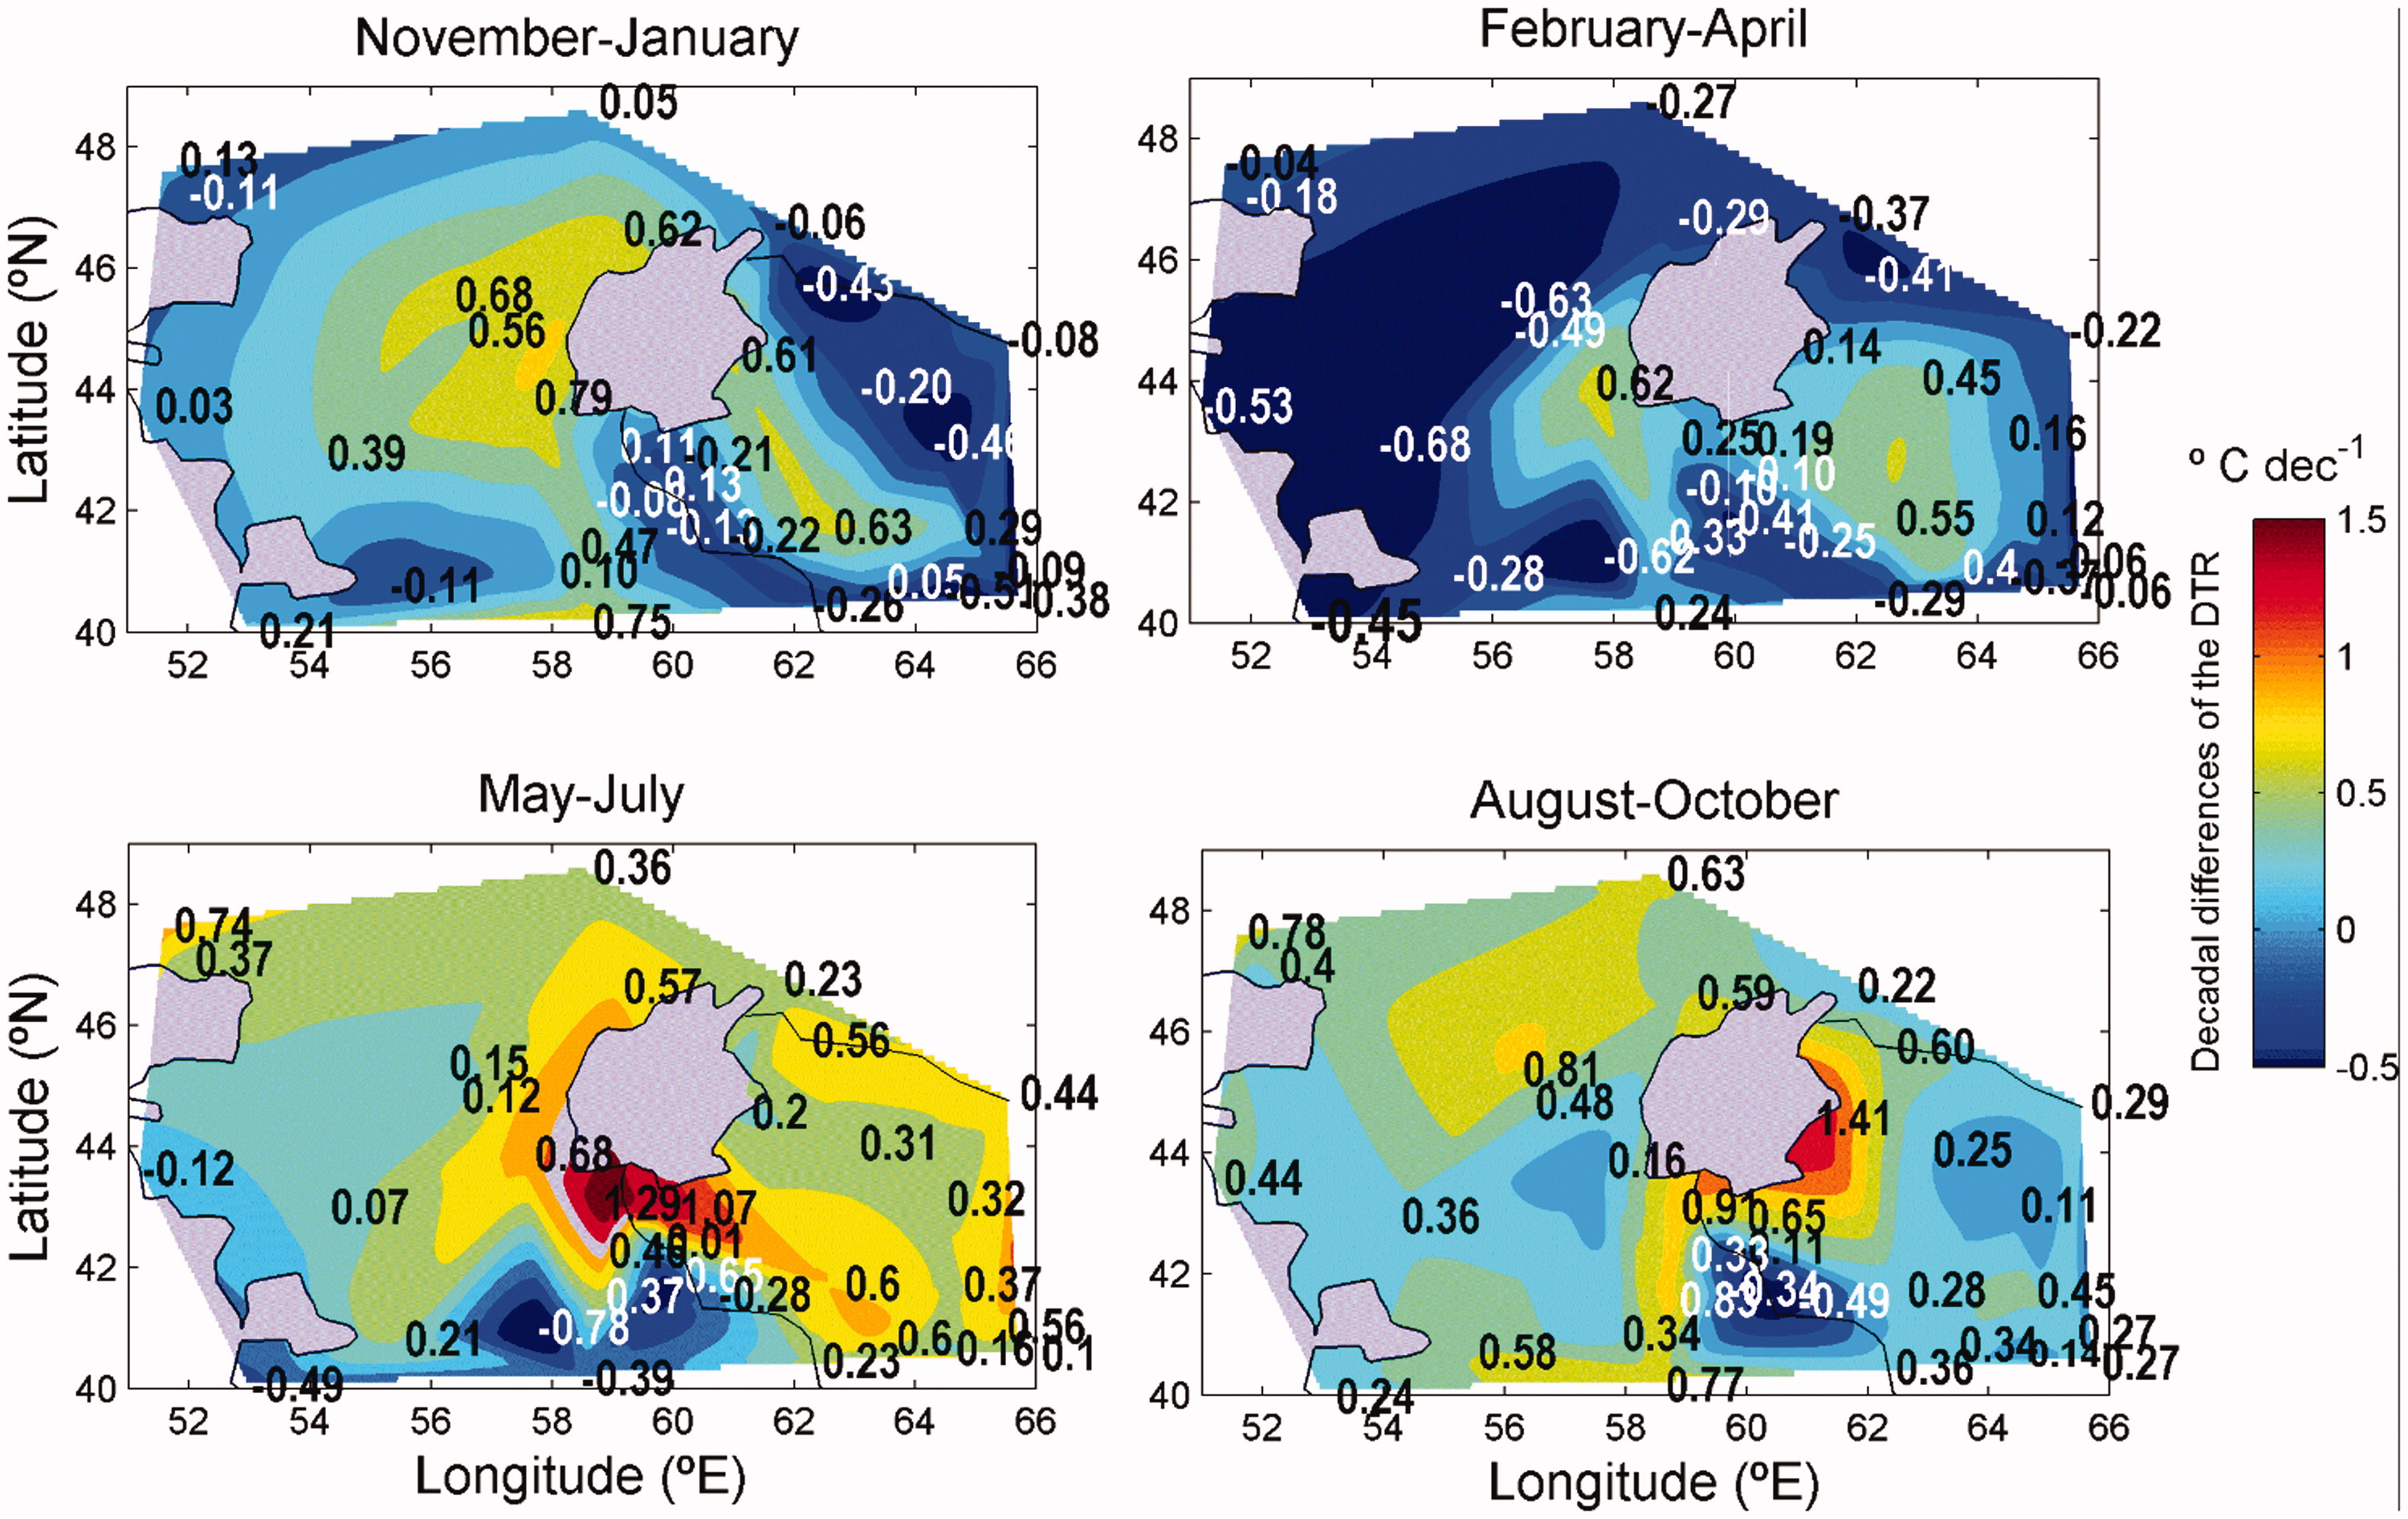
Fig. 3.

Averaged seasonal differences of the monthly mean DTR between two consecutive decades starting from 1991. The averaged periods are indicated above each panel.
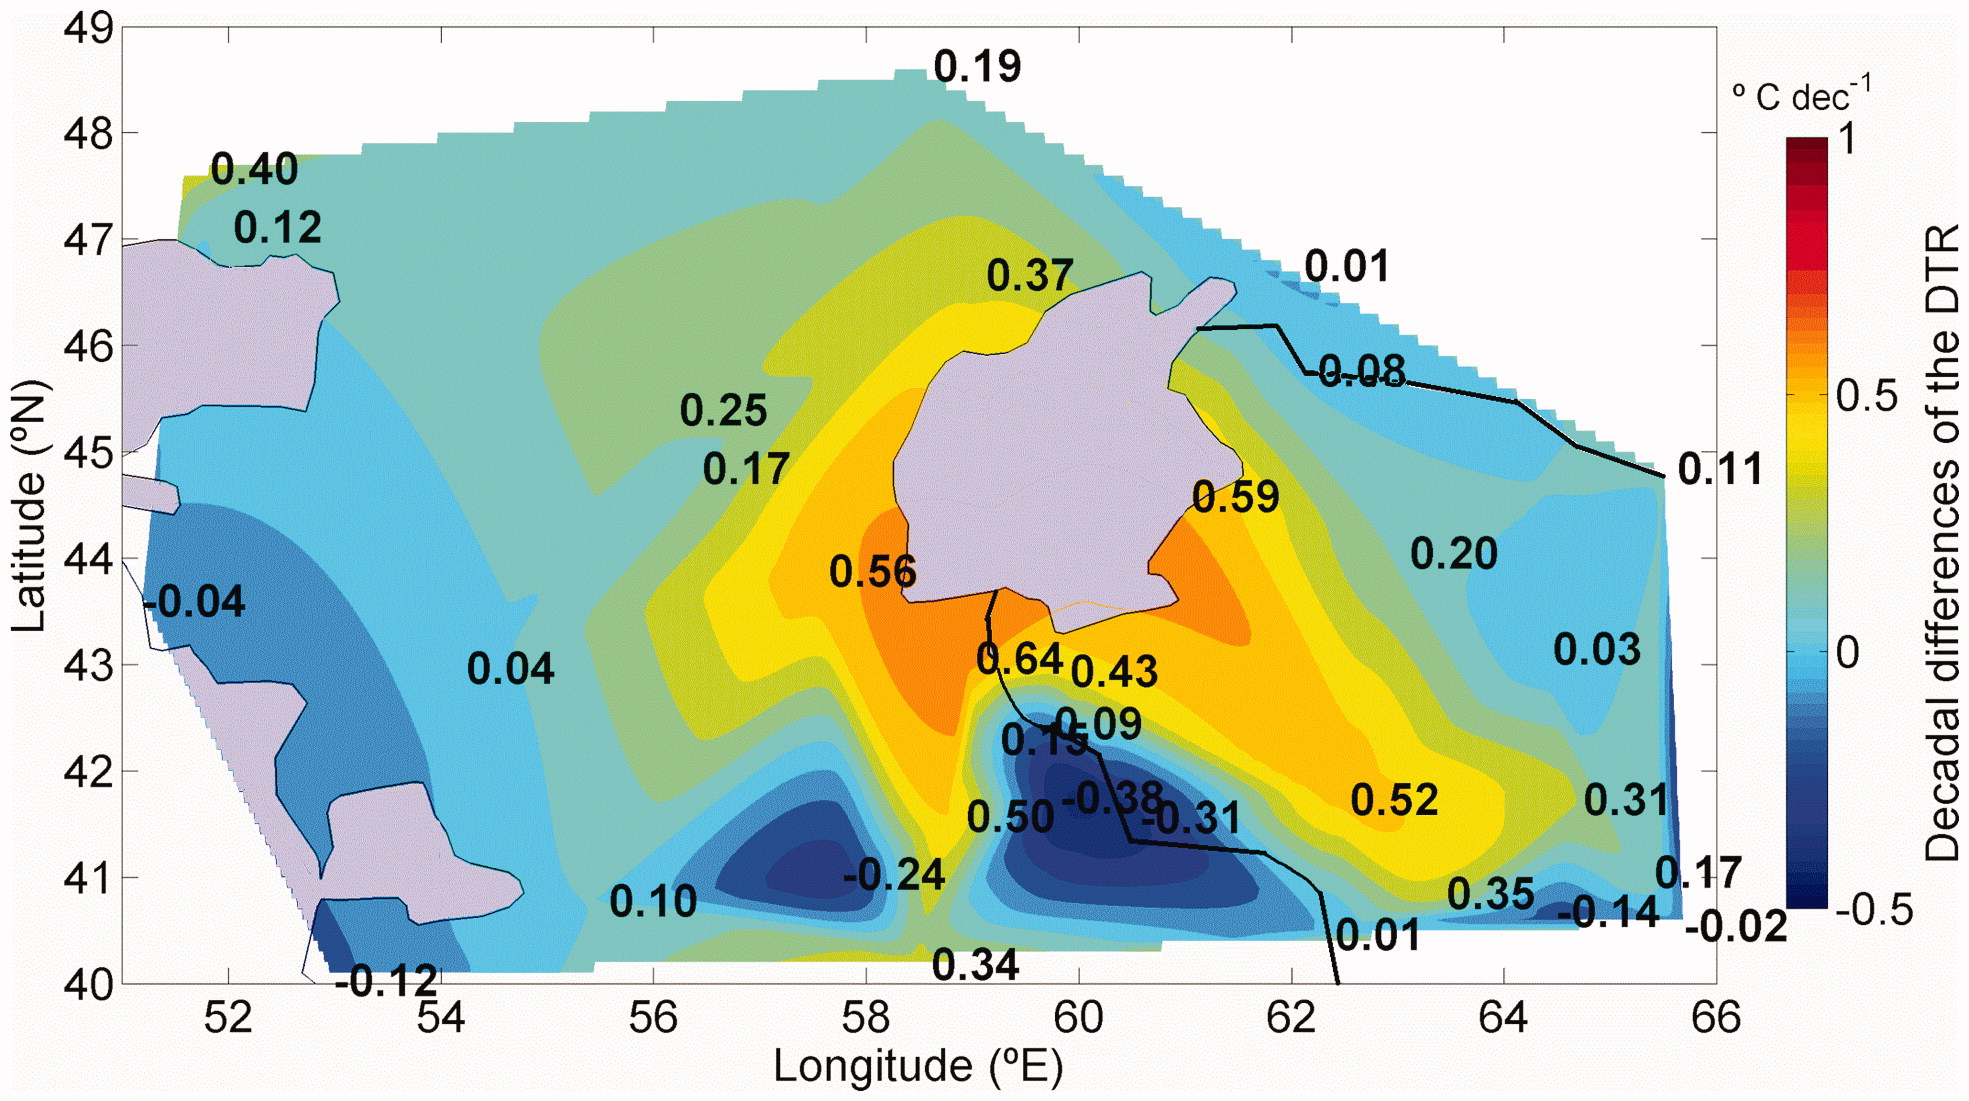
Fig. 4.

Differences of the annual mean of the DTR between the two consecutive decades: 1991–2010 and 2001–2010.
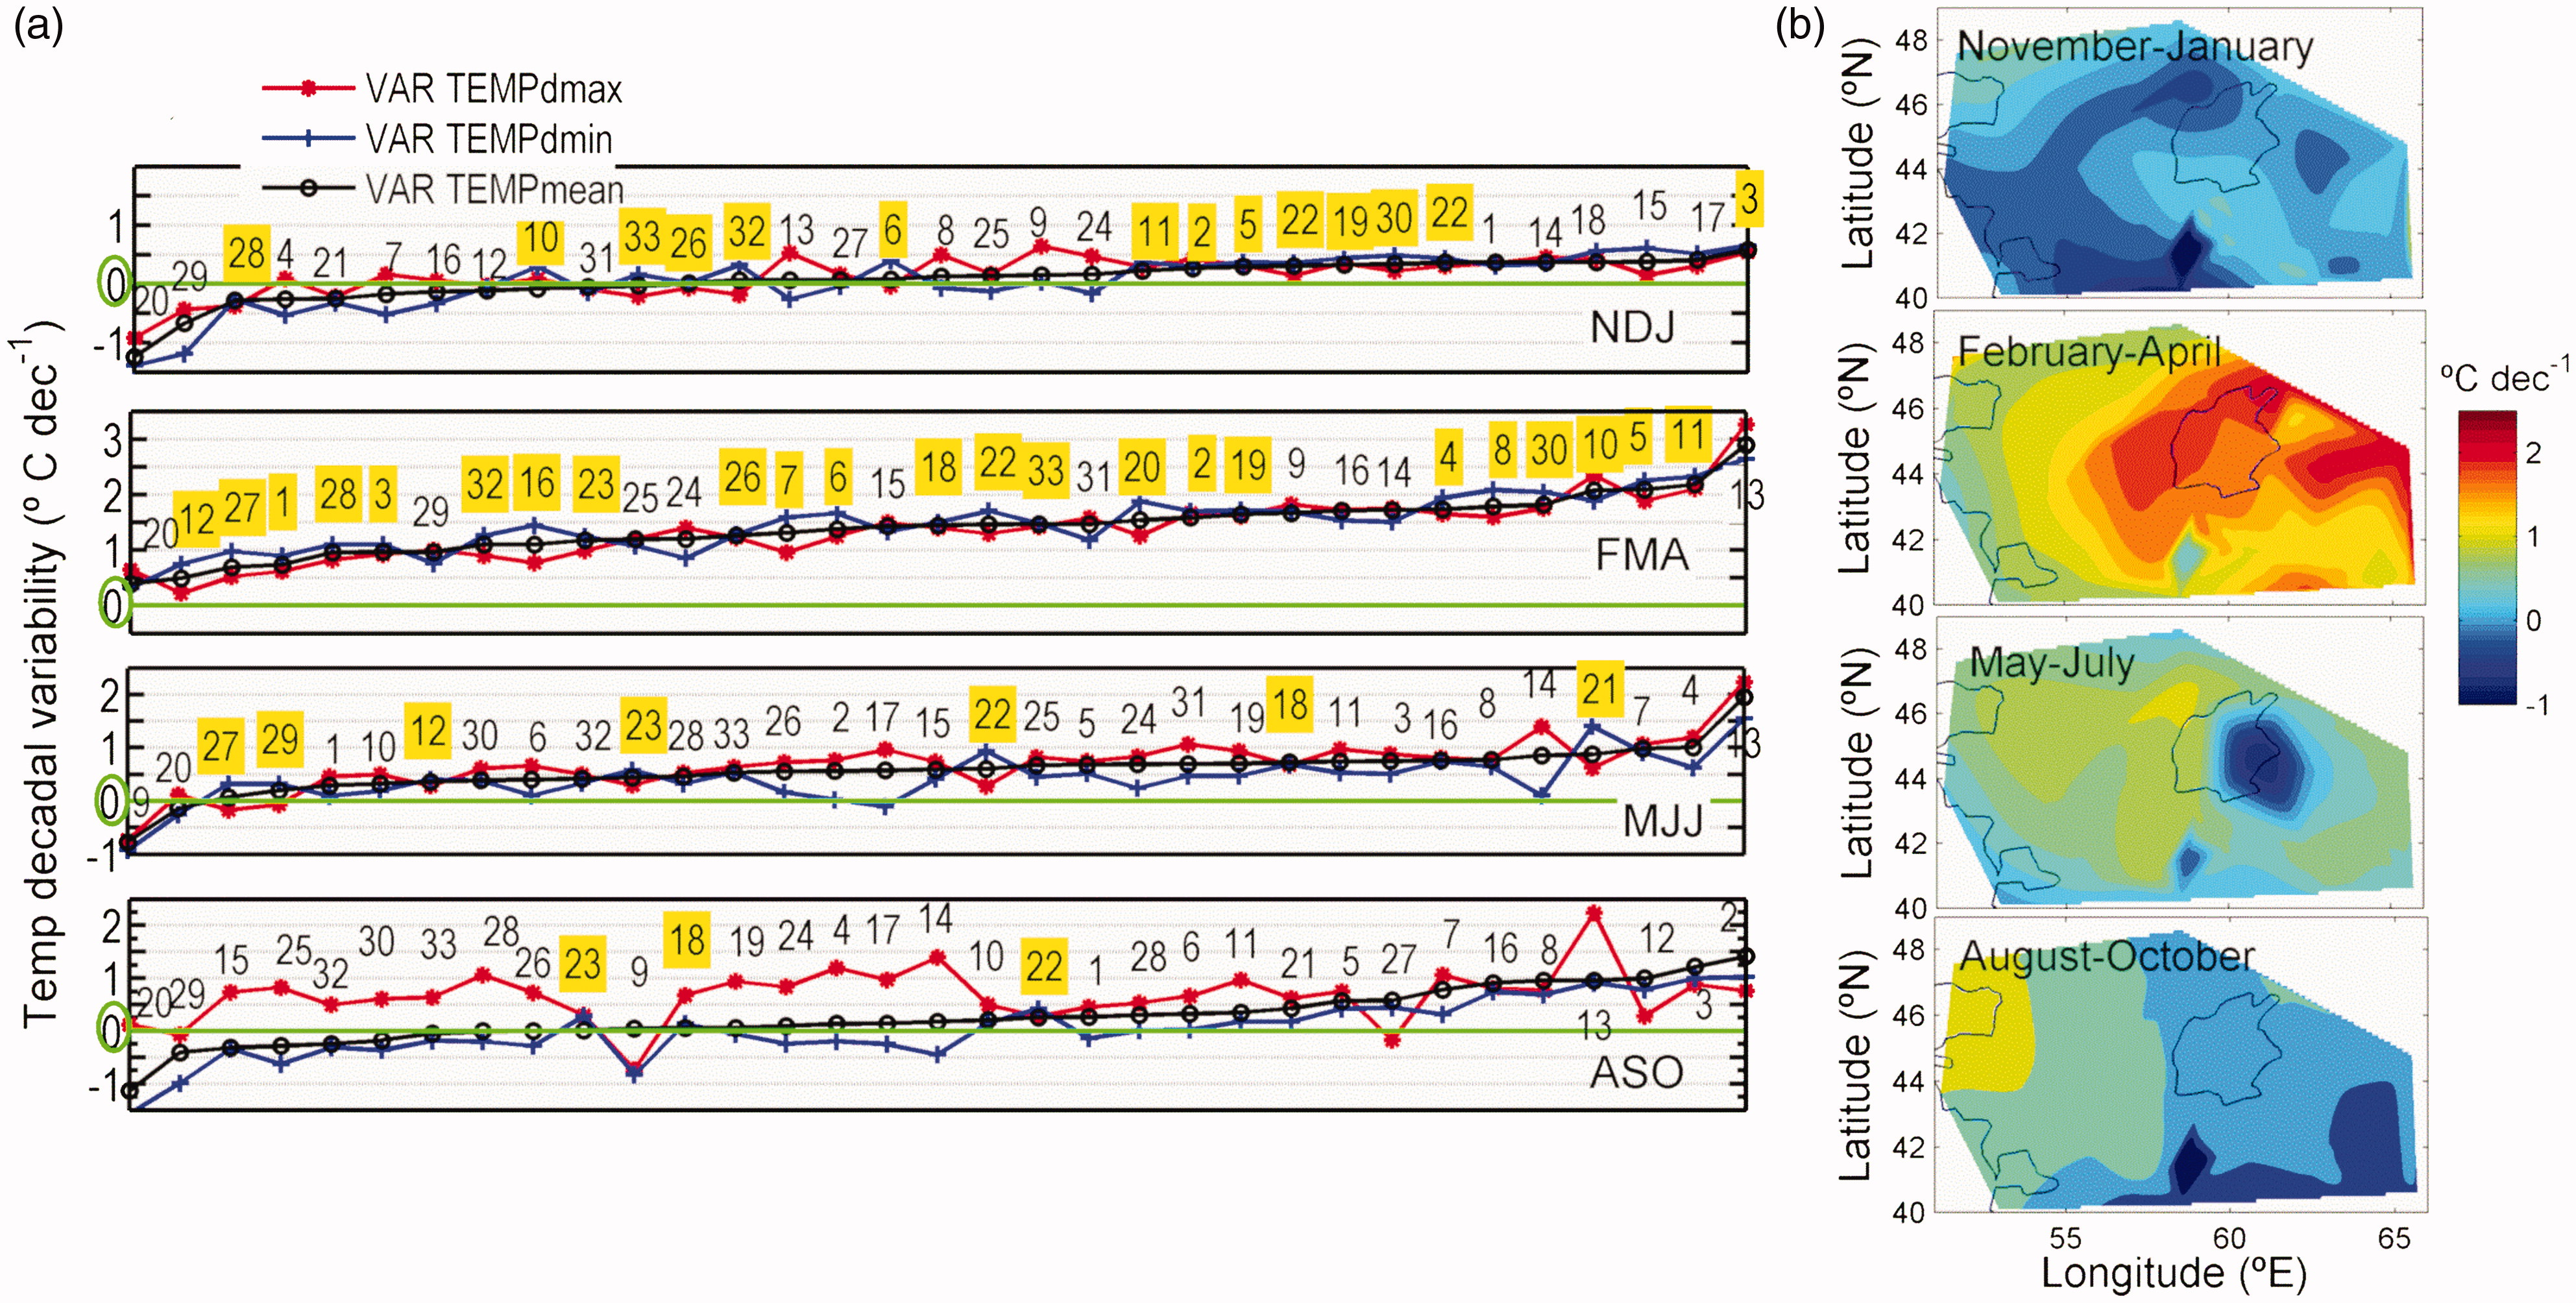
Fig. 5.

(a) Decadal differences of the mean temperature (VAR-TEMPmean) and of the minimum and maximum daily temperature (VAR-TEMPdmax, VAR-TEMPdmin). The averaged periods are: November–January (NDJ), February–April (FMA), May–July (MJJ), and August–October (ASO). Numbers are the references of the station represented for each point. At the stations highlighted in yellow, the decadal differences of the mean DTR are negative. (b) Spatial representation of the decadal differences of VAR-TEMPmean for the seasonal periods indicated in each plot.
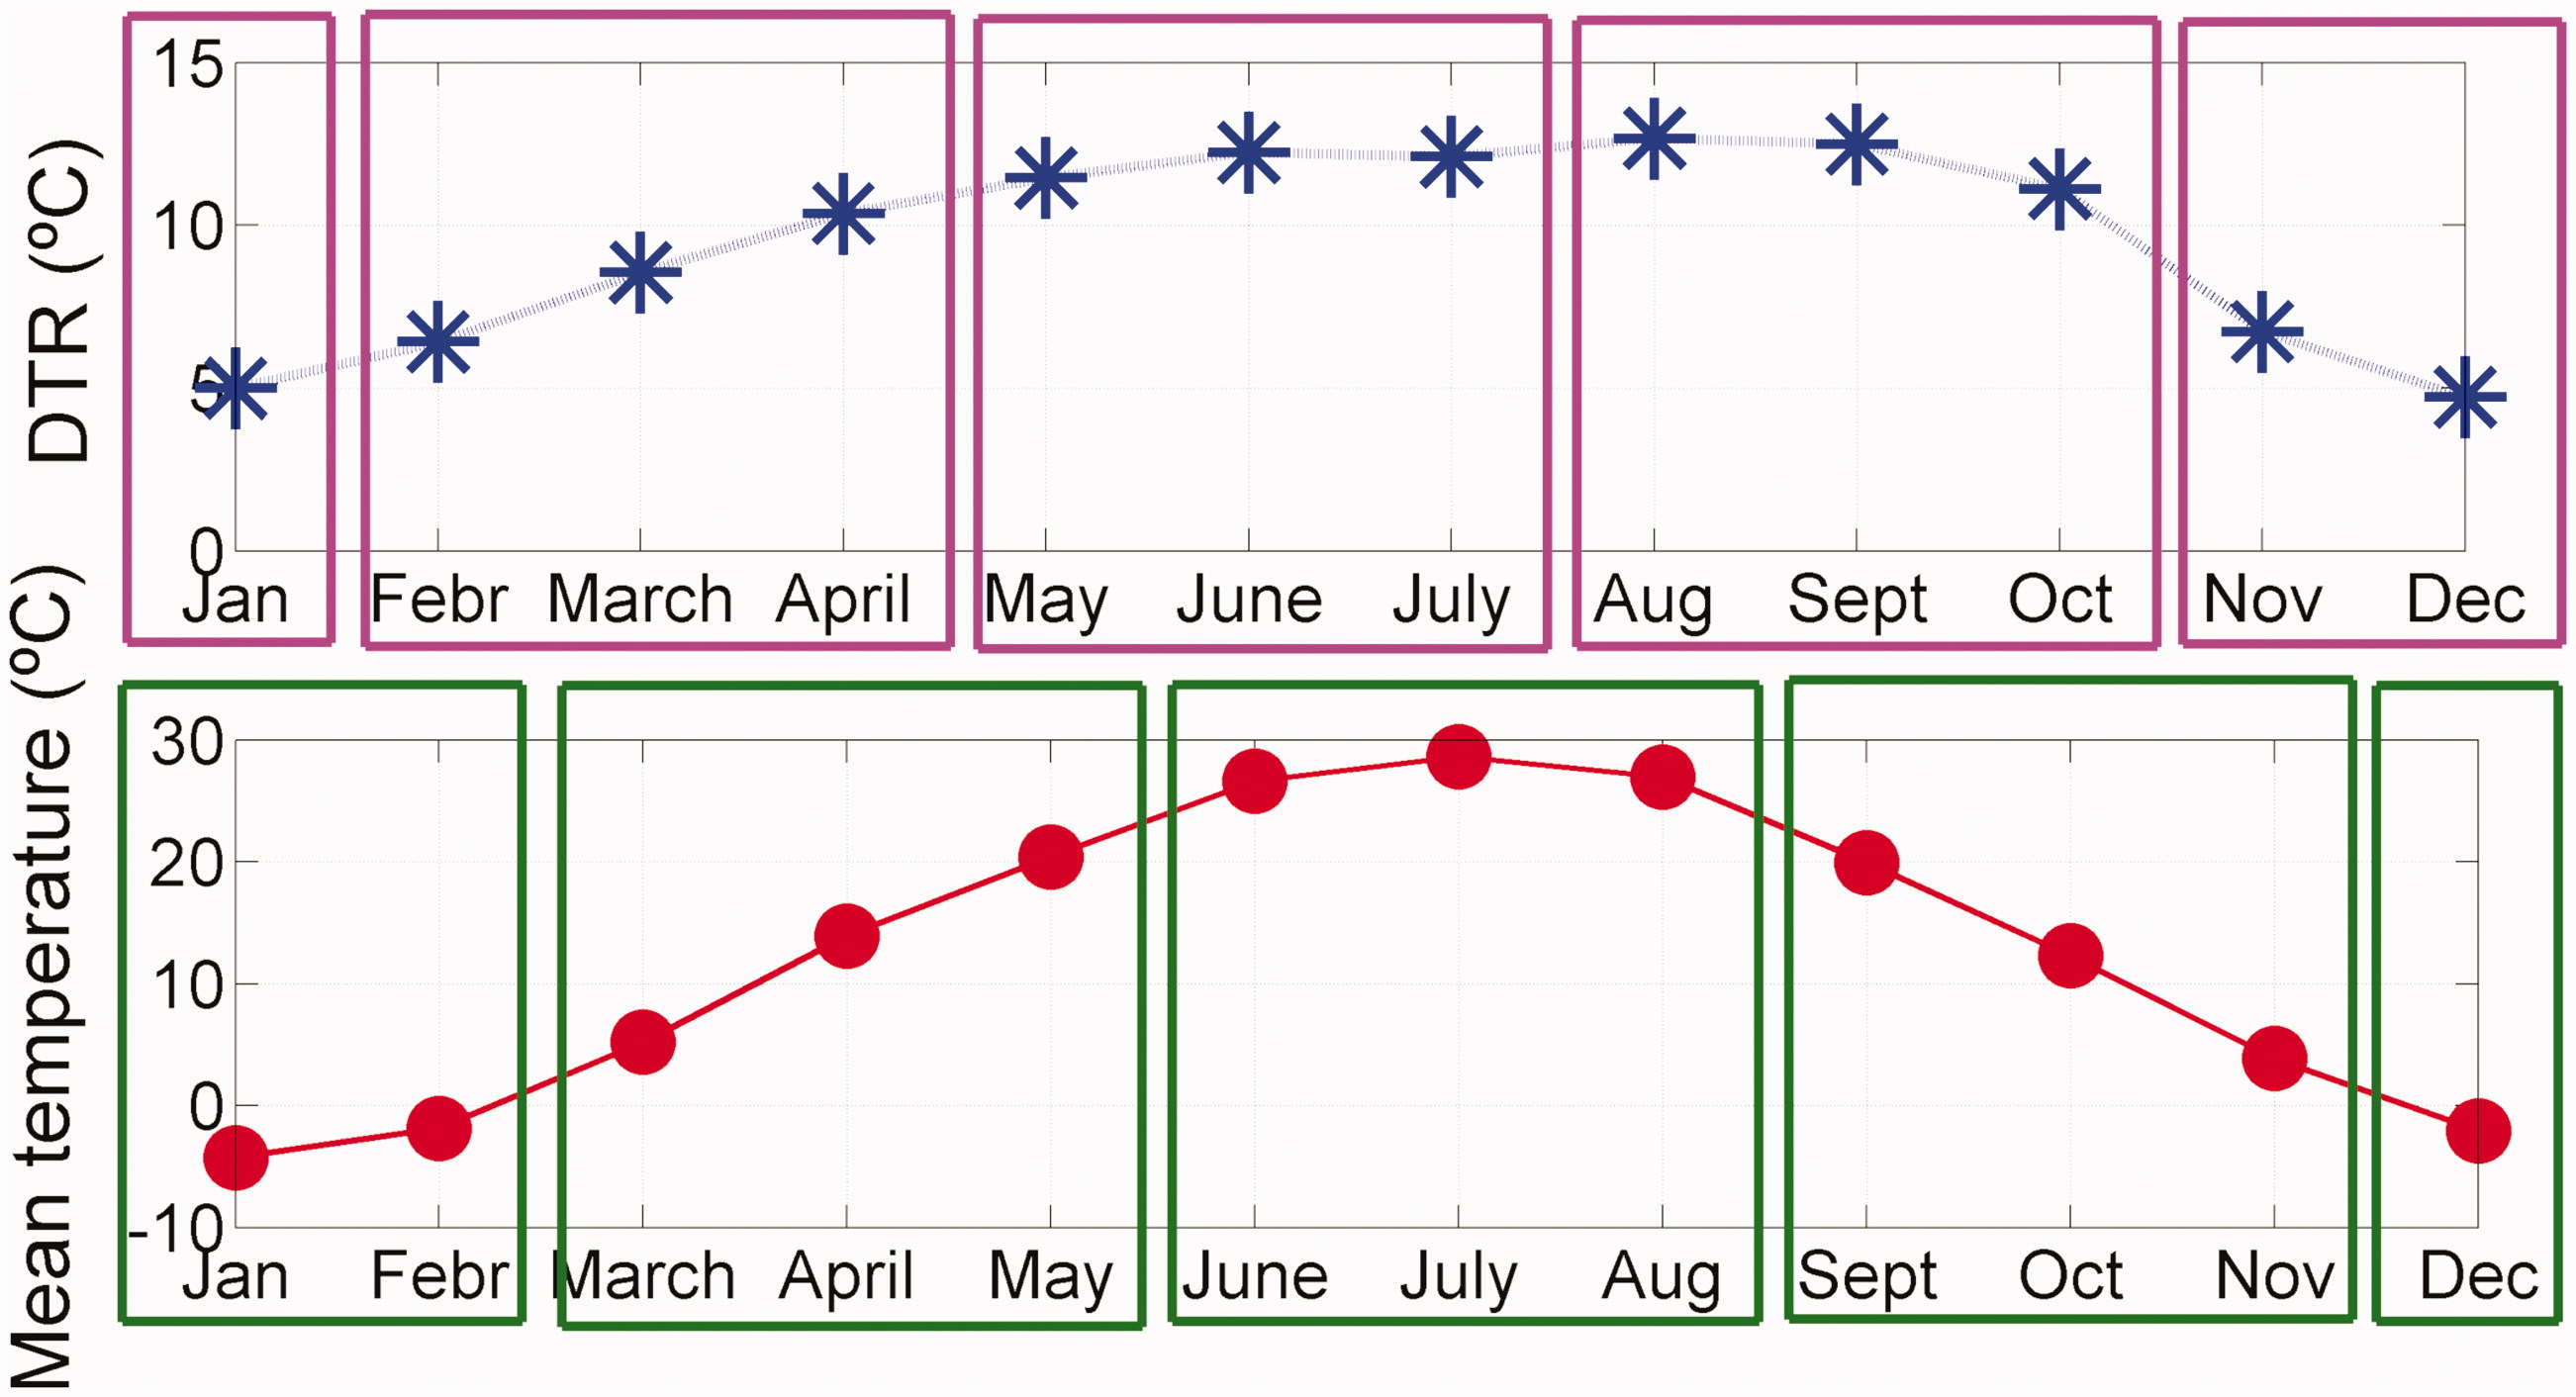
Fig. 6.

Mean curves for all the stations from 1991 to 2010 of the monthly averaged DTR and of the monthly mean temperature. The coloured rectangles indicate the natural period for averaging three consecutive months which appears when the DTR and mean temperature curves are considered.
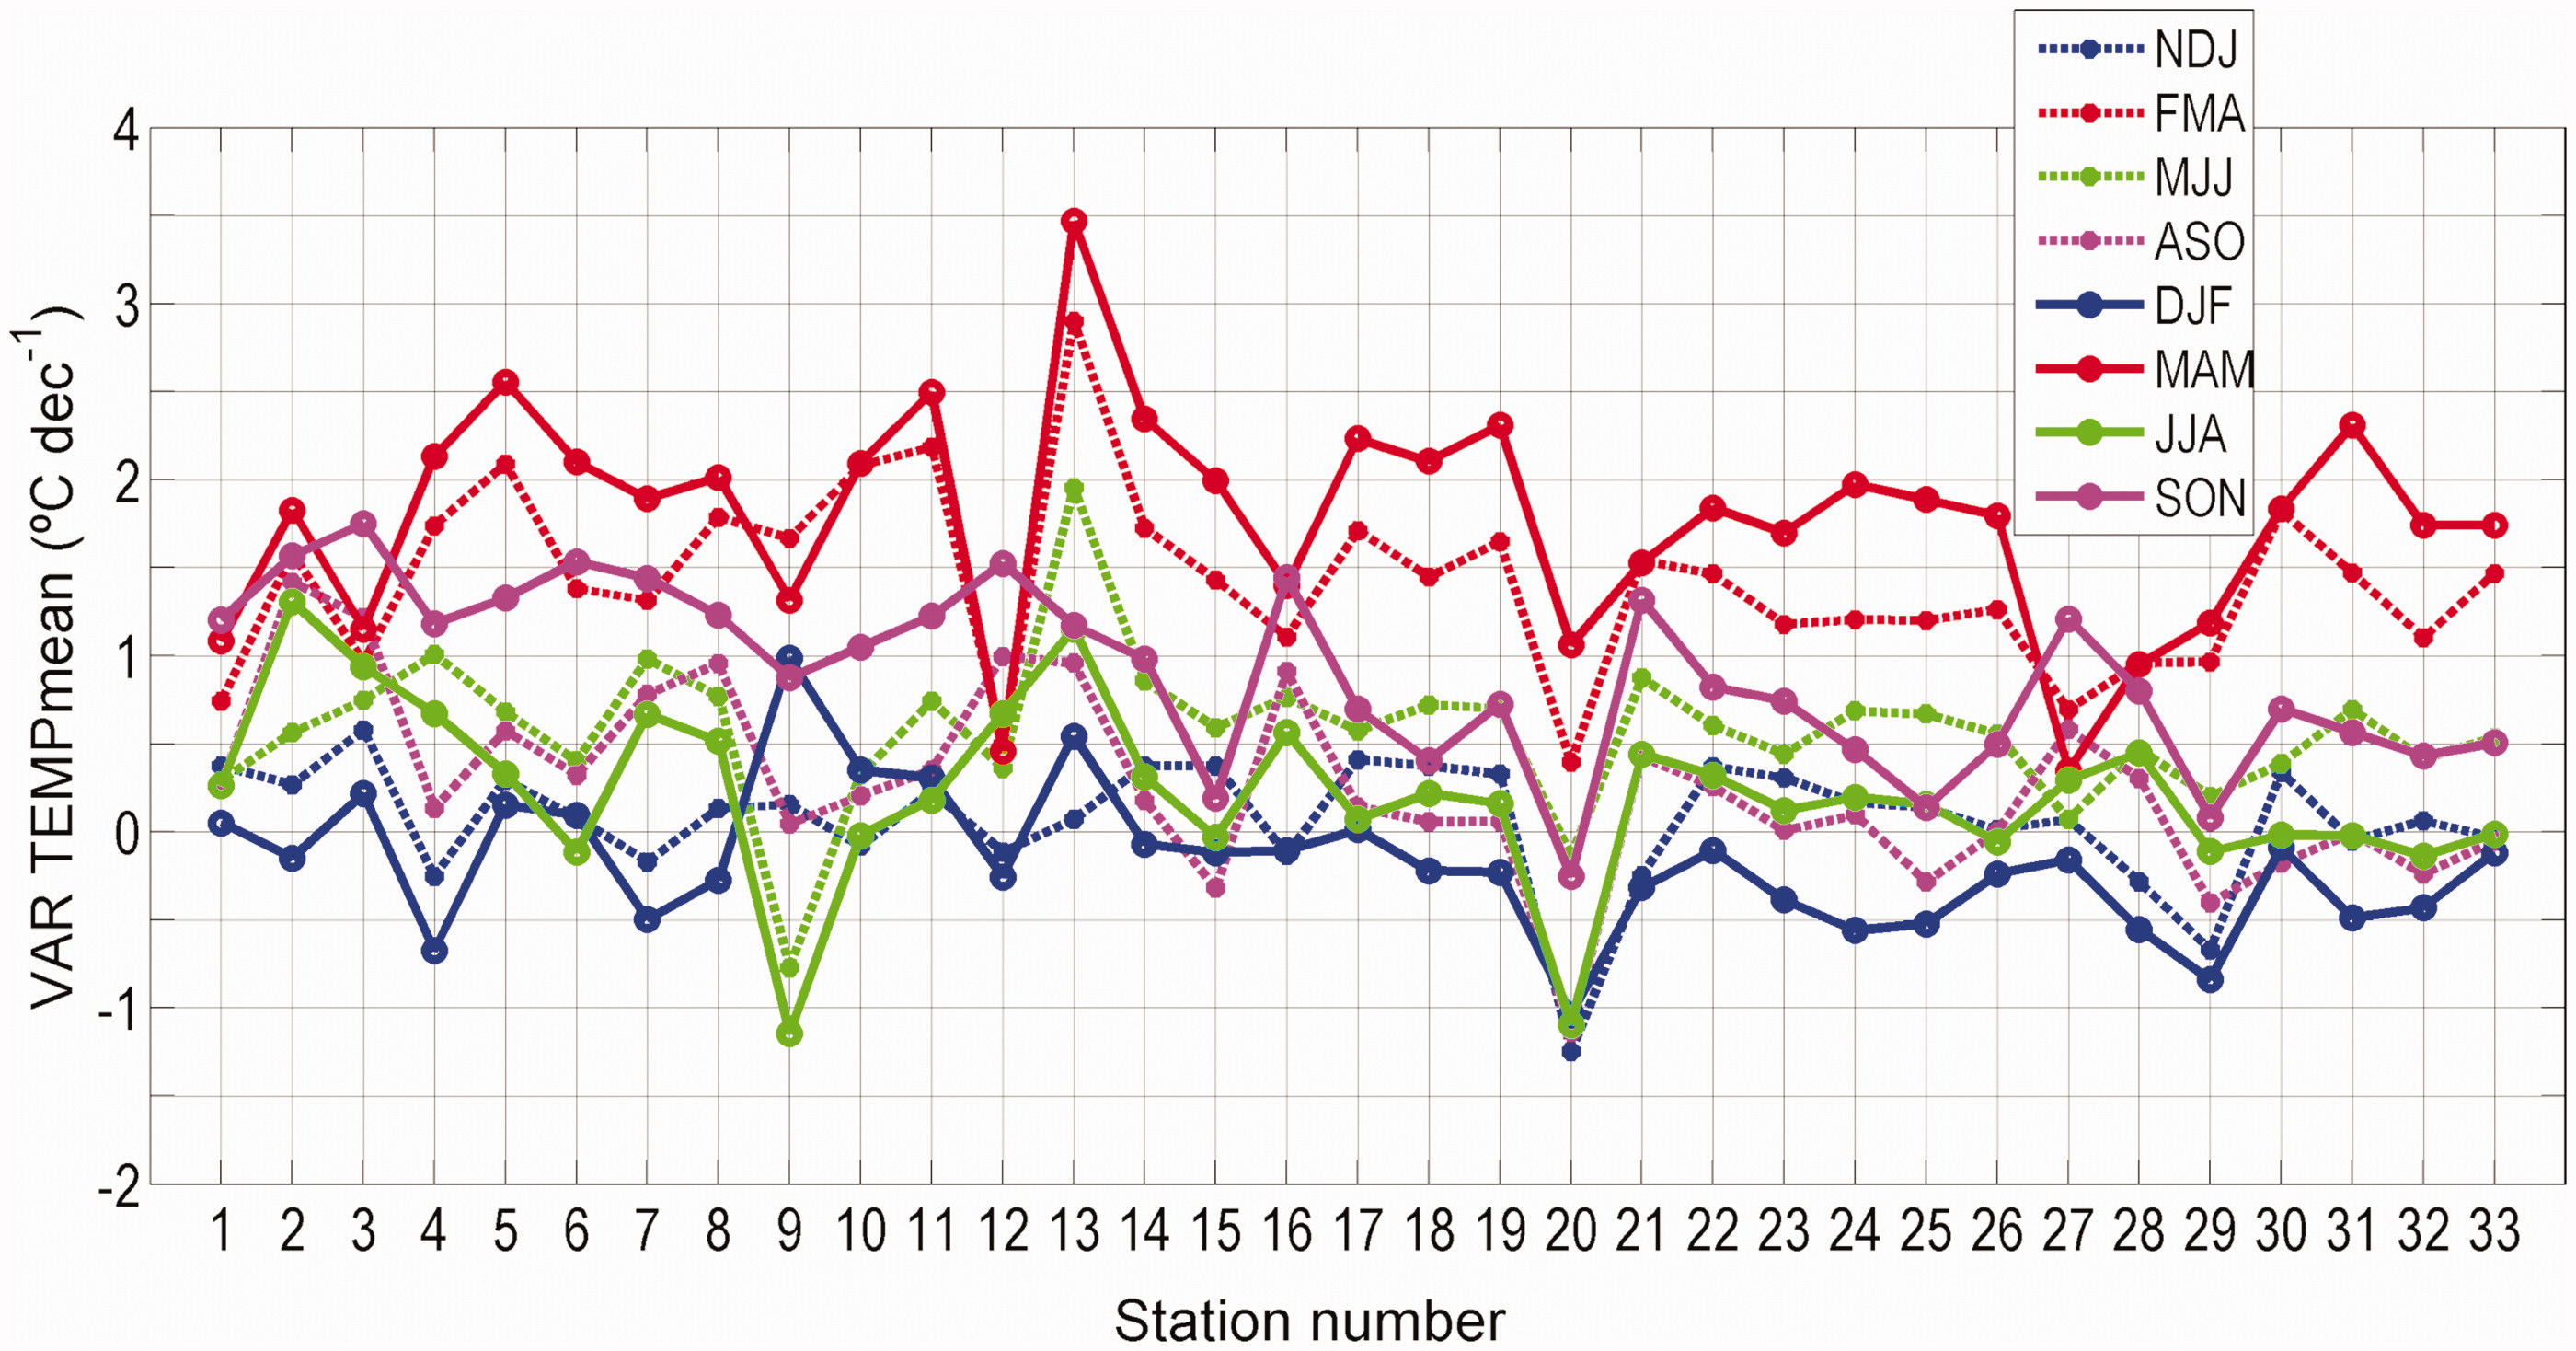
Fig. 7.

Decadal differences of the mean annual temperature (VAR TEMPmean) at each station considering two different averaging segmentations based either on the annual cycle of the DTR (NDJ, FMA, MJJ, ASO) or on the annual cycle of the mean temperature (DJF, MAM, JJA, SON).

Table 2.

Main conclusions about the decadal variation (between 1990 and 2010) of the monthly mean of DTR in the studied region (considering the stations available) on annual and seasonal time-scales.

Decadal variation of the DTR (VAR_DTR) on the annual time-scaleVAR_DTR is maximum at the stations closest to 1960s Aral Sea shoreline (up to about 0.6º/dec–1 on the south and 0.4º/dec–1 on the north-west).VAR_DTR is significantly positive at the Kyzyl Kum and Kara Kum deserts, in the Eastern part of the Ustyurt Plateau and in the North Western region of the Aral Sea.VAT_DTR is larger in the southern part of the Kyzyl Kum Desert than in the northern part.VAR_DTR at the stations along the Amu Darya river is smaller than at the neighbouring stations.At Station 5 (close to the Small Aral Sea) VAR_DTR is approximately zero.VAR_DTR at the stations along the Syr Darya river is close to zero.At the stations close to the Caspian Sea, VAR_DTR is either only slightly positive or negative.At Station 21, close to the artificial lake Sarygamysh, which expanded during the studied period, VAR_DTR is negative although at the other stations around it is positive.Decadal variation of the DTR (VAR_DTR) on the seasonal time-scaleAt Station 5 (in the north-east, next to the Small Aral Sea) from February to April VAR_DTR is –0.37 º / dec–1 and during the rest of the year it is positive and about 0.2 º / dec–1. From February to April, the temperature in this region increased by more than 2ºC /dec–1.From November to April at the stations along the Syr Darya riverbed, VAR_DTR is negative and during the rest of the year it is positive.From February to April VAR_DTR in the entire Kyzyl Kum Desert is positive. From November to January VAR_DTR in the southern part of the desert it is also positive but in the northern part it is negative.From November to January VAR_DTR, is positive only to the west of the Aral Sea (and far from the Caspian) and in the south of the Kyzyl Kum Desert.From February to April, VAR_DTR at the stations along the Caspian Sea are negative extending into the Ustyurt PlateauAt the stations in the Amu Darya delta, VAR_DTR is positive for all the seasons and around 1º/dec–1 from May to October.From May to October, VAR_DTR is positive almost everywhere and it is larger at the stations closer to the Aral Sea’s 1960s shoreline
Language: English
Page range: 1513290 - 1513290
Submitted on: Mar 23, 2018
Accepted on: Aug 9, 2018
Published on: Jan 1, 2018
Published by: Stockholm University Press
In partnership with: Paradigm Publishing Services

© 2018 Elena Roget, Valentina M. Khan, published by Stockholm University Press
This work is licensed under the Creative Commons Attribution 4.0 License.