
Introduction
1.
Changes in the surface air diurnal temperature range (DTR) and their causes have been highlighted by the Intergovernmental Panel on Climate Change (IPCC) as critical uncertainties in climate change studies. Confidence was medium when reporting a decrease in global DTR, and daily minimum temperatures were noted to be increasing faster than daily maximum temperatures. However, significant multi-decadal variability was found, including periods of no change when both maximum and minimum temperatures rose at similar rates (Vose et al., 2005; IPCC, 2007). Nevertheless, Makowski et al. (2008) found that, at least since 1990, the long-term trend for annual mean DTR has been increasing in many regions in Western Europe. Changes in the DTR have been linked to global warming (Qu et al., 2014), global dimming and brightening (Wild et al., 2007), precipitation (Zhou et al., 2009) and also to local processes such as variation in soil types and vegetation (Gallo et al., 1996; Roy and Balling, 2005; Zhou et al., 2007), aerosols (Wang et al., 2014) and the changing characteristics of water bodies (Schertzer et al., 2003; Adrian et al., 2009; Mahdi et al., 2011).
Across most of Asia, warming trends and increasing temperature extremes have been observed with high confidence over the past century (Hijioka et al., 2014). Located in central Asia, the Aral Sea is a paradigmatic example of lakes and large reservoirs around the world that have been affected by droughts and/or water diversion for irrigation (der Beek et al., 2011). Other examples include Lake Poopó in Bolivia (Zolá and Bengtsson, 2006), Lake Urmia in Iran (Abbaspour and Nazaridoust, 2007; AghaKouchak et al., 2015), Lake Chad in Central Africa (Lemoalle et al., 2012) or Lake Mead on the Colorado River in the USA (Li et al., 2010). How large lakes influence a region’s climate and vice versa has been well documented (Burnett et al., 2003; Livingston, 2008; Roget et al., 2017). Rubinshtein et al. (2014) showed how the desiccation of the Aral Sea strengthened the continentality of the regional climate in addition to finding relevant feedback effects. Small et al. (2001b) studied the variation of DTR around the Aral Sea from 1960 to 1997 and found that it increased 2–3 °C for all months. They also found that the magnitude of the changes diminished with distance from the 1960 shoreline and extended, in the downwind direction, up to 200 km. According to Small et al. (2001b), during this time the mean, maximum and minimum temperatures near the lake varied by up to 6 °C, warming during spring and summer and cooling during fall and winter. Khan et al. (2004) compared the mean air temperatures between the decade 1980–1990 and the decade 1990–2000 and found they had increased in winter and fall and decreased in spring. Khan et al. (2004) also showed that the Aral Sea changes generally shows effects up to a height of 500 m, but in the south-western part its effects extended up to 2.5 km. The same authors identified the north-eastern part of the Aral Sea region as being the most stable.
In this paper, we extend the works mentioned above on the trends of the DTR in the Aral Sea region until 2010 (thereby covering the period from 1991 to 2010) and we focus on their spatial and seasonal patterns. Taking advantage of the field data analysis we performed during the CLIMSEAS project, we provide a detailed description of the DTR in a region which is considered paradigmatic in global change studies. Furthermore, reliable knowledge of the DTR, which has been shown to be relevant for wildlife and health (Putnam and Edmunds 2011; Shakya et al. 2015; Zhang et al., 2017), allows an assessment of the parameterizations of the surface energy and water balances in the models (Braganza et al., 2004; Christy et al., 2006; Lewis and Karoly, 2013; Wei et al., 2017) and triggers forecast improvements.
A detailed description of the region and the data used in the study is given in the Site and Measurements section. The Methodology section contains a discussion of the quality of the data and the procedures used for data analysis. The Results section presents the evolution of the DTR on a monthly scale over the two decades, along with data quality indicators, the differences in the seasonal mean DTR between the two decades at all the stations, the decadal differences in the mean of the temperature and its daily maximum and daily minimum values. In the Summary and Discussion section the results are summarised, commented on and compared to results presented by other authors.
Site and measurements
2.
This study is centred in the region around the Aral Sea between latitudes 40–49°N and longitudes 51–66°E with the Caspian Sea to the west (Fig. 1). The Aral Sea is an endorheic lake which has historically had two major tributaries, the Syr Darya in the north-east and the Amu Darya in the south. The Aral Sea, which has been diminishing since 1960, first separated into the Large Aral and the Small Aral in 1989. Figure 1 presents its shoreline before the current recession and its evolution during the period studied (1991–2010) based on the digital bathymetry of the Aral Sea (Roget et al., 2009). In 2001, at the beginning of the second decade of this study, Vozrozhdeniya Island, in the northern part of the Large Aral Sea, became part of the mainland in the south due to the drop in water level. Thus, the Large Aral split into eastern and western lobes, which remained connected by a channel that persisted due to bottom erosion during the recession period (Roget et al., 2009). In 2006, the Kok-Aral Dam was completed and the flow of the Syr Darya River was contained in the Small Aral, thus forcing the definitive separation of the Large Aral from the Small Aral while a vast extension of the former lake bottom emerged. At the southern end of the Large Aral, the flow of the Amu Darya into the lake progressively diminished and a large number of small lakes and wetlands in its delta disappeared. In 2009, the eastern lobe of the Large Aral dried up completely, although in 2010 the Amu Darya reached the Aral Sea once again and the eastern lobe partially recovered. In 2014, the eastern lobe again dried up completely. Currently, the Aral Sea is still undergoing substantial modifications in the northern part of what is left of the Large Aral (Izhitskiy et al., 2016).
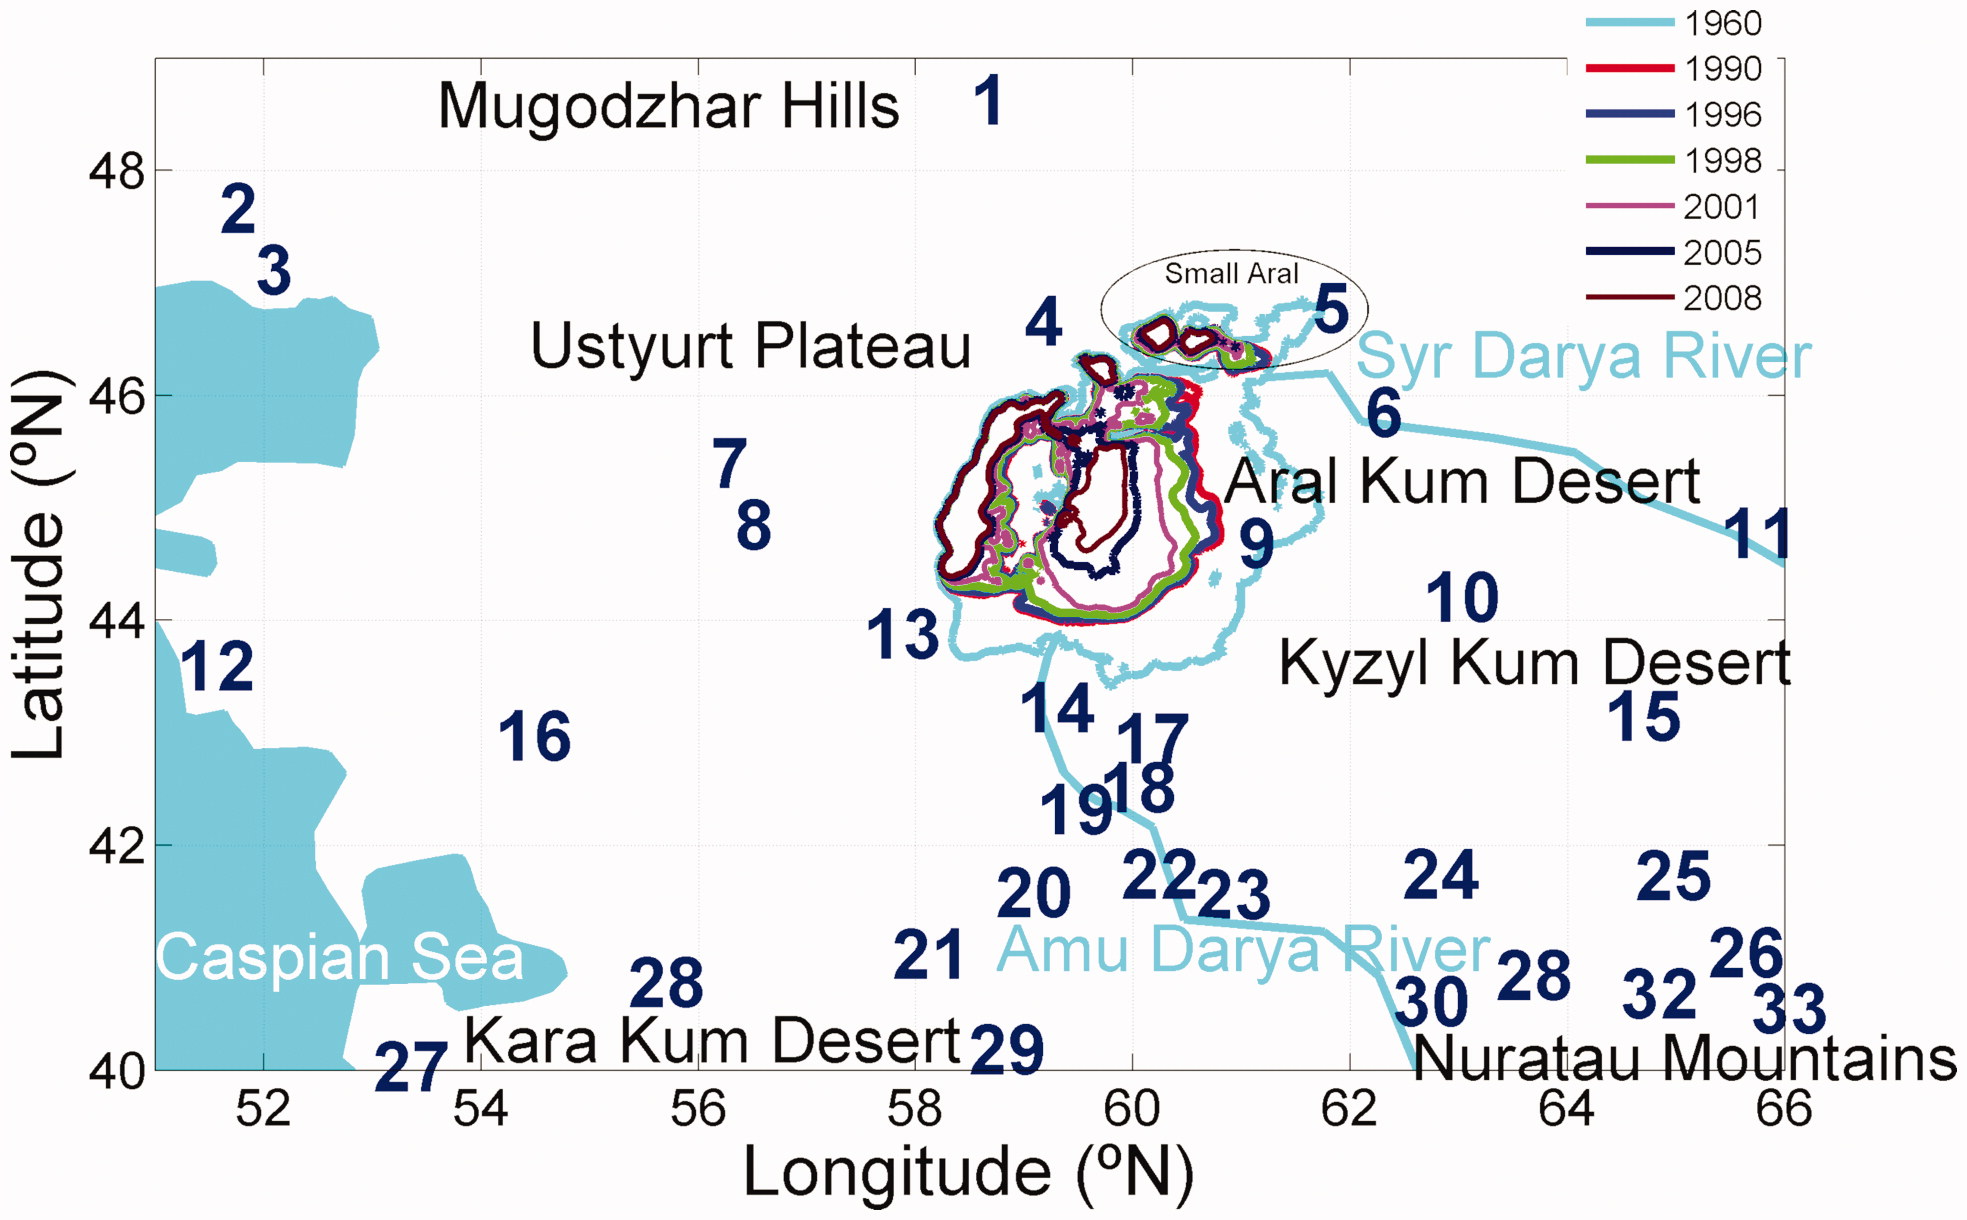
Fig. 1.
Map of the area studied presenting the different locations of the Aral Sea shoreline during its recession. The two main tributaries of the lake and other relevant geographical features of the region are also shown. The locations of the meteorological stations used in this study are indicated by their reference number (see Table 1).
As indicated in Fig. 1, on the eastern and south-eastern sides of the lake, between the Syr Darya and Amu Darya rivers, lies the Kyzyl Kum Desert, an extensive plane of depressions and highlands covered with dunes. Closer to the lake, in the east, there is the salty Aral Kum Desert, which was the lake floor before the waters receded. Between the Aral Sea and the Caspian Sea lies the rocky Ustyurt Plateau with almost no running water, sandy desserts and occasional small hills and salt lakes. The northern part of the Aral Sea is semi-arid and, according to the Köppen climate classification, belongs to a different climate class than the southern region (Peel et al., 2007). Located further to the north and to the south-east of the region studied, there are, respectively, the Mugodzhar Hills and the Nuratau Mountains.
For this study, we have used the temperature data recorded by the stations feeding into the All-Russian Research Institute of Hydrometeorological Information-World Data Centre (RIHMI-WDC) databases, which had air temperature data for the period 1991–2010. Although the number of stations available and the quality of the data are not optimum, they can provide a detailed picture of the evolution of the extreme temperatures in a region where the regional climate is changing intensively. Figure 1 shows the location of the 33 stations we used and to which we will refer throughout the paper. Basic information about the stations is given in Table 1. The quality of the data is discussed in the Methodology section and shown in detail in the Results section and the Supplemental Material.
Table 1.
Locations of the meteorological stations used in this study.
Methodology
3.
The DTR was computed as the difference between the highest and lowest temperatures during the same day. Previously, the outliers (above 50 °C or below –50 °C) were removed from the data series and interpolated. To remove the remaining spurious peaks, the series was filtered using a third order butterworth filter with a band pass covering four-days segments and the difference between the smoothed and the original series was computed. Difference values which were larger than three times the standard deviation were removed. Finally, the interpolated data were also removed and indications of missing values were once again introduced. Only the days with all the data have been considered in this study. The distribution of the missing days in the data series was visualised throughout the process and can be found in the Results section.
For this study, we have computed the DTR considering 4 data points per day. Depending on the station, the sampling frequency changed from four measurements per day (0, 6, 12 and 18 h) to 8 measurements per day (0, 3, 6, 9, 12, 15, 18 and 21 h) sometime before 2001. To evaluate the influence the sampling frequency has on the value of the DTR, we have used the data from 2006 to 2009, when the quality of the data was good at all the stations, and computed the DTR considering four-point measurements (DTR4) and eight-point measurements (DTR8) per day. We then compared the results and found that the linear correlation between DTR4 and DTR8 is very high at all the stations and the slopes are equal to 1. More precisely, the mean of the slopes is 1.007 ± 0.023 and their coefficient of determination 0.954 ± 0.011. Accordingly, to study the trends of the DTR and compare them between stations, DTR4 is a good proxy for DTR8.
However, the constant term of the linear fits between DTR4 and DTR8 at all the stations is –0.732 ± 0.186, which indicates that, as is to be expected, DTR8 is higher than DTR4. Generally, after midnight, heat is still lost and the daily minimum temperature can occur some hours later. Also, the maximum temperatures in the diurnal cycle usually occur after noon, generally at 1 p.m., and this is something which neither DTR4 nor DTR8 can resolve. That said, historical studies are based either on DTR8, DTR4 or even DTR3 (Qu et al., 2014; Przybylak and Wyszyński, 2017).
We have computed the difference for the two subsequent decades of the monthly mean of DTR4 averaged either seasonally (3 months) or annually. For 26 stations of the 33 available, only one year for each decade has one season with 1 or 2 months without data. For three another stations, there are two seasons with 2 month with no data for one decade. Data from st. 2 and st. 20 with different distributions of the missing values (see the Supplemental Material) were also considered.
Furthermore, we also used st. 9 (Uqly), where no data were recorded after 2007 but which was included because it is the only station available that is located in the newly formed Aral Kum Desert. We also included st. 13 (Jaslyk), where from 1997 to 2000 the DTR could not be computed, but which is the only station that covers the south-western region of the lake, where a statistically significant anomaly (up to 700 mb) was observed by Khan et al. (2004). For this last station, the evolution of the difference between the temperature at noon and at midnight could be computed for the entire study period and is presented with the complemental material.
Although we included the 33 stations to elaborate the contour plots presented, it is important to note that even if sts. 9 and 12 had not been included, the general spatial pattern of the DTR differences between the two decades would not have changed. Furthermore, the numerical values of the DTR differences at all the stations are shown in the plots so that their effect on the contour plot can be evaluated by considering the quality of the data from every station, presented either in Fig. 2 or in the Supplemental Material, depending on the station.
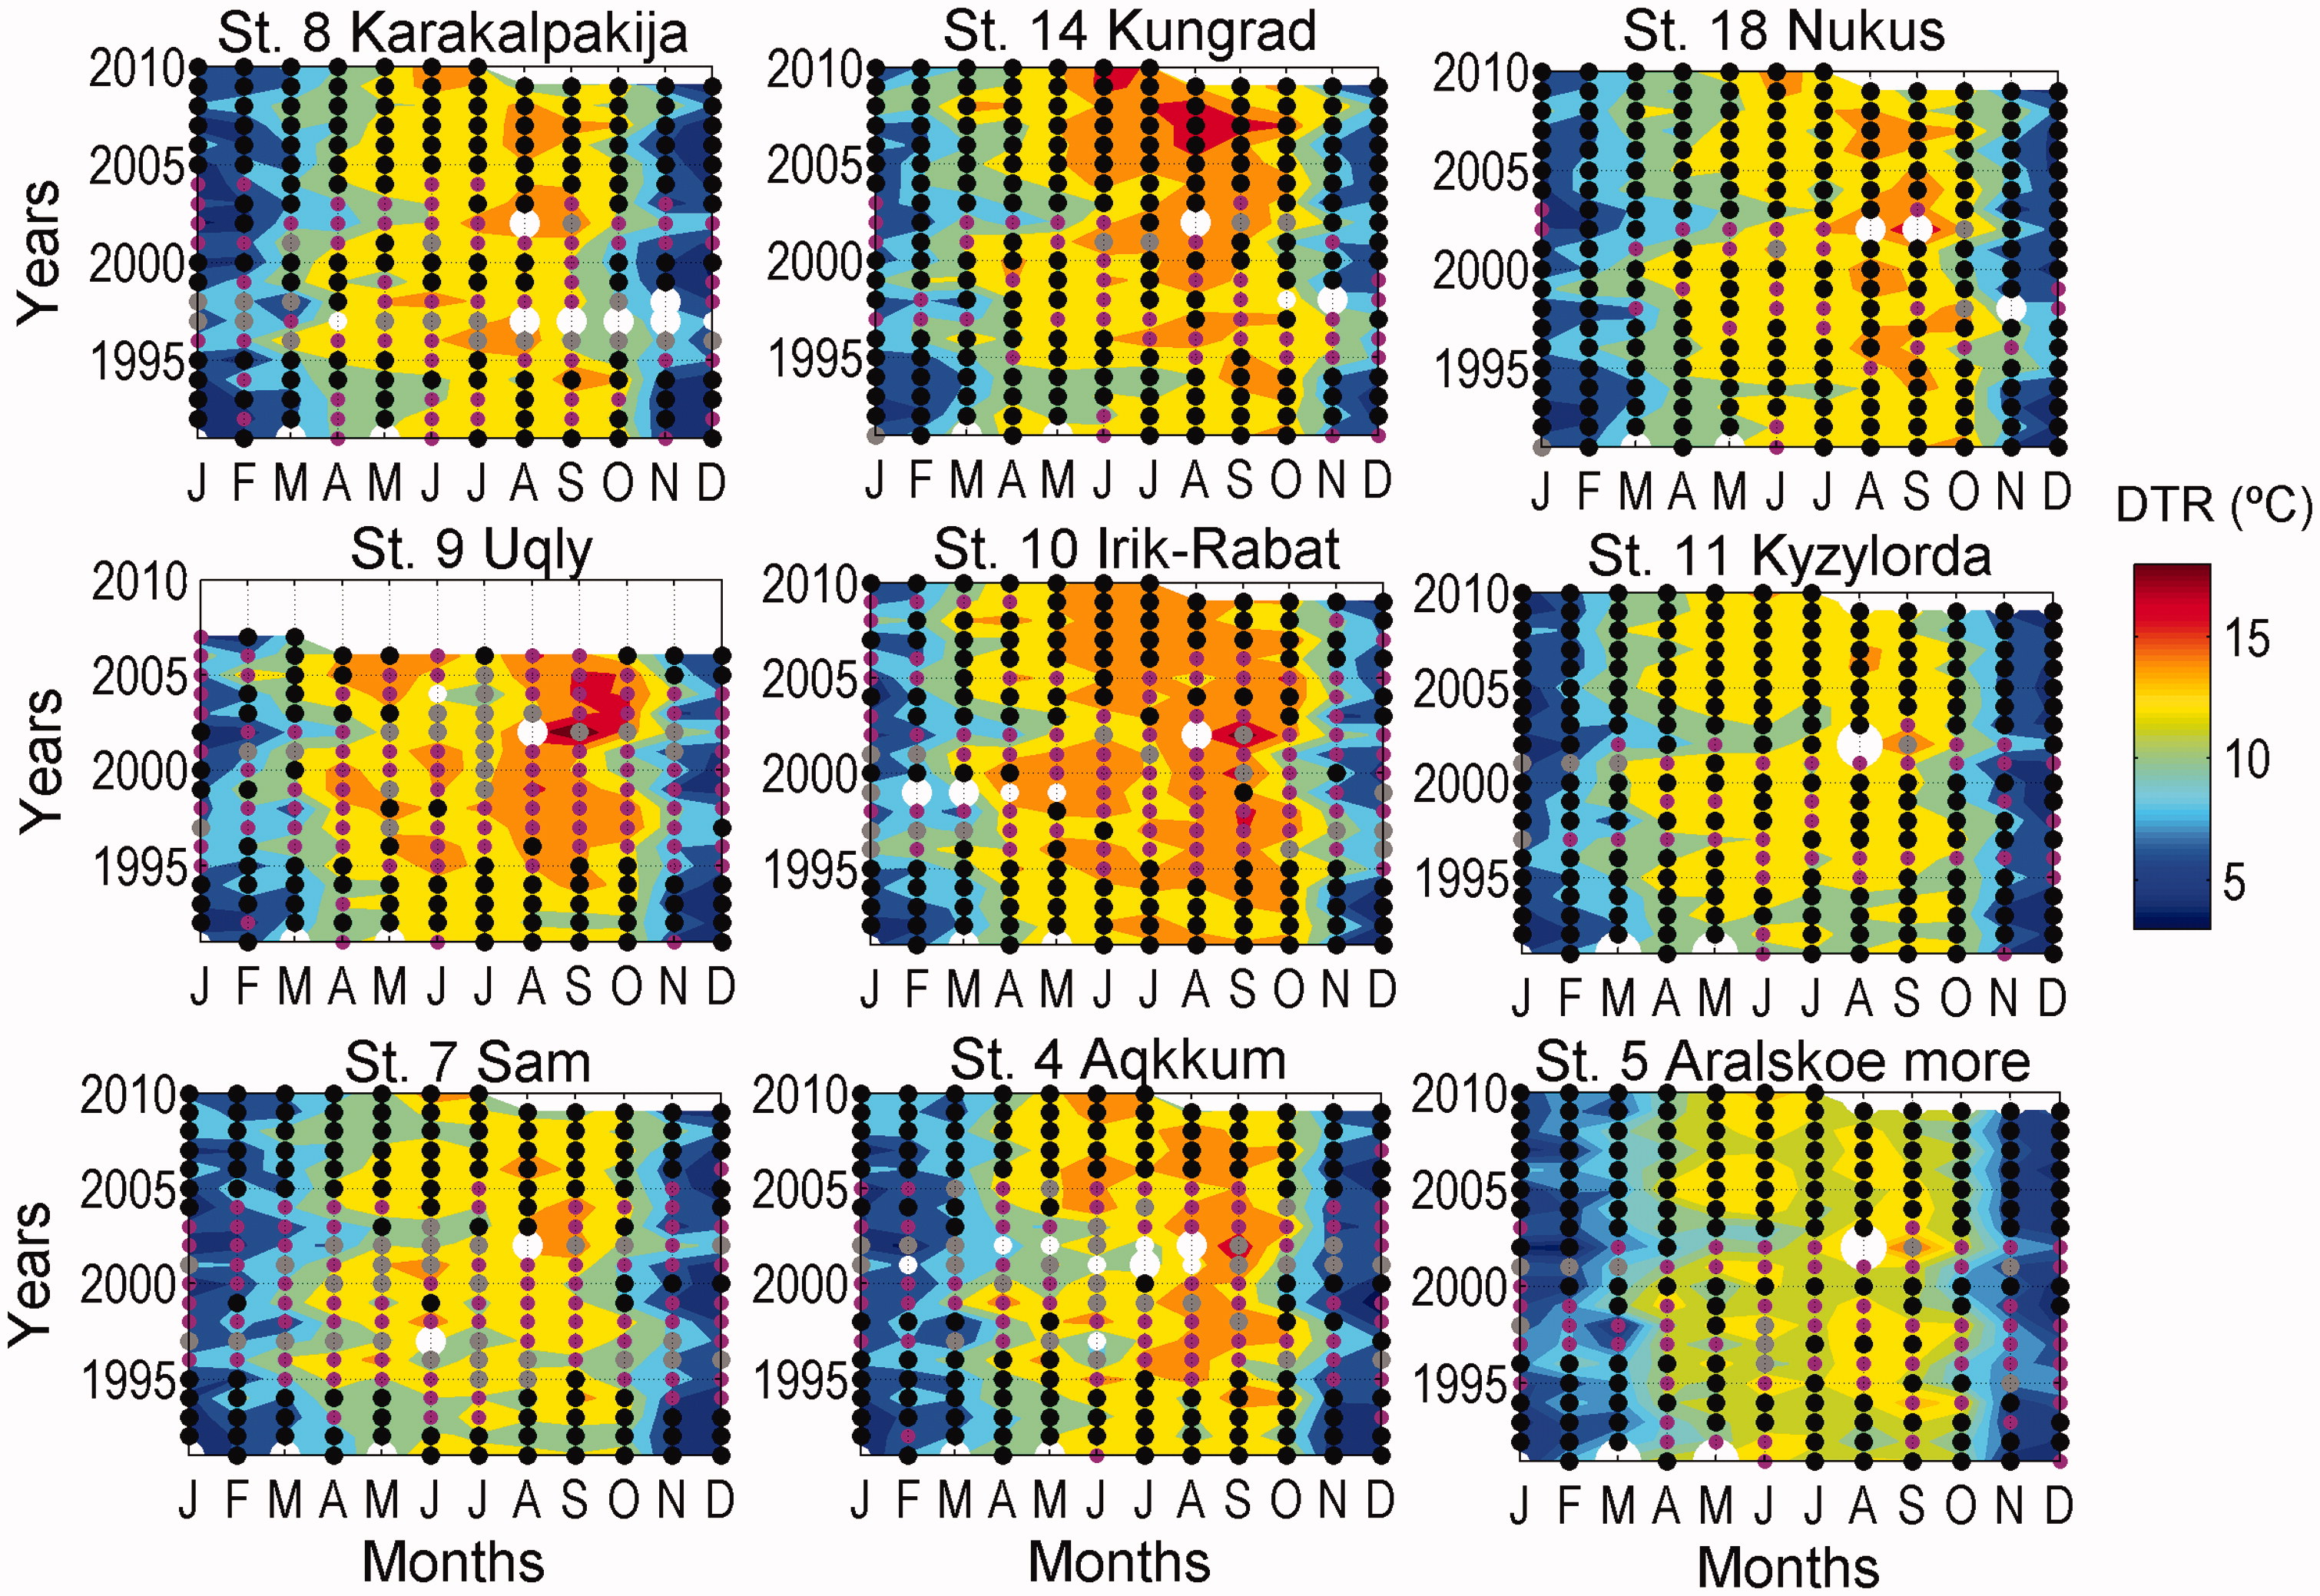
Fig. 2.
Monthly mean of the DTR from 1991 to 2010 at several representative stations. On the plots, large white circles indicate the months in which there were no data and the small different coloured circles indicate the number of missing days in each month: white circles more than 85%, grey circles between 80 and 50%, magenta circles between 50 and 15% and black below 15%.
Results
4.
Monthly mean of the DTR at the different stations
4.1.
In Fig. 2, from 1991 to 2010, the monthly mean from 1991 to 2010 of the DTR at several stations which are located at different directions all around the Aral Sea, is presented. Stations in the first line of panels are located in the western and southern part of the lake, those in the second line are in the east and those in the last line are situated in the north-western and north-eastern areas of the lake.
The quality of the data has been indicated on the plots. Large white circles show the months where there were no data and small different coloured circles indicate the number of days without data in each month. White small circles show the months where more than 85% of the days are missing (i.e. less than 5 days with good data), grey small circles indicate when there is between 85 and 50% missing (i.e. between 5 and 15 good days), magenta circles when the number of missing days per month is between 50 and 15% (i.e. between 15 and 25 good days) and the black circles indicate when the number of missing days are below 15% (i.e. there are five missing values per month at most).
Figure 2 shows that the maximum DTR values in the region occur in spring and summer and that the monthly mean values of the DTR vary between 3 and 18 degrees, depending on the season and the station. Furthermore, despite the differences in the DTR between the stations, some general patterns present at all stations indicate common processes in the whole of the region studied. For instance, in the springtime in the initial years of the first decade, the DTR is low at all stations. This also occurs in the spring of 2002 and of 2003 in the second decade.
A visual inspection of Fig. 2 and the plots for all the other stations, which are attached as Supplemental Material, indicates that, during the second decade the DTRs are generally higher, although in both decades the variability from one year to another is high.
Differences between the seasonal mean of the DTR for subsequent decades
4.2.
To estimate the variation in the DTR between the two decades, after we computed the monthly mean of the DTR, we averaged for periods of three consecutive months in each decade and then we computed the difference. Figure 2 shows that, in general, the DTR values started to decrease in November and stayed low until April. Accordingly, we have chosen four averaging periods which fit these limits: November to January (NDJ), February to April (FMA), May to July (MJJ) and August to October (ASO). The results are presented in Fig. 3.
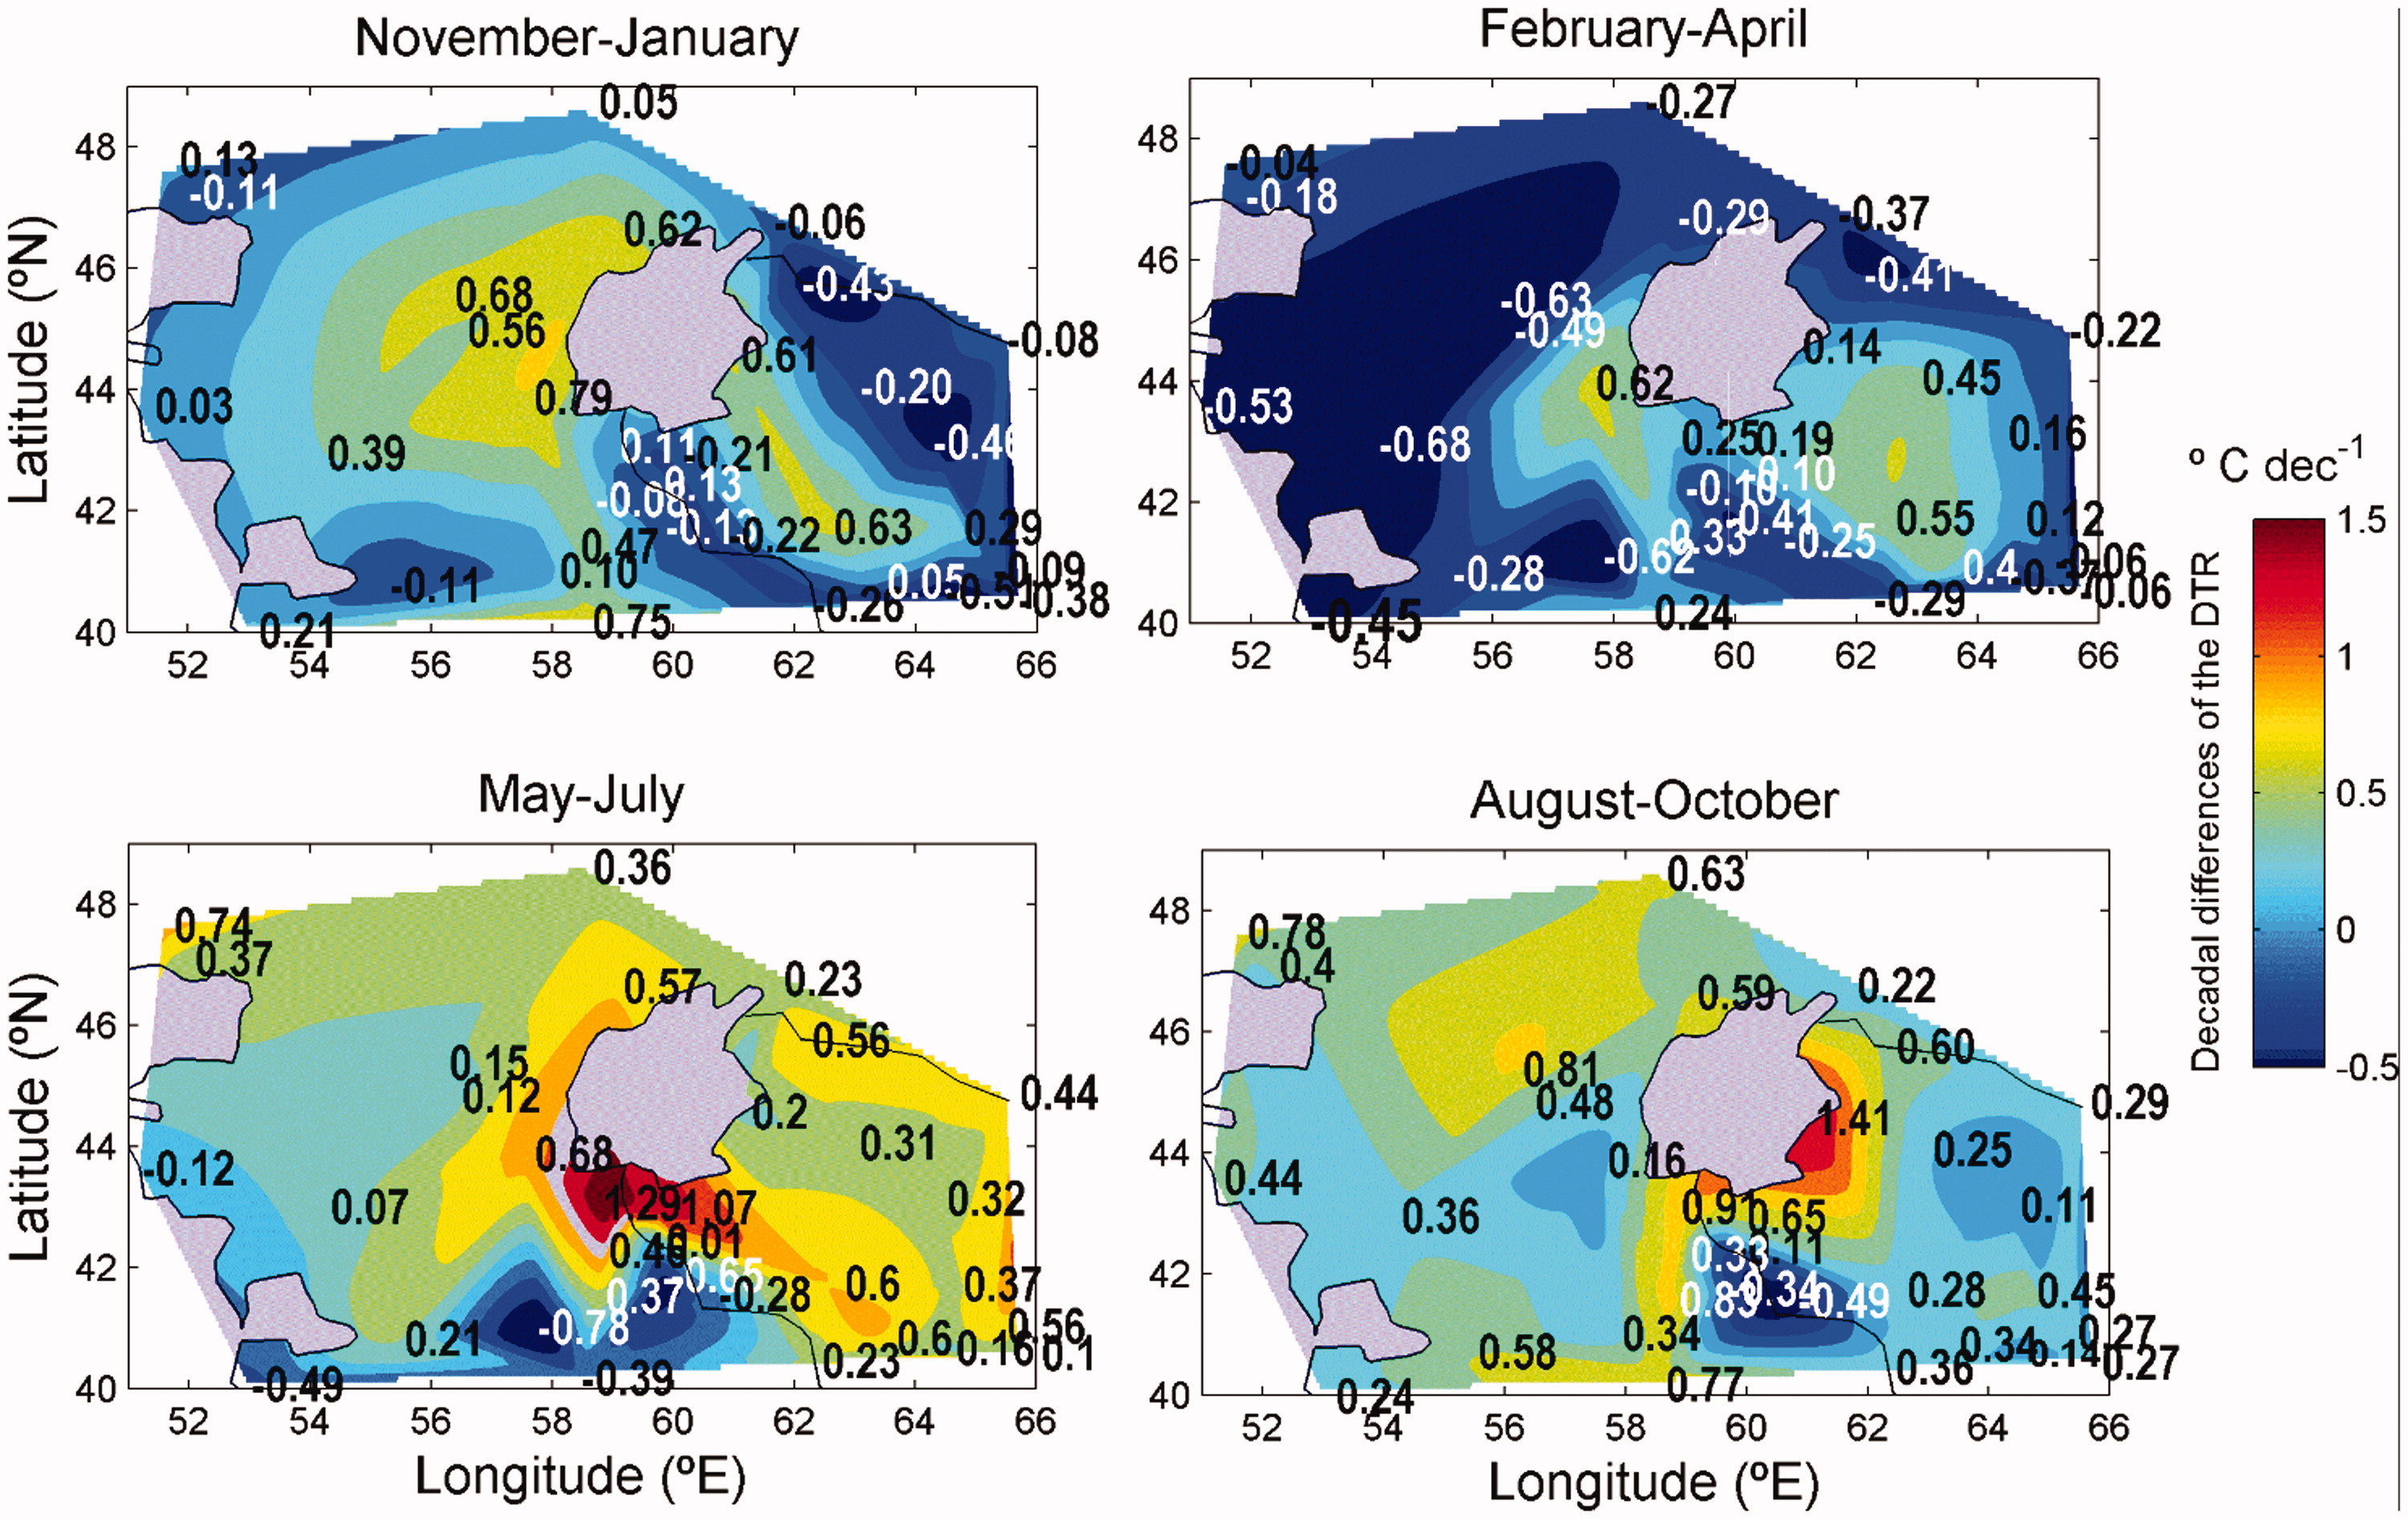
Fig. 3.
Averaged seasonal differences of the monthly mean DTR between two consecutive decades starting from 1991. The averaged periods are indicated above each panel.
From Fig. 3, it can be observed that, when comparing the two consecutive decades, from November to January the DTR diminished at many stations but not at those located to the west of the Aral Sea and far from the Caspian Sea, and to the east of the Aral Sea south of the Kyzyl Kum Desert. From February to April, values of the DTR difference between the two decades of observations along the Caspian Sea are always negative and larger than in the previous season and they extend into the Ustyurt Plateau. From February to April, the variation of the DTR is positive in the entire Kyzyl Kum Desert, not only in the southern stations as in the previous averaged period. During the rest of the year, from May to October, the decadal differences in the DTR are positive almost everywhere and are higher at those stations closer to the 1960 shoreline of the Aral Sea.
Considering all the subplots in Fig. 3, in the Kyzyl Kum Desert, at the east end of the Aral Sea, the DTR decadal difference is positive throughout the year except at the northernmost stations (st. 10 at Irik-Rabat and st. 15 at Ak-Bajtal) where the mean DTR difference between the two decades is negative from November to January. At the closer stations located along the Syr Darya riverbed (sts. 6, 11), the DTR difference also stays negative from November to April and during the other half of the year the decadal difference of the DTR at all the stations along the Syr Darya riverbed are positive. At the south of the Aral Seas, the stations in the Amu Darya delta region closest to the lake, the increase in the DTR is high throughout the year, at around 1 °C dec−1 in summer. Furthermore, throughout the year at the stations located further south along the Amu Darya riverbed, the positive DTR variation is smaller (and even negative) when compared to the other stations around this area.
Figure 4 presents the annual mean of the differences in the DTR for the two decades. The maximum positive differences in the DTR are observed around the Aral Sea, except in the north-east, and they extend into the Kyzyl Kum Desert (especially at the southern stations) and into the eastern part of the Ustyurt Plateau. The magnitude of the positive differences decreases with the distance from the Aral Sea’s 1960 shoreline where, when considering the stations available, it has been determined to be about 0.6 °C dec−1 on the south side of lake and about 0.4 °C dec−1 on the north-western side. Far from the lake, the differences along the Amu Darya riverbed are small and even negative. In this plot, a negative value surrounded by positive ones can be observed at st. 20 (41°N, 58°E). As has been observed in this study, at this station the results are often different from neighbouring stations, which is taken into consideration in the Summary and Discussion section.
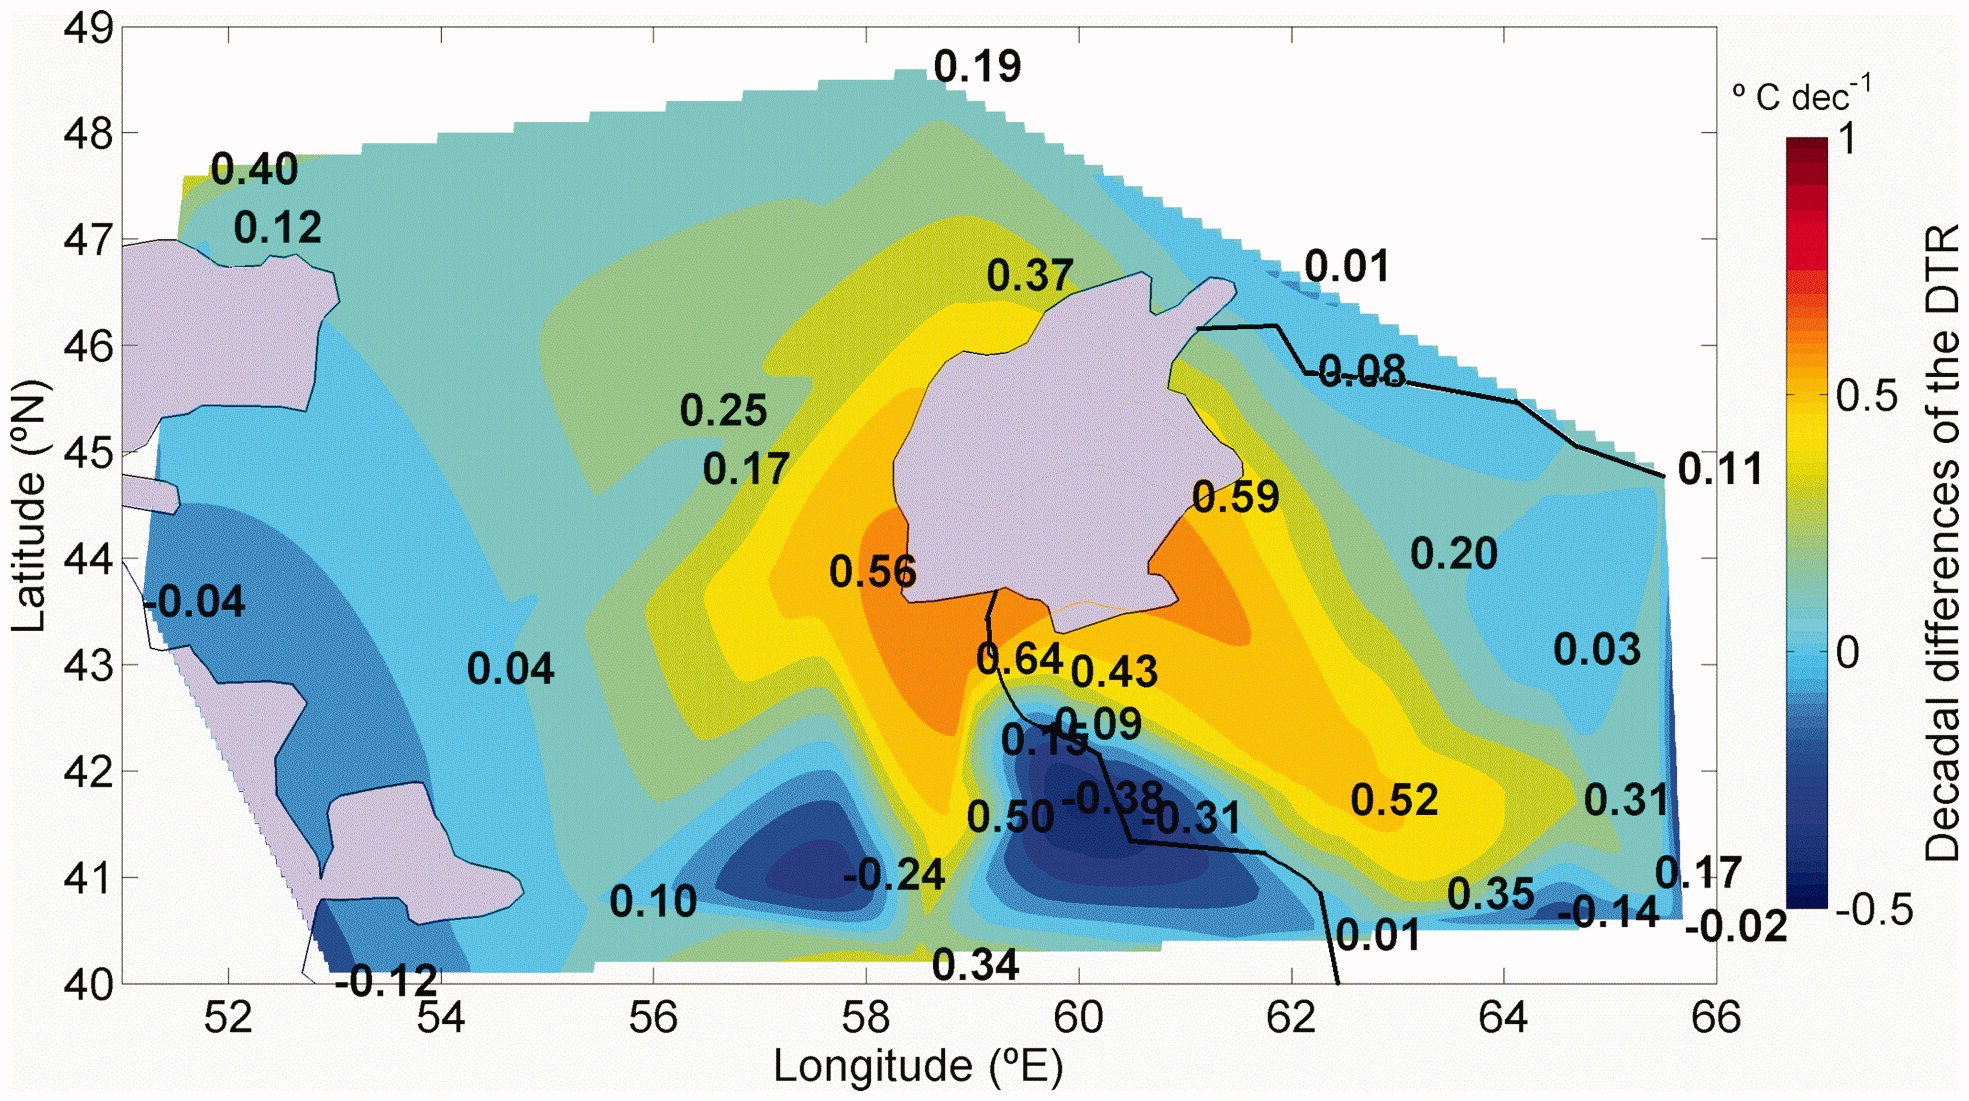
Fig. 4.
Differences of the annual mean of the DTR between the two consecutive decades: 1991–2010 and 2001–2010.
Differences of the seasonal mean of the temperature for subsequent decades in relation to the corresponding DTR variations
4.3.
To compare the variations of the DTR and of the temperature during the two studied decades, Fig. 5a presents the decadal variation of the monthly mean temperature (VAR-TEMPmean) and the monthly mean of the daily maximum and daily minimum temperatures (VAR-TEMPdmax and VAR-TEMPdmin) for the four averaged periods considered in the previous section. At the same time, the stations where the decadal differences of the DTR are negative are highlighted in yellow.
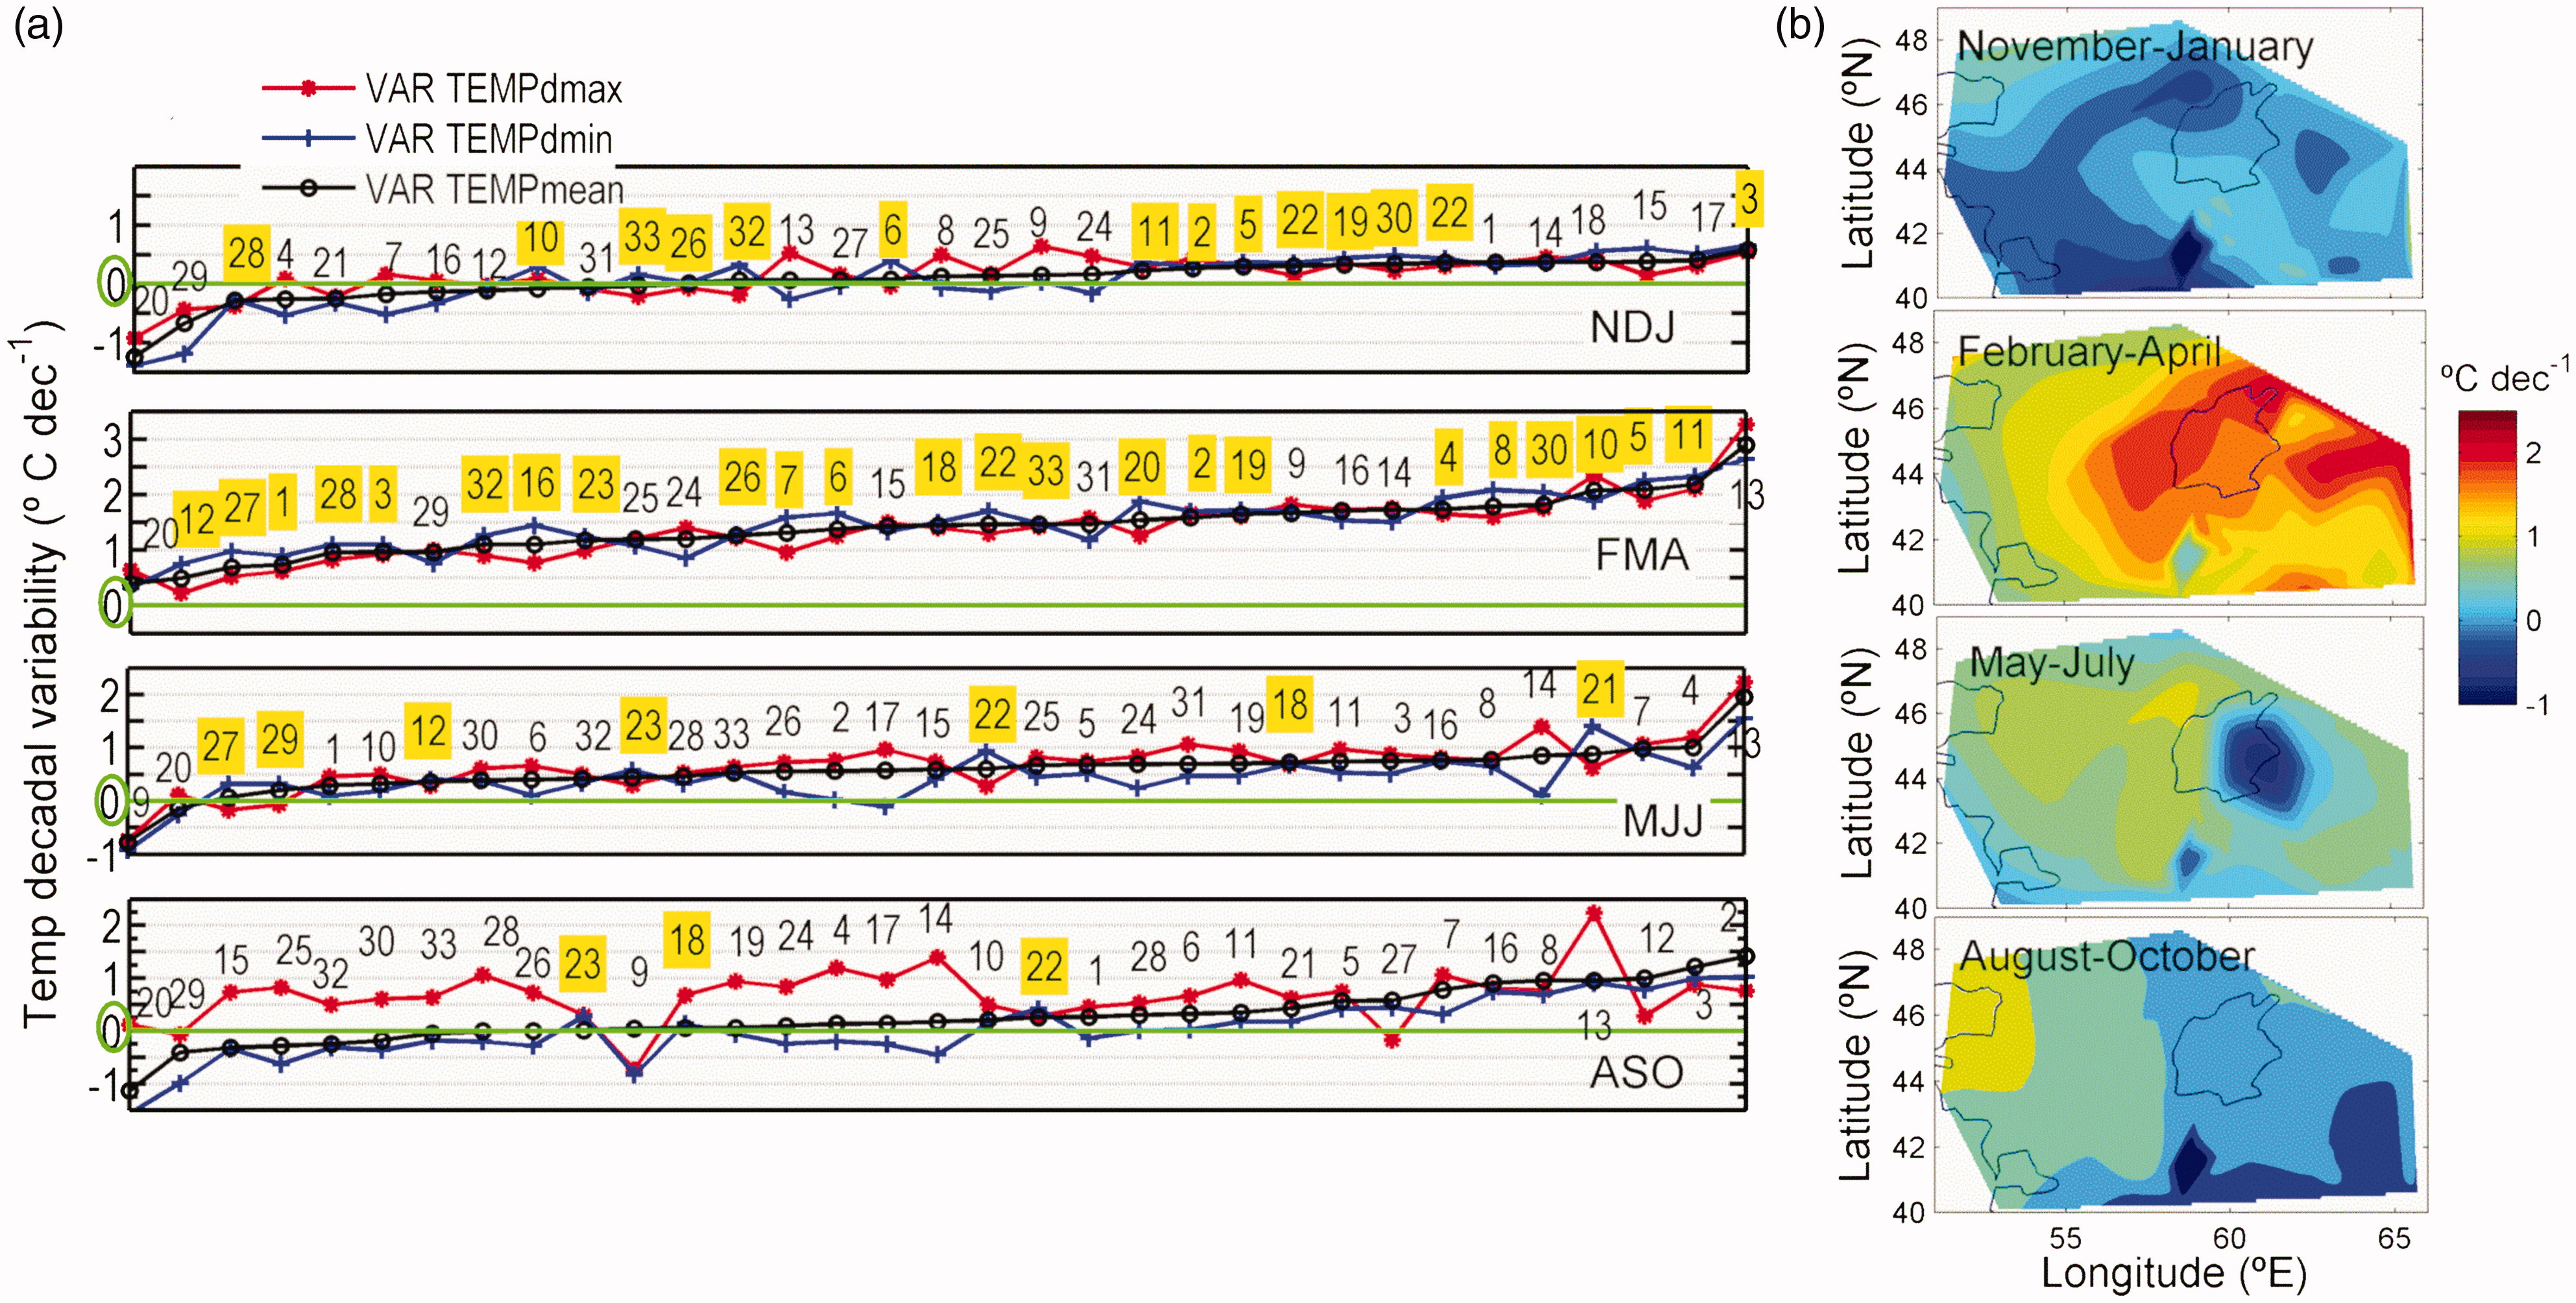
Fig. 5.
(a) Decadal differences of the mean temperature (VAR-TEMPmean) and of the minimum and maximum daily temperature (VAR-TEMPdmax, VAR-TEMPdmin). The averaged periods are: November–January (NDJ), February–April (FMA), May–July (MJJ), and August–October (ASO). Numbers are the references of the station represented for each point. At the stations highlighted in yellow, the decadal differences of the mean DTR are negative. (b) Spatial representation of the decadal differences of VAR-TEMPmean for the seasonal periods indicated in each plot.
In these plots, the stations have been sorted in ascending order using the values of VAR-TEMPmean. From August to October, VAR-TEMPmean encompasses the largest range of values (almost 3 °C dec−1: from –1.5 °C dec−1 to 1.5 °C dec−1), while the smallest range is from November to January (less than 2 °C dec−1: from about –1 °C dec−1 to 1 °C dec−1). Complementing these panels are those to the right (Fig. 5b), which contain a spatial representation of the values of VAR-TEMPmean. As observed, the higher temperature variations are from February to April, when VAR-TEMPmean is positive everywhere and as high as 2 °C dec−1 in the northern stations to the east of the studied region.
Figure 5a shows that, in general, from November to July (NDJ, FMA, MJJ), VAR-TEMPdmax and VAR-TEMPdmin follow the trend of VAR-TEMPmean within the range of ±0.5 °C dec−1 at most. However, from August to October (ASO), the VAR-TEMPdmax is more than 1 °C dec−1 greater than the VAR-TEMPmean at the stations located in the delta of the Amu Darya (sts. 18, 19, 17, 14), at others located further to the south and south-east (sts. 28, 29, 30, 24, 25, 26, 32, 15, 33, 26) and at st. 4 at the north-west of the Aral Sea. This indicates an increase in the extreme high temperatures in these regions. During the ASO period, at most of the other the stations VAR-TEMPdmax is also larger than VAR-TEMPmean, although the differences are smaller.
The maps in the panels to the right (Fig. 5b) reveal that the period of the year when the mean temperature increased most, between February and April, coincides with the period when the DTR trend is negative almost everywhere, as can be observed by looking at the reference numbers of the stations which are highlighted in yellow in panels to the left (Fig. 5a).
Decadal temperature differences considering different segmentation averaging throughout the year
4.4.
The temperature differences between the two decades presented in Fig. 5 have been analysed by considering the averaging periods that were chosen based on the DTR’s annual cycle observed in Fig. 2. However, when analysing only the temperature trend, it is more reasonable to choose the averaging periods based on the annual temperature cycle. Figure 6 presents the mean of the DTR and the temperature at all the stations during the two decades. The DTR remains high from May to October and peaks in June and August. However, the mean temperature peaks only once in July and maximum temperature values appear between June and August. Accordingly, to study the temperature trends it would be better to average within 3-month segments 1 month ahead of the DTR segmentation averaging, that is, December–February (DJF), March–May (MAM), June–August (JJA) and September–November (SON).
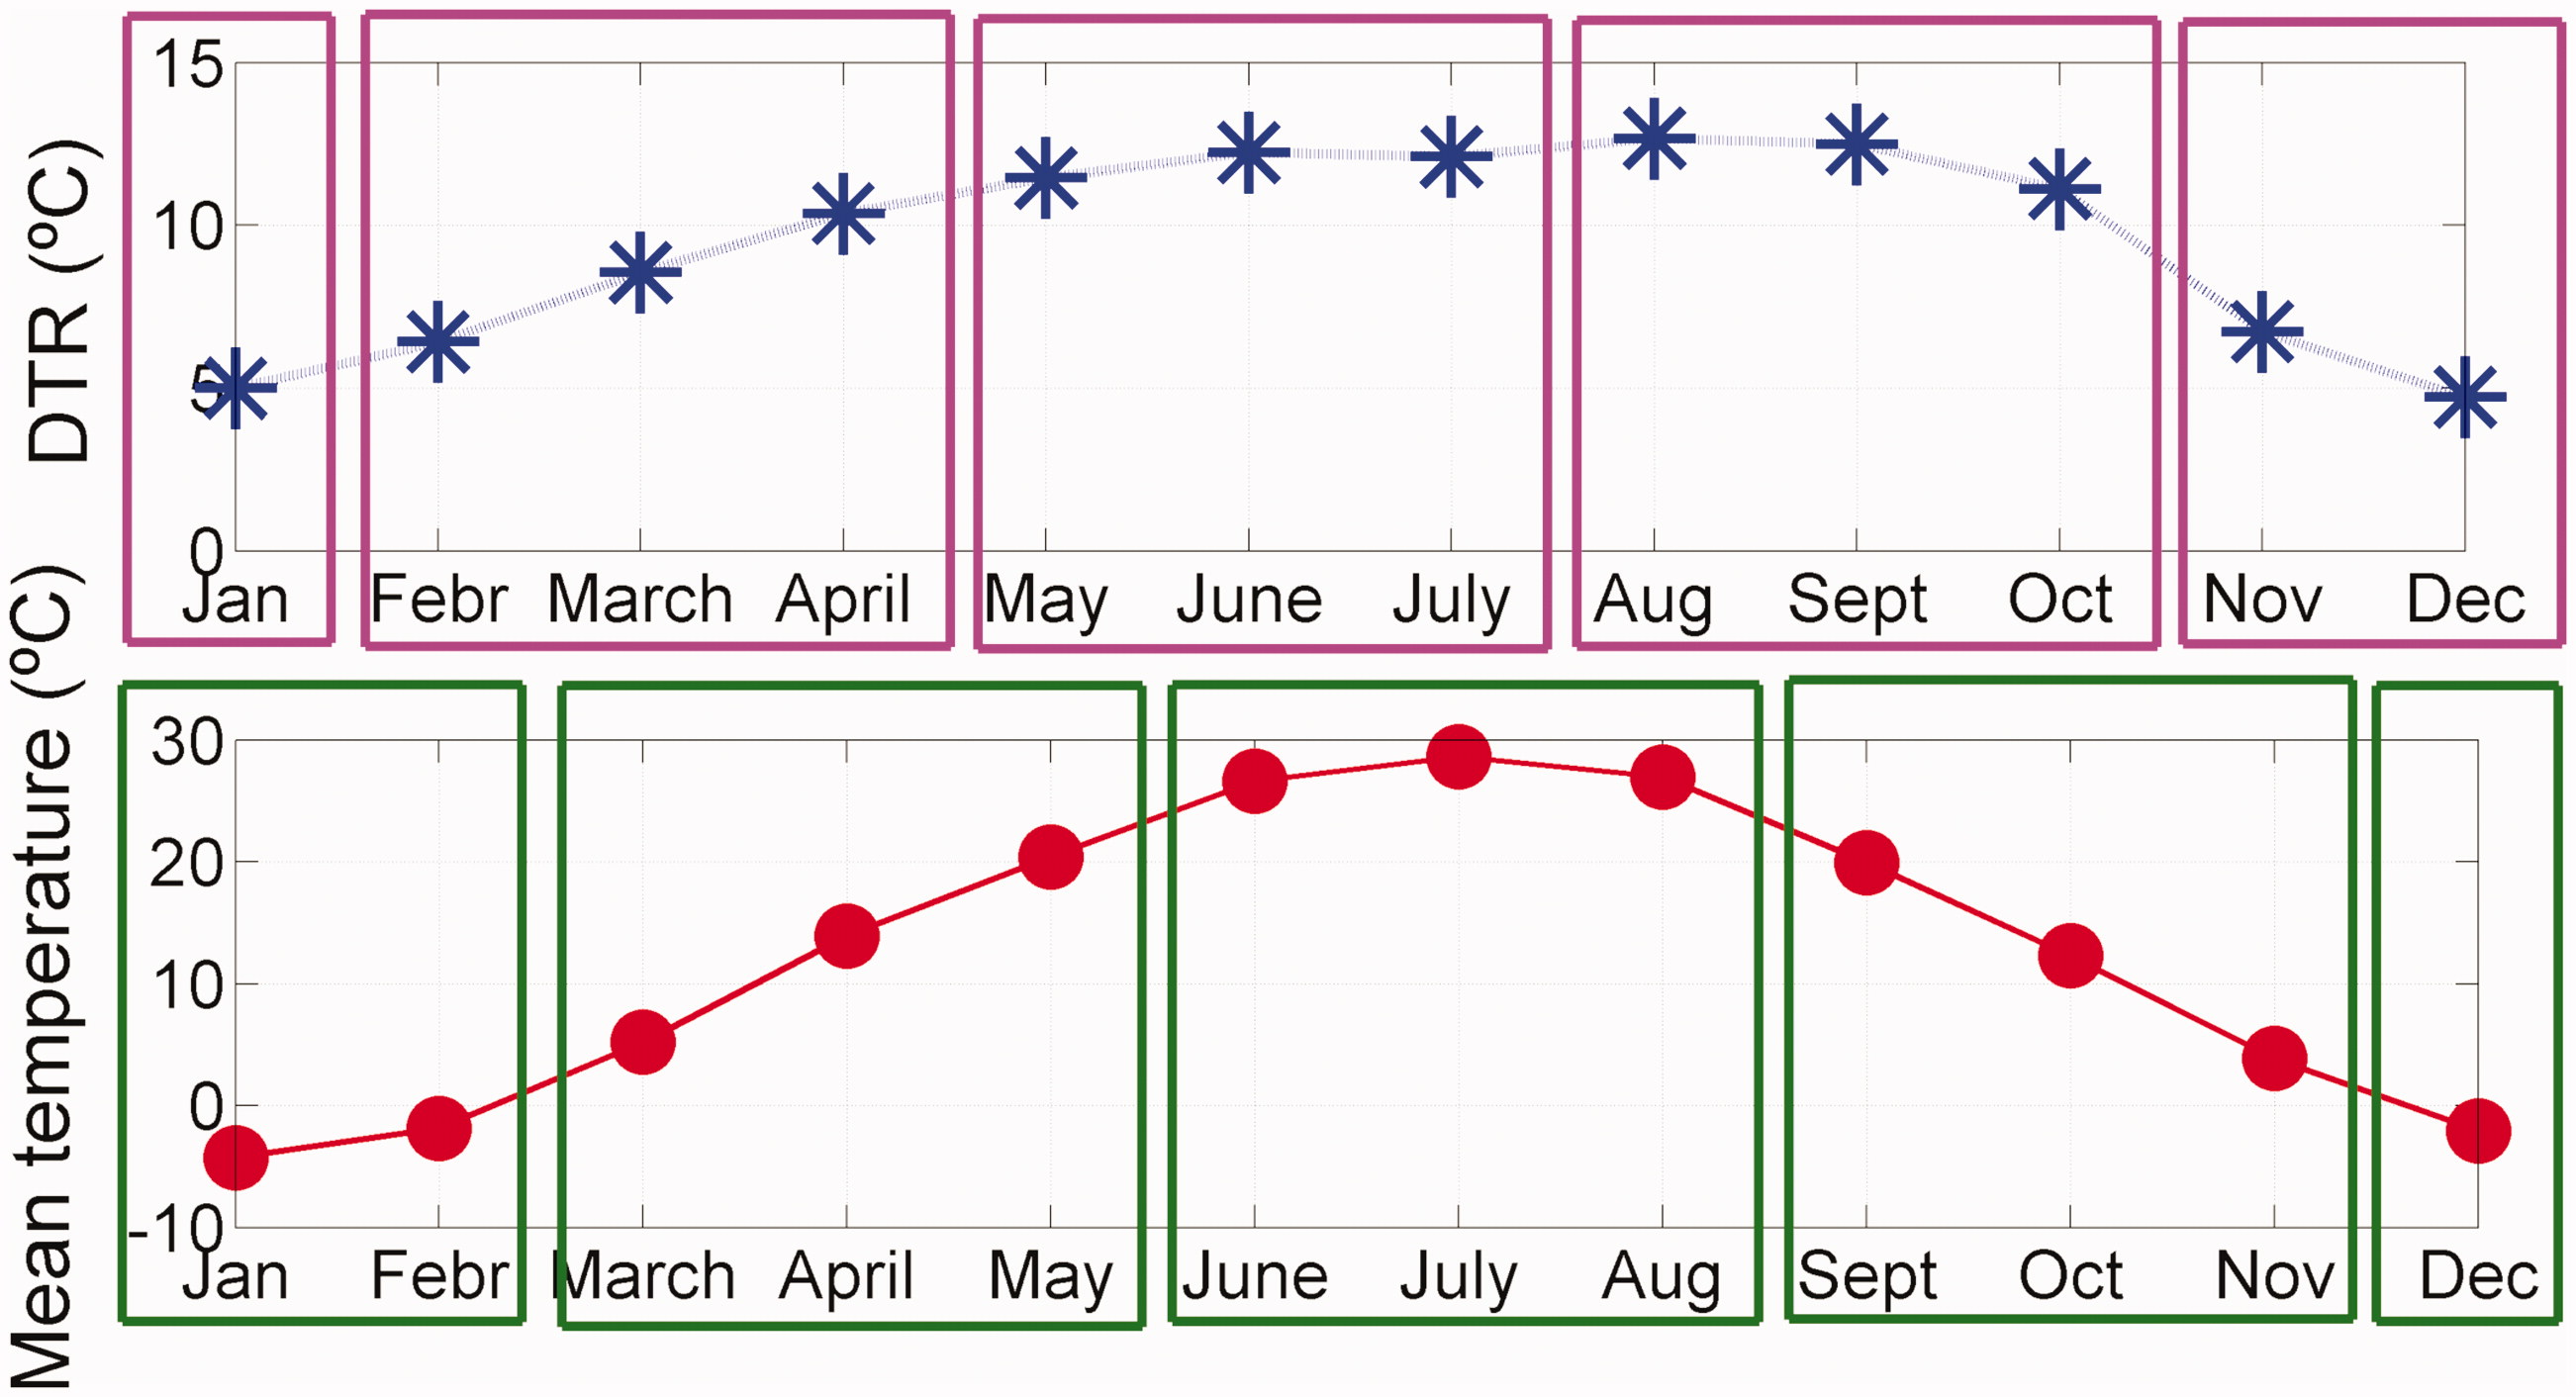
Fig. 6.
Mean curves for all the stations from 1991 to 2010 of the monthly averaged DTR and of the monthly mean temperature. The coloured rectangles indicate the natural period for averaging three consecutive months which appears when the DTR and mean temperature curves are considered.
Although not shown, the mean annual temperature of the studied region varies with the latitude from about 5 °C in the north to 16 °C in the south and the mean seasonal temperature ranges from –8 to 29 °C. Against this thermal backdrop, Fig. 7 depicts the differences in the mean temperature between the two decades studied for every station when considering the two different segmentation averagings. Differences of 0.5 °C dec−1 are easily found and sometimes even the sign of the trend changes depending on the segmentation. This is especially relevant around the winter season when the VAR-TEMPmean after averaging from November to January (NDJ) is negative in 10 stations, but when averaging from December to February (DJF) is negative in 24 stations. In general, in spring and summer the positive trends when averaging FMA and MJJ are larger than when averaging MAM and JJA.
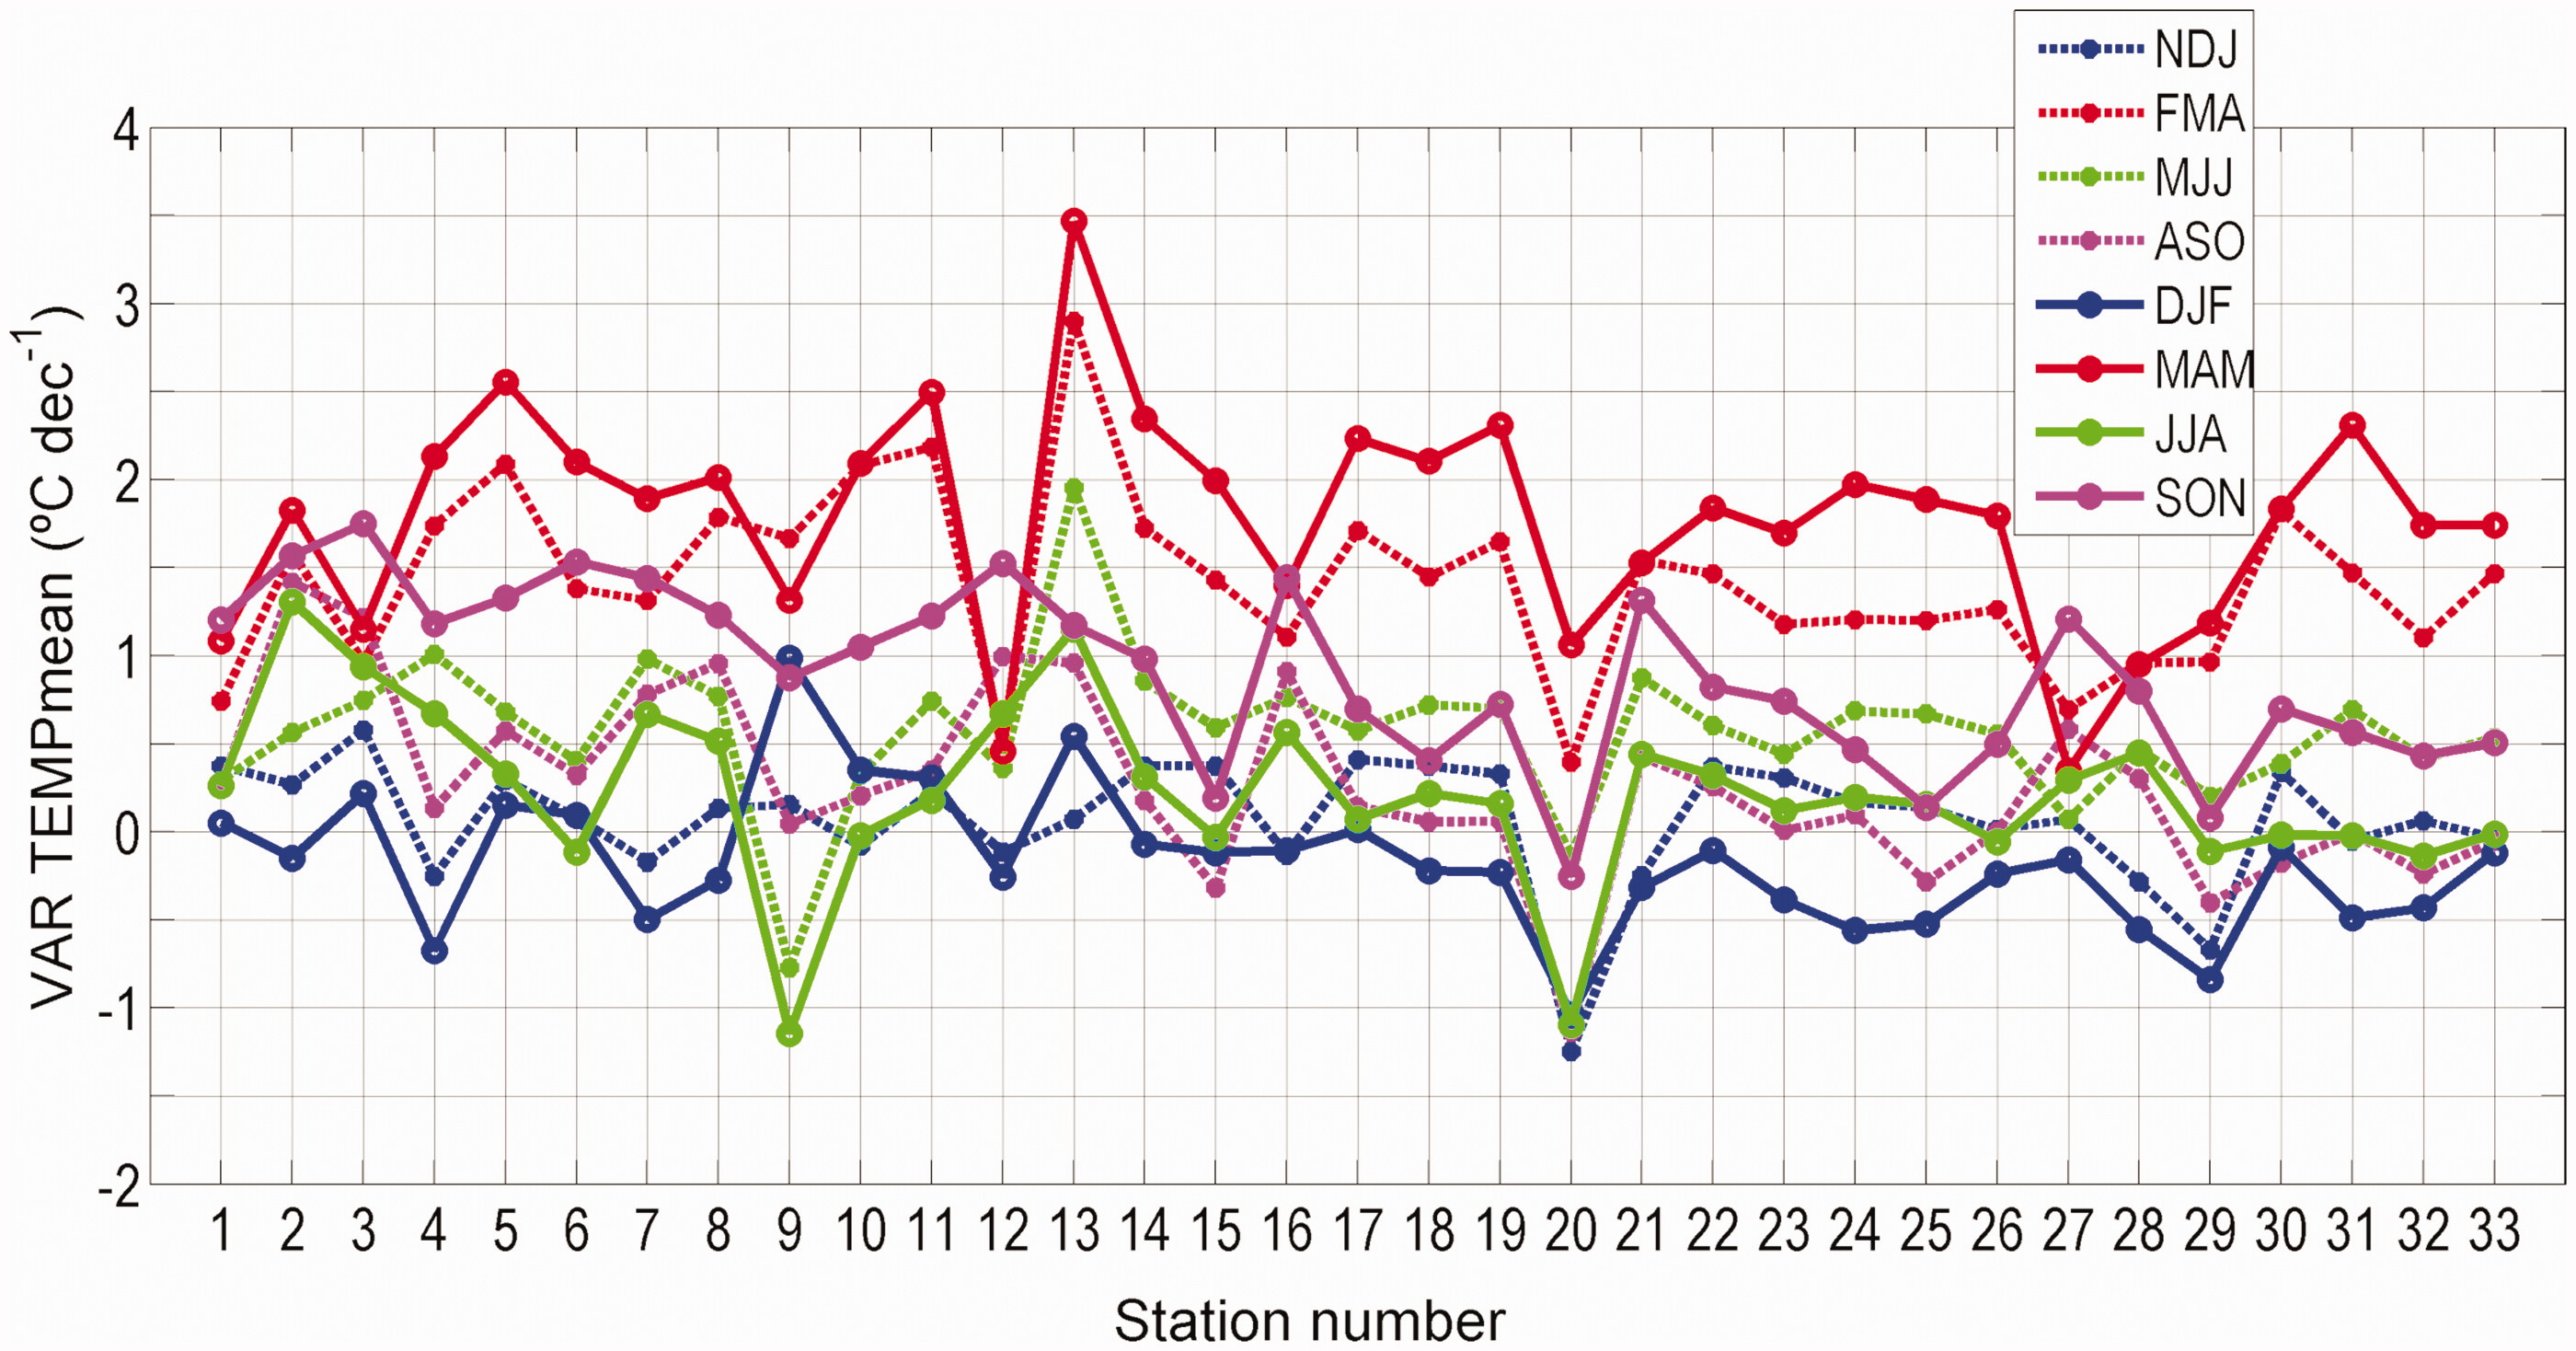
Fig. 7.
Decadal differences of the mean annual temperature (VAR TEMPmean) at each station considering two different averaging segmentations based either on the annual cycle of the DTR (NDJ, FMA, MJJ, ASO) or on the annual cycle of the mean temperature (DJF, MAM, JJA, SON).
Considering the stations available for this analysis, the maximum values of the temperature differences between the two decades for the entire region are observed in spring and the minimum values in winter, when they are almost neutral or slightly negative. The decadal differences of the mean annual temperatures for the entire studied region is of 0.6° ± 0.1 °C dec−1 (0.58 and 0.67 °C dec−1 depending on the averaging). The results from different segmentations differ because the weights to the data points depend on whether the averaged segment has missing data.
Summary and discussion
5.
Our results extend the role that the Aral Sea desiccation has been shown to have in triggering the DTR dynamics in the region until 2010, and they offer a detailed description of the spatial pattern of DTR differences between two decades, from 1991 to 2010. In the region studied, the monthly mean of the DTR varies between 3 and 18 degrees and maximum values are in spring and summer. In general the DTR values during the second decade of the study are higher but the variability from one year to the other is high in both decades.
On the annual time-scale (Fig. 4), the highest differences of the DTR between the two studied decades are found at the stations closest to the 1960 Aral Sea shoreline (up to about 0.6 °C dec−1). Considering the resolution given by the stations which are available, these high values extend to the neighbouring deserts, Kyzyl Kum, North Kara Kum, the East Ustyurt Plateau and the north-western region of the lake. Figure 4 shows that in the southern part of the Kyzyl Kum Desert the DTR trends are larger compared with the northern part. This difference may be related to the fact that they are in different climatic regions. Both regions are dry, but the northern part is cold while and the southern part is hot (Rachkovskaya, 2003), so the thermal balances are different. In fact, looking at the seasonal scale (Fig. 3), the largest differences between the north and the south of the Kyzyl Kum are observed from November to January, coinciding with the activity of Siberian anticyclones that induce frost and lasting snow cover in the northern part of the desert (Issanova and Abuduwaili, 2017). Khan and Holko (2009) also showed an increase in snow depth in the northern part of the Aral Sea basin during recent decades and a decrease in the southern part. Due to the thermal capacity and radiation shield properties of the snow, it could favour DTR stabilisation in the north.
To the south of the Aral Sea, the highest DTR differences between the two decades are observed in Fig. 4 at the stations located in the north of the Amu Darya Delta, where many lakes and other types of water bodies have disappeared during the studied period. Our data also show that, at the stations along the Amu Darya River, the positive DTR differences diminished with the distance to its mouth. At st. 21 (approximately at 41°N, 58°E), the DTR difference is negative while at the other stations surrounding it the difference is positive. This station is located between the Amu Darya River and Sarygamysh Lake, an ancient collector of drainage water that, contrary to the Aral Sea, has grown from 12 km2 in 1962 to 3955 km2 in 2006. This lake is within the Kaplankyr Reserve, established in 1979 to restore the region. Considering the influence of the lakes and land cover on the DTR and the high annual evaporation rate in Sarygamysh Lake (1.2–1.4 m yr−1 according to Orlovsky et al., 2014), it is reasonable to think that the lake’s development during the studied period is the origin of the negative value of the DTR difference observed at this station.
According to Fig. 4, at st. 5, close to the Small Aral shoreline, the DTR remains stable on the annual-time scale. During the two studied decades, the shoreline of the Small Aral receded up to 100 km, but after 2006, when the Kok-Aral Dam was completed, it returned 75 km. Khan et al. (2004) analysed data from the last two decades of the previous century to conclude that this area appears to be stable. However, on the seasonal scale (Fig. 3), from November to April the decadal difference of the DTR was negative (–0.37 °C dec−1 in FMA) and positive during the rest of the year (>0.20 °C dec−1). The negative value of the decadal DTR difference in spring is consistent with the positive trend of the total cloud cover identified in this region, which is associated with intensification of the activity of the South-Caspian, Murgab and Upper Amu Darya cyclones (Calbó et al., 2016). On the other hand, as observed in Fig. 5, from February to April (FMA) the trend of mean temperature at this station was one of the highest in the region (Fig. 5). Analogously, Fig. 7 shows that from March to May the difference in the mean temperature at st. 5 is above 2.5 °C dec−1, as is also the case in the other stations along the Syr Darya riverbed. On the annual time-scale, all these stations are also almost stable in terms of decadal differences of the DTR (Fig. 4).
Also from Fig. 4, the stations located on the western side of the lake appear to be affected either by the Aral Sea desiccation (high positive DTR decadal differences) or by the Caspian Sea (low or even negative DTR decadal differences) depending on their proximity to the respective water bodies. At its western site, the Aral Sea shoreline has not receded much, but the ratio between the area and the mean depth of the lake has diminished considerably (drops of about 0.6 m y−1 according to Peneva et al., 2004), so the thermal capacity of the remaining western lobe reduced its stabilising effect and the DTR increased as demonstrated for the previous decades by Small et al. (2001a). The seasonal cycle of the Aral Sea surface temperature (SST) ranges more than 28 °C (Zavialov, 2005) and from 1960 to 1996, the SST of the Aral Sea increased during the summer by 5 °C y−1 and decreased during the winter by 4 °C y−1 (Small et al., 2001b).
Previous studies found that in the period from 1960 to 2000, the average monthly air temperature in summer had increased between 2 and 6 °C dec−1, depending on the stations (Khan et al., 2004) and our data (Fig. 5) show that during the first decade of the 21st century the trend in summer remains about 2 °C dec−1, mainly in the north-east. Our analysis shows that during winter the air temperature in the south decreased. Although a discussion of the physical processes behind these changes is not the aim of this paper, mean temperature changes are expected to be related to variations in the general circulation which are described by Lioubimtseva et al. (2005). Tishchenko et al. (2013) also found that dominating blocking anticyclones over Eastern Europe after the mid-1980s started to shift from having the high-pressure ridge located to the east of the Volga River basin to having it located over the basin and so triggering long term positive air temperature anomalies in the Aral Sea Region (Table 2).
Table 2.
Main conclusions about the decadal variation (between 1990 and 2010) of the monthly mean of DTR in the studied region (considering the stations available) on annual and seasonal time-scales.
Acknowledgments
The present work was carried out within the framework of the CLIMSEAS exchange project funded by the European Commission under the grant FP7-IRSES-2009-247512 and has been finished thanks to the support of the Universitat de Girona through the program MPCUdG2016. Data used were downloaded from the RIHMI-WDC base by Vladimir A. Tischenko.
Disclosure statement
No potential conflict of interest was reported by the authors.
Supplementary material
Supplementary material for this article can be accessed https://doi.org/10.1080/16000870.2018.1513290.