
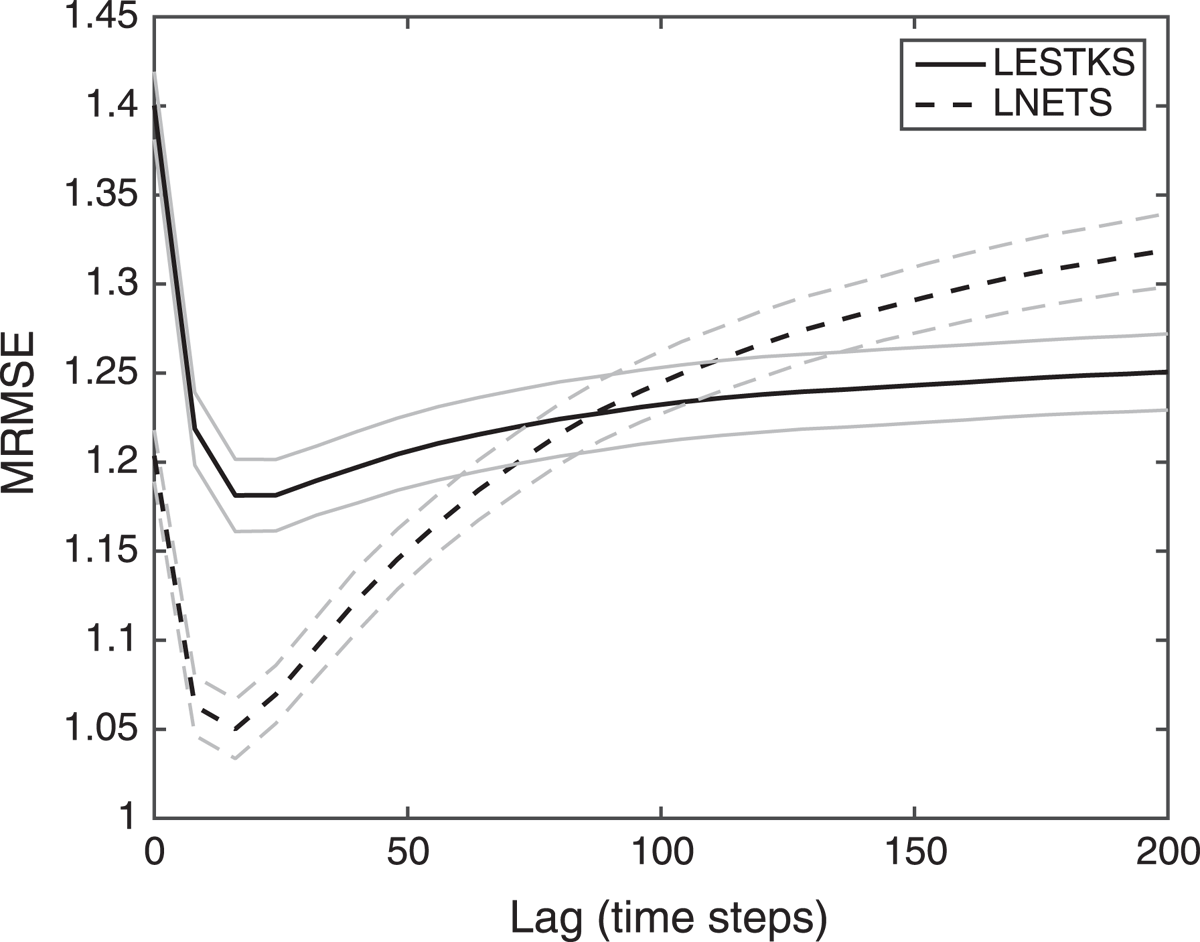
Figure 1.
The time-averaged RMS error of the state estimate in the Lorenz-96 model as a function of the smoother lag for the two smoothers NETS and LESTKS in the optimal configuration for an ensemble size of 60. The NETS uses a localisation radius of 7 grid points, while the LESTKS uses 12 grid points. The grey lines show a range of one standard deviation of the variability over 10 experiments. A lag of zero shows the MRMSE of the filters.
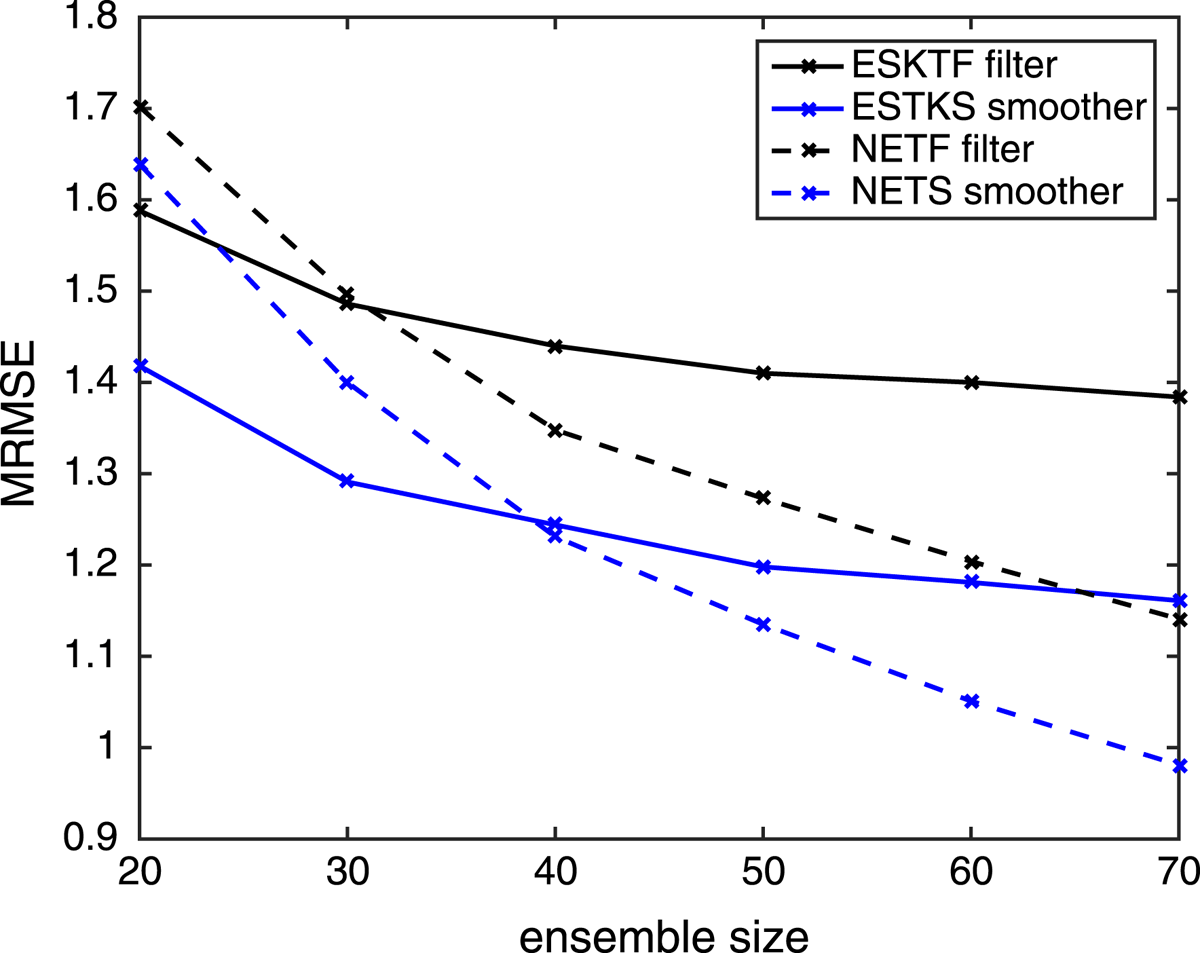
Figure 2.
The time-averaged RMS error as a function of the ensemble size. Shown are the LESTKF (black solid), LESTKS (blue solid), NETF (black dashed), and NETS (blue dashed). For the smoothers the MRMSE for the optimal smoothing lag is show.
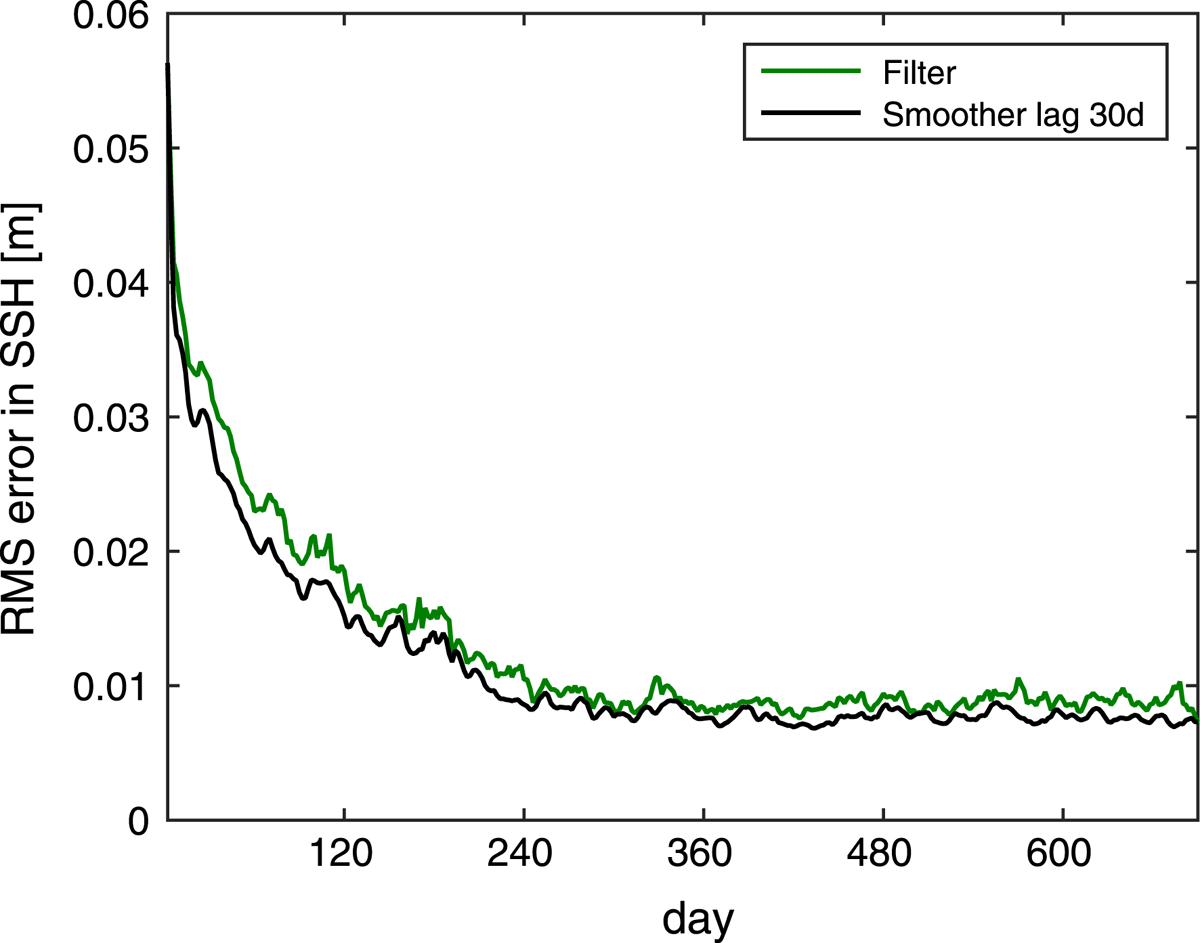
Figure 3.
The RMS error in the SSH at each assimilation time step over the assimilation time. Over the whole assimilation window, the errors in the smoother estimate (black) are lower than the errors of the filter estimate (green).
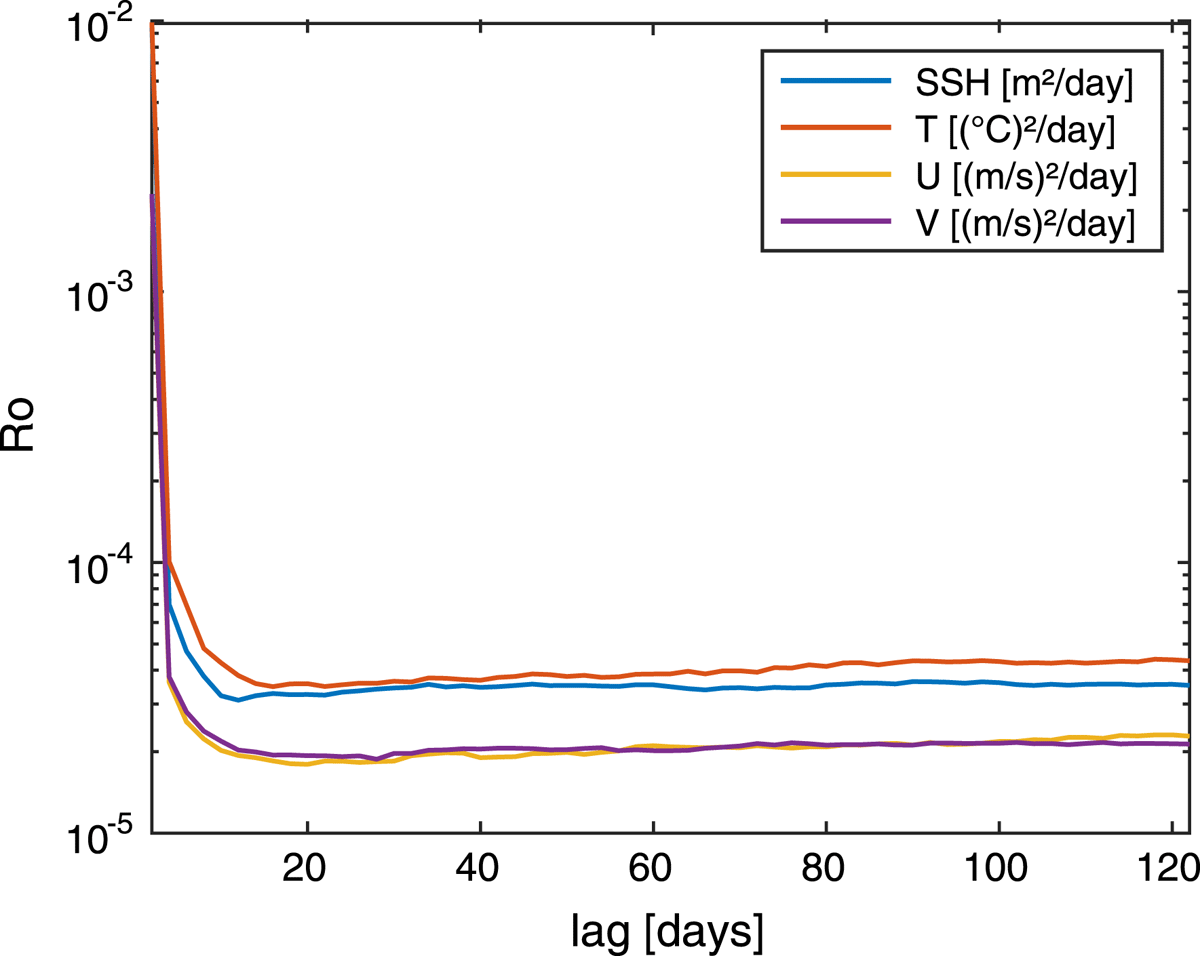
Figure 4.
Roughness of the assimilated and smoothed error-trajectories in semi logarithmic scale in dependence of the lag. The smoothing strongly reduces the roughness of the error-trajectory. Up to a lag of 12 days, the reduction is of about two orders of magnitude. For longer lags, the roughness stays almost constant for all fields.
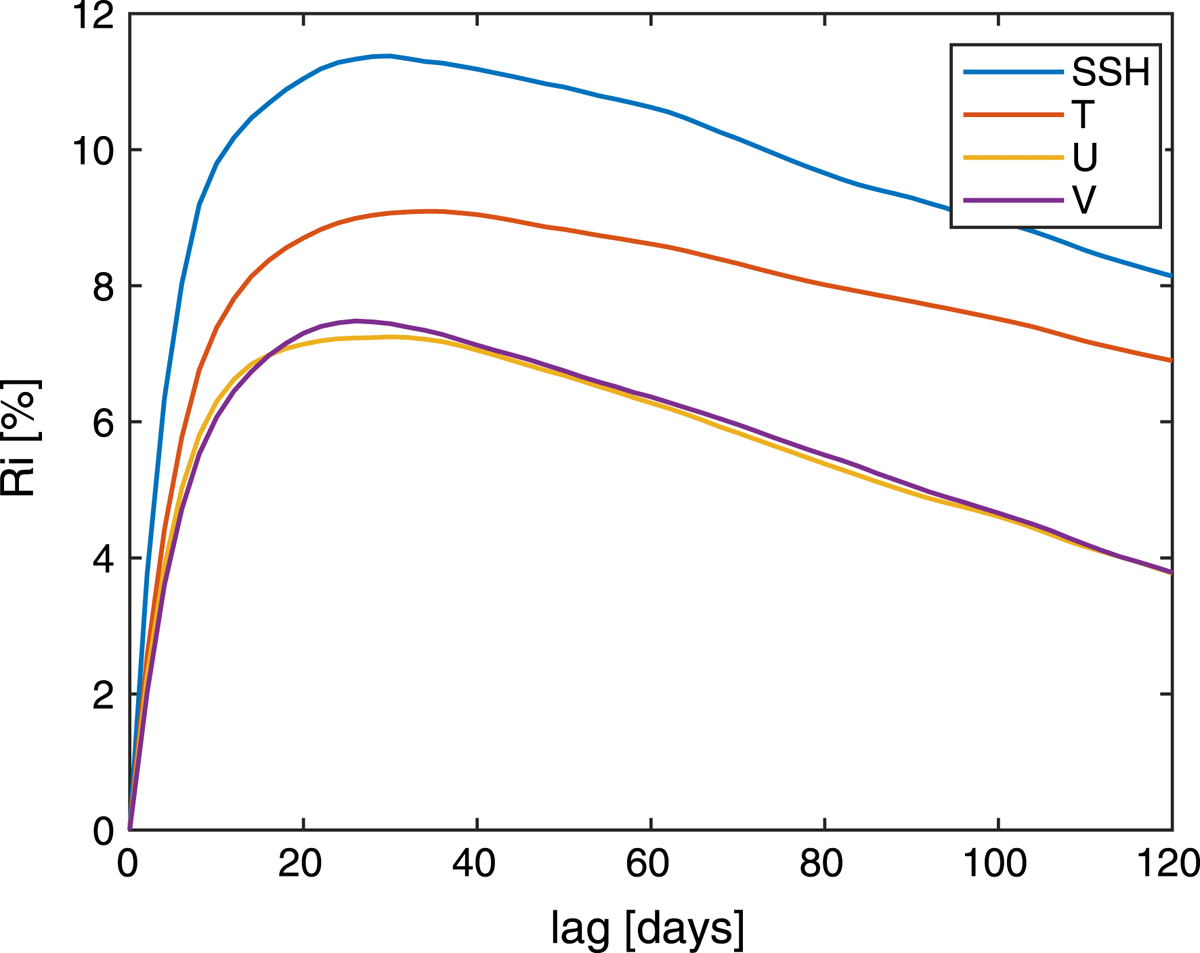
Figure 5.
Relative improvement of the NETS compared to the NETF. Increasing the smoothing lag too much reduces the relative improvement of the filter.
Table 1.
Minimal error, maximal relative improvement and range of optimal lags for all four variables for the NETS. For all variables, a common range of optimal lags exists.
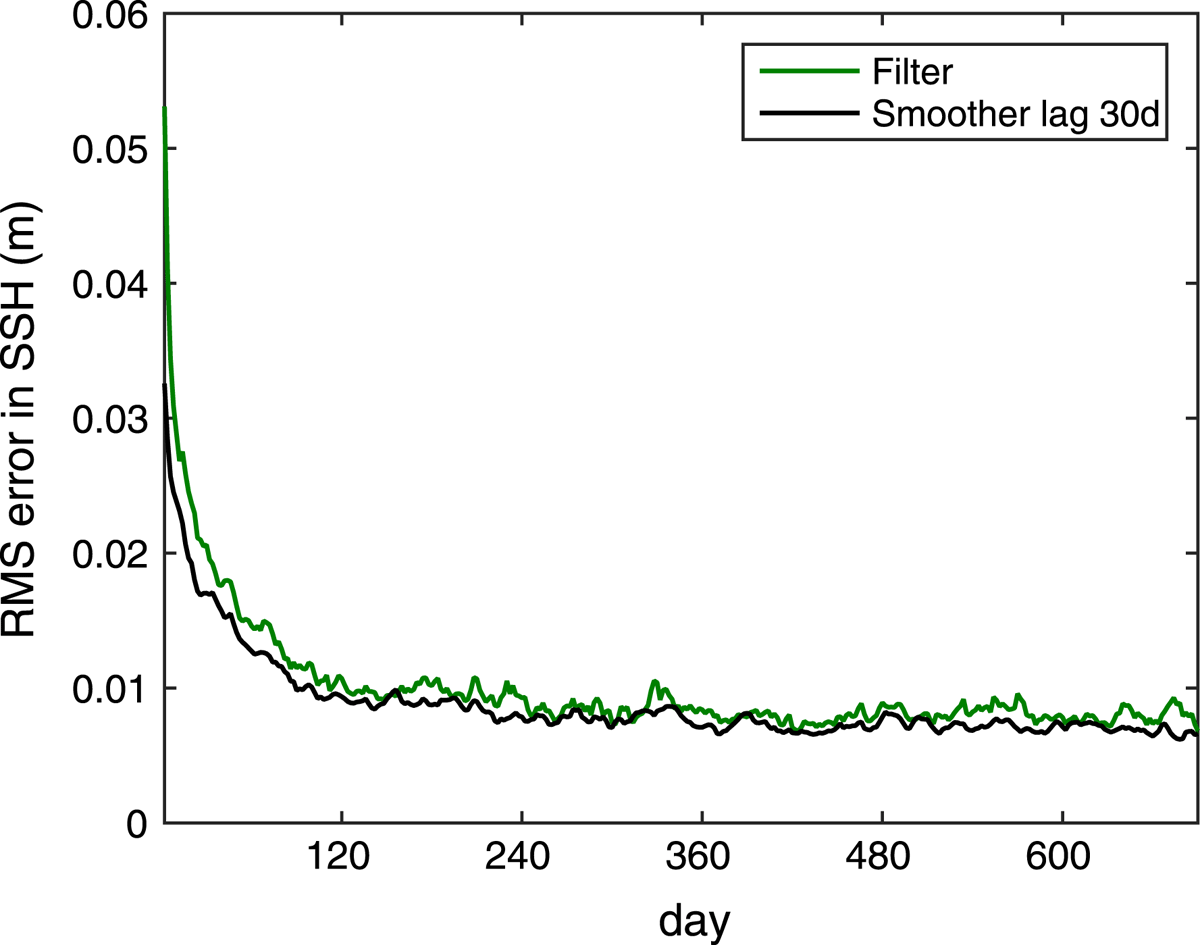
Figure 6.
The RMSE in the SSH over the assimilation time computed with the LESTKF and LESTKS. As for the NETF/NETS, the RMSE of the smoother estimate (black) is lower than in the filter estimate (green).
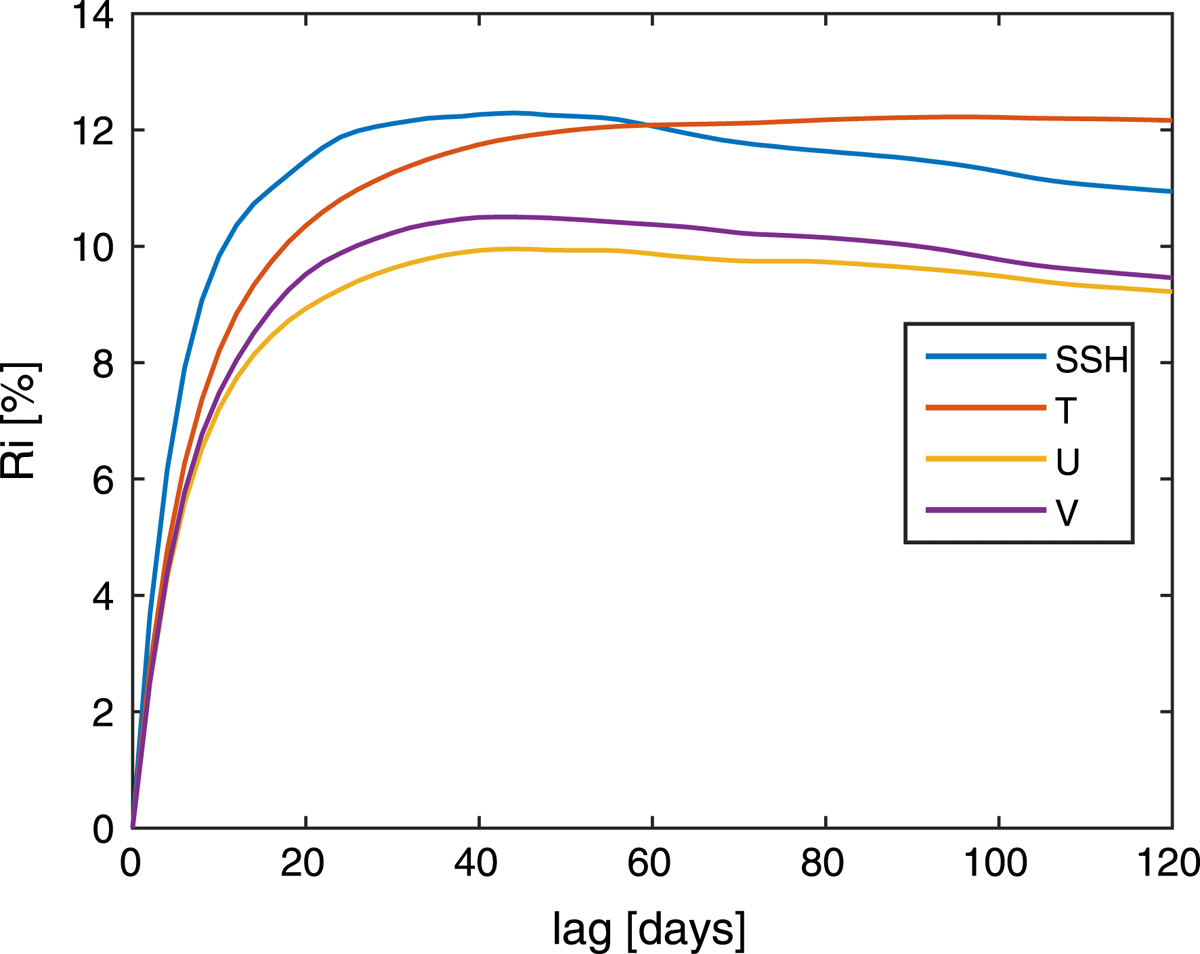
Figure 7.
The LESTKS reduces the error in each variable between 9 and 13 per cent. The improvement is largest in the observed fields SSH and T.
Table 2.
Minimal error, maximal relative improvement and range of optimal lags for all four variables for the LESTKS. For all variables, a common range of optimal lags exists.