Have a personal or library account? Click to login
Teachers' use of assistive listening devices in inclusive schools Cover

Teachers' use of assistive listening devices in inclusive schools

Open Access
|Mar 2014

Figures & Tables

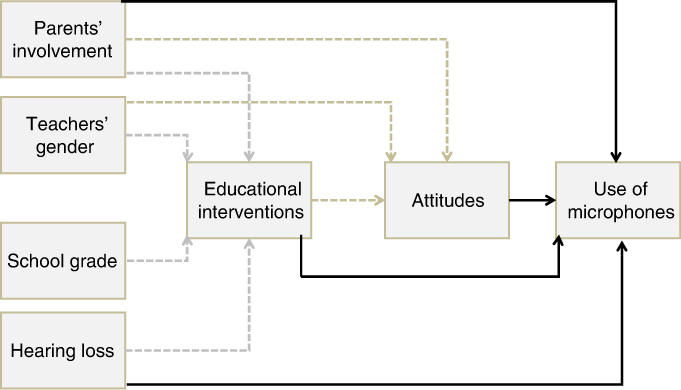
Figure 1.

The theoretical model of the interactions between microphones uses and the factors related to the teachers, students, parents, and educational and technical interventions represented by knowledge, class size, participation in classroom lessons, acoustics, loudspeakers, number of pupil-microphones, and errors with the microphones.

Table 1.

The distribution of teachers' gender, age, and school (%, N = 167).

Males32.1Females67.9Age  < 3010.2 31–5056.3  > 5133.5Primary school60.3Secondary school39.7
Table 2.

Use of assistive listening devices (%, N = 167).

Have teacher-microphones Yes90.5 No9.5Number of student microphones One microphone per more than five classmates14.3 One microphone per five classmates3.6 One microphone per four classmates11.6 One microphone per three classmates8.0 One microphone per two classmates47.3 One microphone per one classmates15.2Type of sound transmission system Loud speaker only49.7 Inductive loop with or without Loudspeaker29.8 FM with or without loudspeaker20.5
Table 3.

The distribution of the pupils' HL (%, N = 167).
Can hear speech without hearing aid at a distance of one metre58.9Can hear speech with hearing aids/cochlea implant at a distance of one metre30.4Cannot always hear speech with hearing aids/cochlea implant at a distance of one metre10.2Cannot hear speech with hearing aids/cochlea implant at a distance of one metre0.6
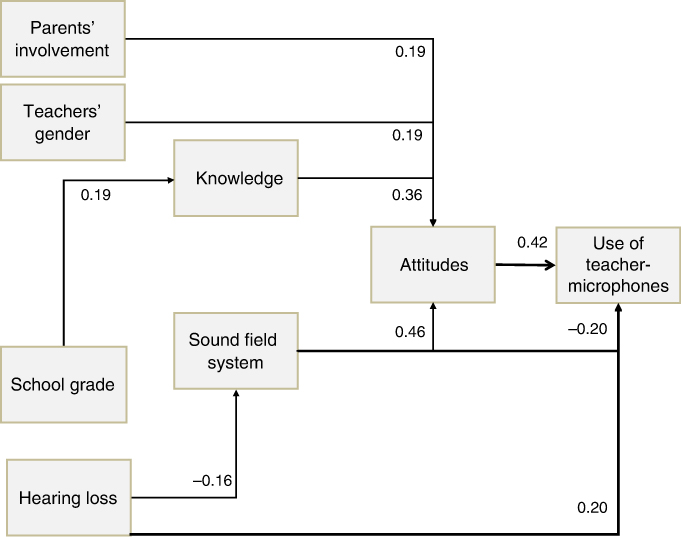
Figure 2.

The modified structural equation model of the relationship between the use of teacher-microphones and the factors related to the teachers, pupils, parents, and technical and educational interventions.
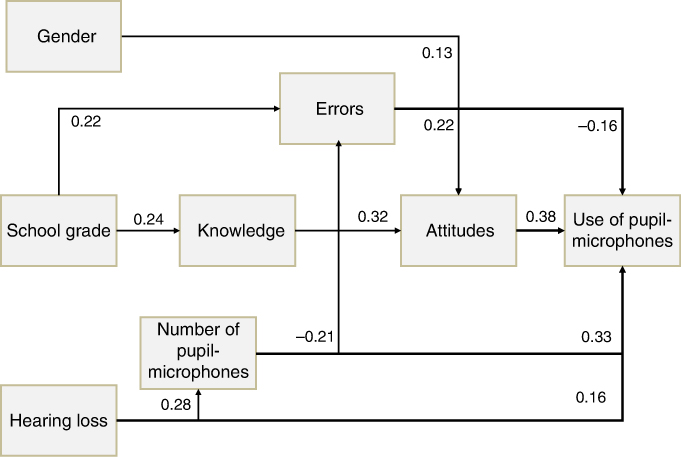
Figure 3.

The modified structural equation model of the relationship between the use of pupil-microphones and the factors related to the teachers, pupils, and technical and educational interventions.

Table 4.

The total effects that the variables in Figure 2 have on one another (standardised beta coefficients).

LoudspeakersKnowledgeParents' involvementHearing lossSchool gradeTeachers'genderAttitudesLoudspeakers–––−0.16–––Knowledge––––0.19––Attitudes0.450.360.19−0.070.070.19–Use of teacher-microphone−0.030.150.080.200.030.080.42
Table 5.

The total effects that the variables in Figure 3 have on one another (standardised beta coefficients).

KnowledgeNumber of pupil-microphonesErrorsHearing lossSchool gradeAttitudesKnowledge––––0.24–Number of pupil-microphones–––0.28––Errors–−0.21–−0.060.22–Attitudes0.32−0.050.230.010.12–Use of pupil–microphones0.120.34−0.070.260.010.38
Language: English
Page range: 297 - 315
Submitted on: Feb 3, 2012
Accepted on: Dec 16, 2012
Published on: Mar 4, 2014
In partnership with: Paradigm Publishing Services

© 2014 Ann Mette Rekkedal, published by Stockholm University Press
This work is licensed under the Creative Commons Attribution 4.0 License.