Have a personal or library account? Click to login
Examining the effect of networks for students with special educational needs Cover

Examining the effect of networks for students with special educational needs

Open Access
|Jun 2012

Figures & Tables

Table 1. Number of students represented in SKUD's cross-sectional study at project start and end.
Students representedProject start (nationwide n=54 students)Project end (3 regions n = 40 students)Mainstream school n = 30 studentsSEN school n = 24 studentsMainstream school n = 22 studentsSEN school n = 18 studentsTeachers20 (67%)22 (92%)8 (36%)14 (83%)Parents30 (100%)24 (100%)20 (91%)13 (75%)Students29 (97%)24 (100%)19 (86%)18 (100%)Note: Responses from teachers and parents correspond to the number of students they represent.
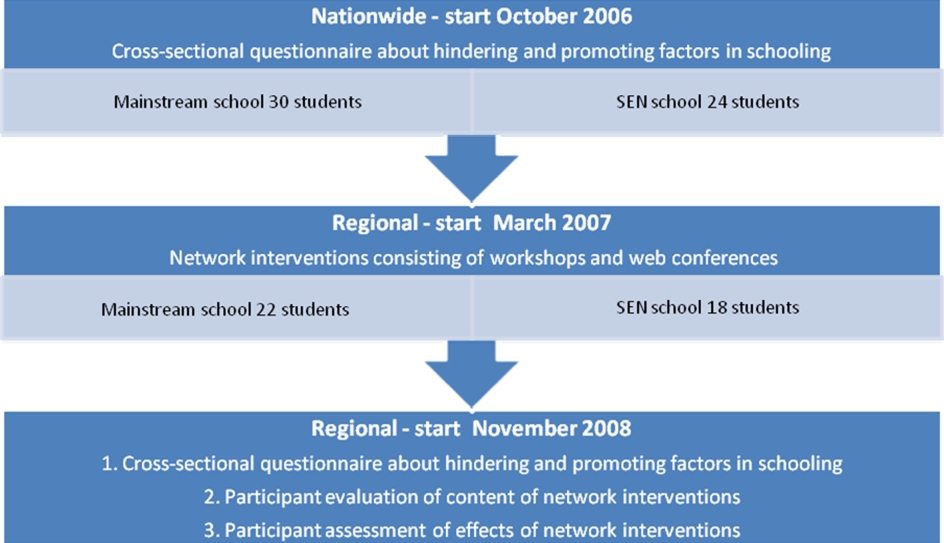
Figure 1. 

Flowchart of nationwide and regional questionnaires, network interventions, participant evaluations and assessments.

Table 2. Number of students represented at SKUD seminars and websites.

Students representedNetworkMainstream schoolSEN schoolSeminars for teachers of all students9 (41%, n = 22)13 (72%, n = 18)Seminars for parents of young students5 (38%, n = 13)1 (10%, n = 10)Seminar for old students1 (11%, n = 9)5 (63%, n = 8)SKUD06.dk for teachers of all students13 (59%, n = 22)15 (83%, n = 18)SKUD06.dk for parents of all students17 (77%, n = 22)6 (33%, n = 18)MSN Messenger for old students0 (0%, n = 9)3 (38%, n = 8)Note: The number of students which could have been represented are listed in parenthesis.

Table 3. Academic and cognitive skills and social profile of students with DMD.

Mainstream schoolSEN schoolYesNoDon't knowYesNoDon't knowAcademic level lower than peers (T + P)44 (63–25)39 (12–65)17 (25–10)82 (86–77)7 (0–15)11 (14–8)Good or fairly good at remembering academic information (T + P+S)73 (62–85–73)17 (25–15–11)10 (13–0–16)77 (64–85–83)17 (29–15–6)6 (7–0–11)Good or fairly good at remembering messages (T + P+S)62 (75–90–21)9 (12–10–5)29 (12–0–74)80 (78–84–78)7 (7–8–6)13 (15–8–16)Good or fairly good at concentrating on things he likes to do (T + P+S)89 (76–100–90)1 (0–0–5)10 (24–0–5)96 (93–100–94)0 (0–0–0)4 (7–0–6)Good or fairly good at concentrating on things he has to do (T + P)79 (62–95)15 (25–5)6 (13–0)93 (100–85)7 (0–15)0 (0–0)High or fairly high self–confidence (T + P)64 (63–65)27 (24–30)9 (13–5)78 (72–85)15 (14–15)7 (14–0)High or fairly high self–esteem (T + P)81 (75–85)11 (13–10)8 (12–5)85 (93–77)12 (0–23)3 (7–0)Shows good or fairly good social competences (T + P+S)89 (88–85–95)11 (12–15–5)0 (0–0–0)88 (86–84–95)4 (7–0–5)8 (7–16–0)Mostly has a say in recess activities (T + S)0 (0–0)91 (88–95)9 (12–5)10 (21–0)77 (71–83)13 (8–17)Classmates frequently visit student at home (P + S)66 (75–58)34 (25–42)0 (0–0)34 (46–22)63 (54–72)3 (0–6)Is frequently visited by other than classmates (P + S)54 (70–37)46 (30–63)0 (0–0)24 (31–16)70 (62–78)6 (7–6)Does frequently go places with classmate other than home (P + S)51 (70–31)39 (25–53)10 (5–16)33 (38–28)61 (54–67)6 (8–5)Note: Data listed as average (%) of total responses from the respondent groups first and answers from the respondent groups respectively are shown in parenthesis: Teachers (T), Parents (P), Students (S).

Table 4. Opinions and expectations of students with DMD at project end.

Mainstream schoolSEN schoolYesNoDon't noYesNoDon't noIs expected to write same amount of papers as classmates (T + P+S)58 (50–50–74)28 (37–25–21)14 (13–25–5)34 (21–38–44)43 (64–46–17)23 (15–16–39)Has same amount of homework as classmates (L + E)82 (63–100)12 (25–0)6 (12–0)70 (57–83)23 (28–17)7 (15–0)Is given special consideration during class periods (T + P+S)32 (25–35–37)61 (75–45–63)7 (0–20–0)35 (50–23–33)58 (43–69–61)7 (7–8–6)Is given special consideration during recess (T + P+S)21 (37–10–16)71 (63–70–79)8 (0–20–5)36 (36–38–33)59 (64–46–67)5(0–16–0)Has considered changing school (T + P+S)17 (25–15–10)80 (75–85–79)3 (0–0–11)39 (7–0–11)55 (86–100–78)6 (7–0–11)Expects to take 9th grade exam (T + P+S)72 (63–90–63)7 (12–5–5)21 (25–5–32)11 (0–15–17)50 (79–54–17)39 (21–31–66)Expectations re. qualifications for mainstream upper secondary school (T + P+S)53 (38–70–53)15 (25–5–16)32 (37–25–31)11 (0–16–17)49 (86–38–22)40(14–46–61)Will an extra year (10th grade) improve qualifications for upper secondary school (T + P+S)49 (50–45–53)14 (0–20–21)37 (50–35–26)33 (21–62–17)29 (50–15–22)38 (29–23–61)Do you/your son expect he will have a job as an adult (P + S)52 (50–53)10 (20–0)38 (30–47)28 (23–33)4 (8–0)68 (69–67)Note: Data listed as average (%) of total responses from the respondent groups first and answers from the respondent groups respectively are shown in parenthesis: Teachers (T), Parents (P), Students (S).

Table 5. Organizational, environmental and resource factors for students with DMD at project end.

Mainstream schoolSEN schoolYesNoDon't noYesNoDon't noDo you as a teacher/does the teacher know enough about muscular dystrophy (T + P)28 (37–20)27 (13–40)45 (50–40)52 (43–61)15 (7–23)33 (50–16)Are there rooms at school the students cannot access because of muscular dystrophy (T + P+S)20 (0–35–26)71 (88–60–63)9 (12–5–11)11 (14–8–11)86 (86–84–89)3 (0–8–0)Does the student receive practical help in school (T + P+S)75 (50–90–84)21 (38–10–16)4 (12–0–0)90 (88–94–88)6 (6–6–6)4 (6–0–6)Is the scope of practical help appropriate (T + P+S)86 (88–80–89)8 (0–15–11)6 (12–5–0)85 (71–84–100)10 (21–8–0)5 (8–8–0)Are there any problems related to the practical help at school (T + P)21 (12–30)58 (50–65)21 (38–5)11 (7–16)63 (57–69)26 (36–15)Does the student have a computer at school (T + P+S)85 (100–75–79)12 (0–15–21)3 (0–10–0)84 (87–77–89)11 (7–15–11)5 (6–8–0)Does the teacher-parent cooperation work (T + P)68 (50–85)7 (0–15)25 (50–0)79 (64–93)3 (0–7)18 (36–0)Note: Data listed as average (%) of total responses from the respondent groups first and answers from the respondent groups respectively are shown in parenthesis: Teachers (T), Parents (P), Students (S).

Table 6. Effect of network interventions for students with DMD.

Mainstream schoolSEN schoolYesNoDon't noYesNoDon't noHas SKUD given you/the teachers more knowledge about muscular dystrophy (T + P)45 (50–40)12 (0–25)43 (50–35)56 (50–62)11 (14–8)33 (36–30)Has SKUD changed the student's social competences (T + P)34 (63–5)55 (25–85)11 (12–10)7 (0–15)63 (79–46)30 (21–39)Has SKUD changed the schools requirements of expectations of the student (T + P)25 (25–25)49 (63–35)26 (12–40)19 (15–23)47 (71–23)34 (14–54)Has SKUD changed your perception of the student's need for practical help (T + P)21 (37–5)79 (63–95)0 (0–0)18 (22–16)64 (57–69)18 (21–15)Has SKUD changed the student's academic competences (T + P)2 (0–5)69 (63–75)29 (37–20)11 (0–23)63 (79–46)26 (21–31)Has SKUD influenced the student's ability to remember and concentrate (T + P)0 (0–0)85 (75–95)15 (25–5)7 (0–15)55 (71–39)38 (29–46)Has SKUD made you aware of the need for changes to the school's accessibility (T + P)40 (0–80)55 (100–10)5 (0–10)11 (7–16)74 (86–61)15 (7–23)If SKUD was permanent, would you participate (T + P)82 (88–75)11 (12–10)7 (0–15)85 (93–77)11 (7–15)4 (0–8)Note: Data listed as average (%) of total responses from the respondent groups first and answers from the respondent groups respectively are shown in parenthesis: Teachers (T), Parents (P).

Table 7. Evaluation of SKUD.

Mainstream schoolSEN schoolTeachers (n = 8)Parents (n = 20)Teachers (n = 14)Parents (n = 13)Has SKUD met your expectations?9.2 (8–10)5.1 (0–10)5.9 (0–10)5.9 (0–10)Outcome of physical networks and seminars7.8 (0–10)2.9 (0–10)3.9 (0–10)2 (0–8)Outcome of virtual network and SKUD06.dk3.8 (0–9)3.3 (0–8)3.2 (0–6)2.5 (0–8)Note: Mean assessment on a scale from 0 to 10, where 0 means ‘No/Nothing’ and 10 means ‘A lot’. Range in parentheses. Data at project end.
Language: English
Page range: 126 - 147
Submitted on: Dec 4, 2009
Accepted on: Nov 5, 2010
Published on: Jun 2, 2012
In partnership with: Paradigm Publishing Services

© 2012 Ann-Lisbeth Højberg, Jørgen Jeppesen, published by Stockholm University Press
This work is licensed under the Creative Commons Attribution 4.0 License.