
Forensic scientists in the United States and abroad are engaged in efforts to ensure that their conclusions are accurate, are based in sound empirical methods, and are communicated transparently and clearly to law enforcement officials, attorneys, triers of fact, litigants, and other consumers of forensic science. Organizations such as the National Institute of Standards and Technology (NIST, see Organization for Scientific Area Committees, or OSAC),1 the Department of Justice, the National Institute of Justice, and the National Science Foundation have established several initiatives to improve the reliability and validity of examination methods and procedures. These organizations seek to standardize conclusion measures and language across disciplines to improve the communication of findings, and to standardize professional education and training standards in various forensic fields. They also seek to address the many sources of cognitive bias that arise when scientific knowledge is produced by humans who are acting within various systems of professional roles and standards.
The field of cognitive ergonomics examines cognitive processes with the goal of improving task performance in work and operational settings. Scientists who work in this field study the interaction between the systems and the environments in which work is performs and memory, perception, reasoning, decision making, skilled performance, and human reliability [2].
Relational models of visual search demonstrate that visual attention can be guided by attending to specific feature values such as color, size, or intensity, by inhibiting attention to irrelevant features, or by directing attention to how stimuli differ. Many current theories of attention propose that attention is based on both bottom- up and top-down attentional systems. The interaction between saliency-based (top-down) and feature specific (bottom-up) attentional mechanisms guide when and how we deploy our attentional resources. Our attention is also guided by relational information, such as how the features of a non-target differ from the relevant features of the target). According to Stefani Becker, rela tional attention models offer more directional, or specific, information about target and non-target differences than do other attentional models [3].
Although handwriting examination is a purposeful, goal-directed (bottom-up) deployment of visual attention, the top-down, saliency-based mechanism continues to interact as handwriting examiners compare writing samples. Attention to relational information may be influenced by conditions that are both internal to the examiner and part of the external environment. Here we report partial findings from our international study of cognitive human factors and the methods and procedures used by forensic document examiners during handwriting examinations. Our research incorporates vision science, social and cognitive psychology, and forensic practice, using an interdisciplinary approach to investigate the relationship between the characteristics of the questioned and known writing, and the visual context created by the position of the questioned and known signatures, on examiner decision accuracy.
The experiment described here examined the relational and feature matching characteristics of attention during comparisons of questioned and known signatures. Specifically, we addressed how the presentation of questioned and known signatures during signature comparisons was related to participant gaze behavior during the examination, and how gaze behavior was related to characteristics of the writing, characteristics of the visual context, and examiner decision accuracy.
Methods
Participants and Recruiting
Eighty-five government lab-affiliated and independent examiners participated. Of these, 14 (16.5%) were Australian, 13 (15.3%) were Canadian, and the remaining 58 (68.2%) were U.S. examiners. We recruited participants using a modified snowball technique in which the research team attended professional meetings to present information about the project and to personally invite attendees to participate. Participants were accepted on a first come, first-served basis. Respondents were free of visual impairments such as color-blindness or other conditions which might impair their ability to properly see the visual stimuli. Of the 65 participants who wore corrective lenses, we were unable to gather eye tracking data for three participants whose lenses prevented data capture by the eye tracking equipment. Although we did not record fixation counts or fixation durations for these individuals, they were still able to provide valuable opinion information, and participated in all phases of the project. One examiner was unable to complete the entire data collection due to a schedule conflict. All data available for every examiner were included in our analyses.
Materials and Equipment
All eye tracking protocols were conducted with Tobii Pro X2-60® stand-alone eye tracking systems, using Tobii Studio© software (version 3.4.5, Tobii Technology, Stockholm, Sweden). All eye tracking protocols were performed using Dell Precision 7710 laptop computers (Intel Core i7-6820HQ CPUs, 2.7GHz, 8GB RAM, 64-bit Windows 7 operating system, Osprey capture cards).
Signature stimuli. Genuine and simulated signatures were produced by approximately 100 writers on Wacom® Intuos 3 digitizing tablets with Wacom® Intuos 3 inking pens and Neuroscript MovAlyzeR® software. This enabled capture of handwriting speed and pressure data for each signature.
Our FDE subject matter experts classified signature types as either text-based (in which each allograph of the name was clearly written) or stylized (in which one or fewer allographs are legible) [4]. We further classified signatures as either high- or low-complexity using Found and Rogers’ method of evaluating the number of turning points, line intersections, and retrace strokes in a signature [5]. The final 56 stimulus signatures selected for all the eye-tracking experiments in our larger study represented the range of writings FDEs might encounter in casework. These signatures were scanned into a computer using an Epson Expression model 11000XL scanner (600dpi) and Adobe Photoshop© (v. 17). Images were saved as 8-bit grayscale 1024 x 768-pixel jpeg files (10 maximum quality) to enable their display on the eye tracking systems.
Overall, we created five different presentation formats in which we varied the spatial location of the questioned and known signatures. The signatures were presented against a dark gray visual noise background to minimize eye strain from the white screen background. This also reduced the amount of ambient light from the display, allowing participants’ pupils to dilate more fully, improving the eye-tracker’s ability to detect the infrared light reflected from their retinas.
We created two versions of the eye-tracking experiments, in which we counterbalanced the presentation of the questioned signature to control for possible confounding variables. We did this to ensure that the effects we were observing (the number of fixation counts in known signatures when they were adjacent to the questioned signatures) were due to the placement of the questioned signature and not to characteristics of the writing. Questioned signature placement in experiment version 1 was determined by even-odd split so that in all odd-numbered questioned/known comparisons (i.e., 1, 3, 5…19) the questioned signature appeared to the left of the knowns, and in all even-numbered comparisons (i.e., 2, 4, 6…20) the questioned signature appeared to the right of the knowns. In experiment version 2 the placement was reversed so that in the odd-numbered comparisons the questioned signatures appeared to the right of the knowns, and in the even-numbered comparisons appeared to the left of the knowns. Figures 1, 2, 3 present examples of the stimuli for each of the five eyetracking protocols.
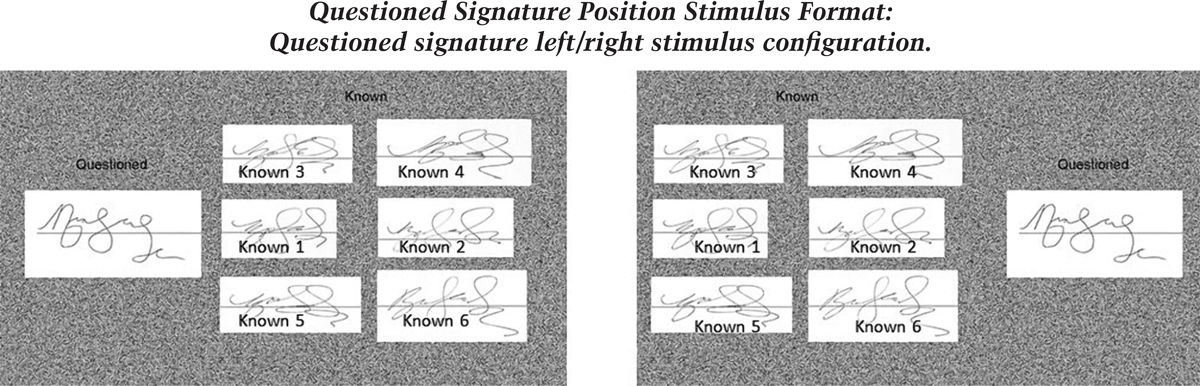
Figure 1
An example of two counter-balanced stimuli for the Questioned Signature Position format as they were displayed on the eye-tracking system. These stimuli differ only in the position of the questioned and known signatures. The order of the known signatures did not vary, so that in the left example known signatures 1, 3, and 5 were adjacent to the questioned signature. In the example on the right, signatures 2, 4, and 6 were adjacent to the questioned signature.
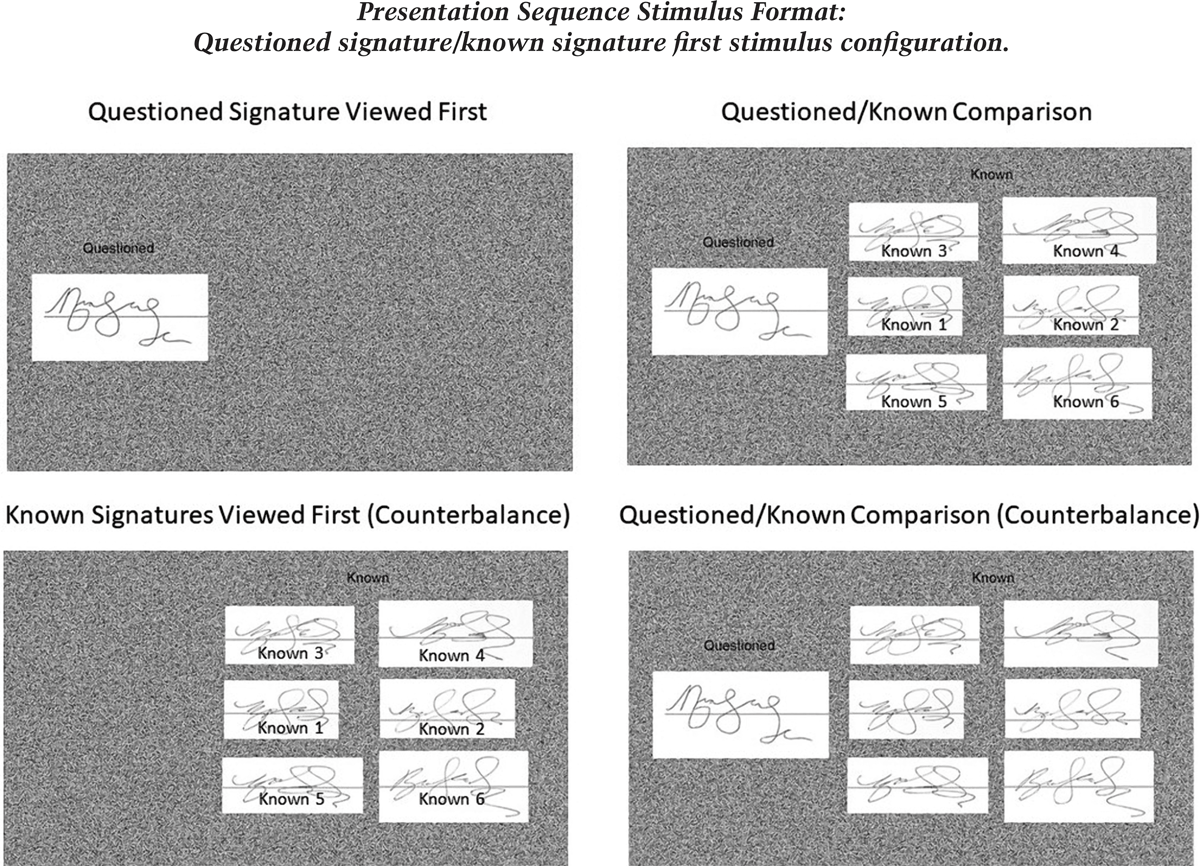
Figure 2
An example of two counterbalanced Protocol 2 stimuli as they were displayed on the eye-tracking system. These stimuli differ in the order of presentation of the questioned and known signatures. In the top example the questioned signature was presented alone, followed by the questioned signature paired with the known signatures. In the counterbalanced example at the bottom, the known signatures were presented first, followed by the questioned/known pairing. The order of the known signatures did not vary.
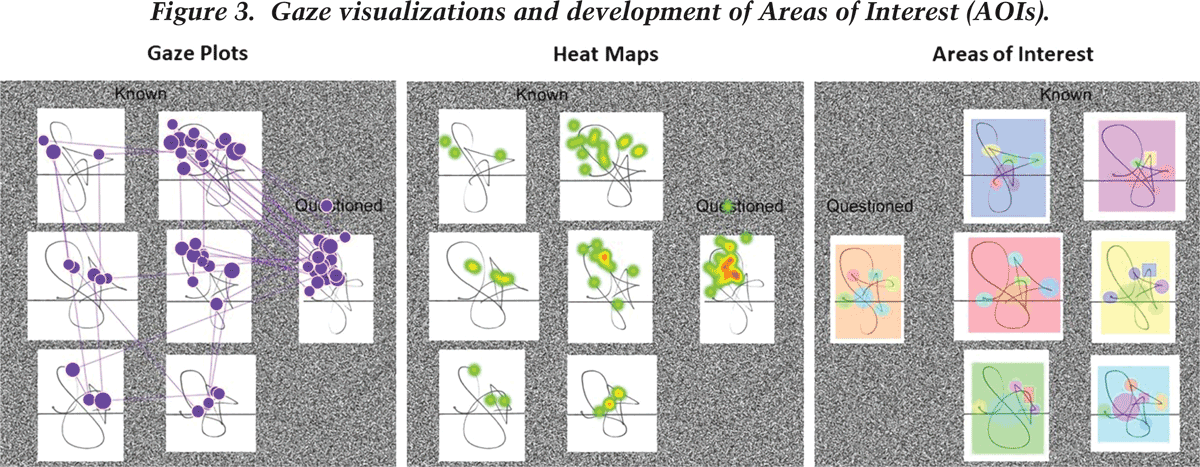
Figure 3
These images demonstrate different ways of visualizing eye-tracking data. The gaze plots at the left provide several kinds of information. Each circle represents a “fixation” where the participant’s gaze fell remained within a 50-pixel area for a time of greater than 100 msec. The size of the circle indicates “fixation duration,” or how much time in total the participant spent in that area. Larger circles indicate that the participant fixated in that area a greater amount time. The lines represent “saccades,” which are recordings of the movement of the eyes as they travel from one fixation to another. Thus, the gaze plot shows what the participant looked at, how long they looked at it, and the order in which the fixations occurred. The heat map displayed in the center image is a visualization of gaze concentration. Red and yellow areas indicate where the participant’s gaze was more concentrated. These areas correspond to the areas in the gaze plot where many fixations were recorded. The image on the right demonstrates how “areas of interest” (AOIs) were developed from the gaze plot and heat map visualizations. AOIs permit analysis of specific areas within an image.
Procedures
Eye-tracking protocols were administered under low light conditions in which window coverings were drawn and overhead lights extinguished. The research area was illuminated by a single lamp placed away from the data collection area and shaded to eliminate any glare on the eye- tracker screen. Figure 4 demonstrates the configuration of the eye-tracking equipment during a typical data collection session.
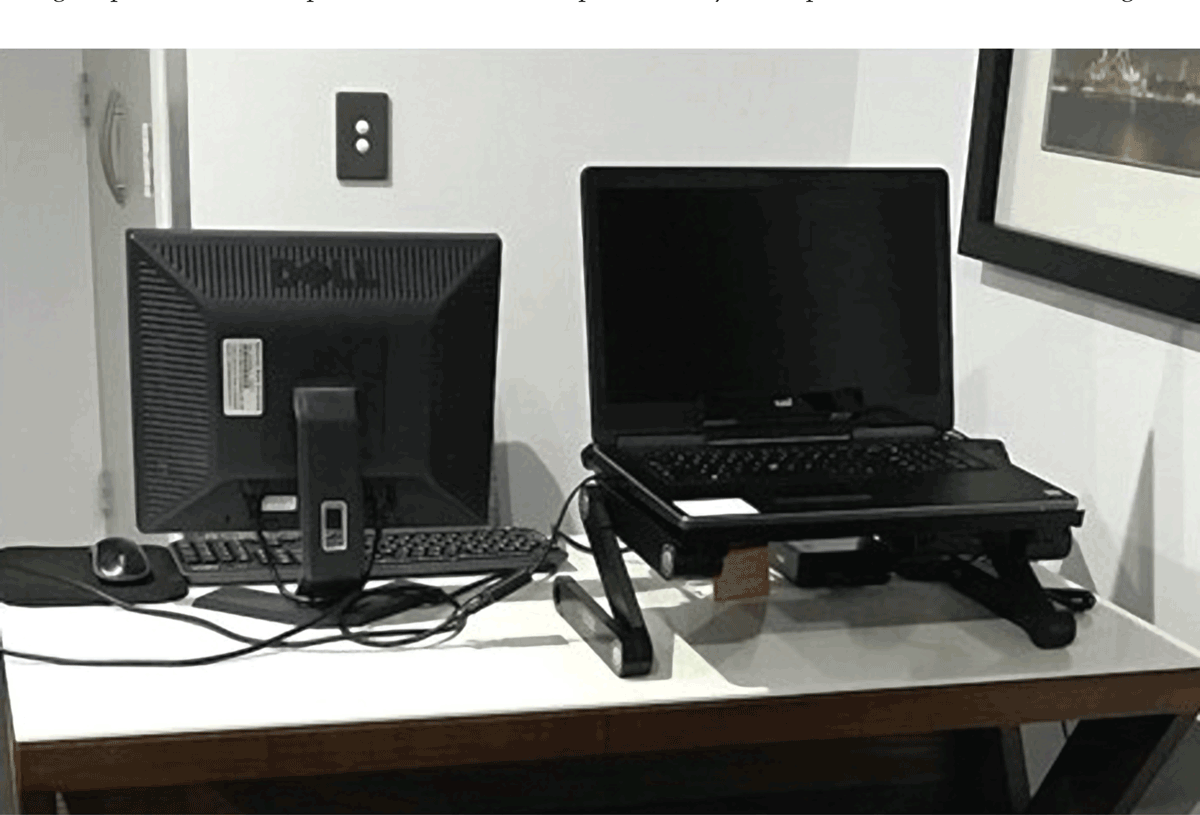
Figure 4
The eye-tracking computer, pictured at the right, rests on an adjustable laptop stand. The experimenter controlled all activities and recorded all verbal responses by keyboard and mouse from the operator station, pictured on the left. This ensured that the participant’s gaze remained on the eye-tracker screen during the gaze recording sessions.
Participants viewed the eye tracker screen from 57 cm away so that the visual angle of the screen was 331 degrees x 271 degrees (W x H). The width of a typical questioned signature subtended a visual angle of approximately 281 degrees. Participants were calibrated to a 9-point reference grid, which provided a resolution of subject gaze to better than 0.5 degree of visual angle. Figure 5 demonstrates the binocular position of the participant’s gaze as detected from the reflection of infrared light from the retina.
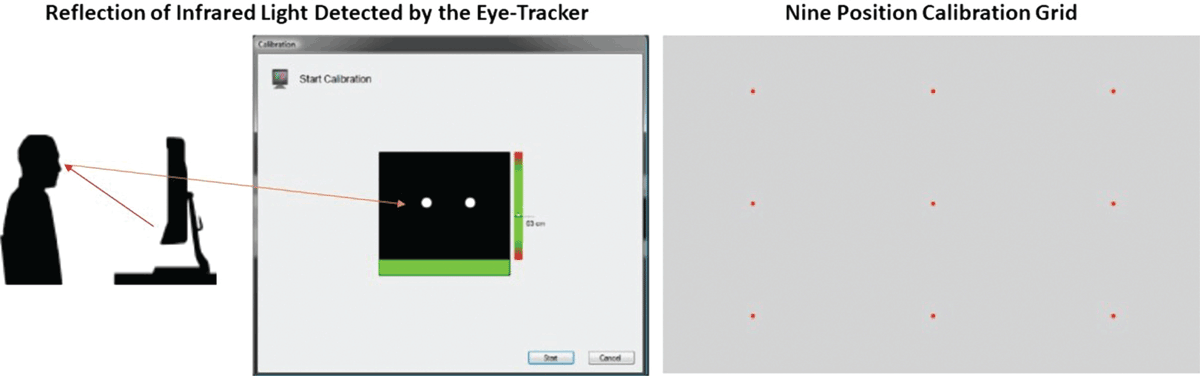
Figure 5
The Tobii X2-60® eye-tracker is located at the bottom of the computer display. The system projects infrared light into the participant’s eyes, illuminating the retina. The eye-tracking software records the position of the illuminated retina for each eye as X/Y coordinates. The raw data for the gaze position coordinates are then processed by the Tobii Pro Studio© software using the ClearView Fixation filter, which designates as a fixation any eye movement slowing below a velocity threshold of 50 pixels/100ms. During calibration, the eye- tracker records the position of the participant’s gaze as the participant visually follows the movement of a red spot as it travels randomly to each of the nine positions on the calibration grid displayed at the right.
Recall that here we are reporting a subset of findings from our larger study. Thus, after calibration, participants completed a total of 20 questioned/known signature comparisons. Participants completed a practice trial demonstrating the format of the signature presentation and the kind of responses required before beginning the experiment.
The comparisons were presented in five sets (trials), consisting of four comparisons per trial. After each comparison, we asked participants to give an opinion about whether the questioned signature was genuine (written by the same person who wrote the known signatures) or simulated (written by different people). We also asked them to indicate their Opinion Strength on the commonly used 9 level scale ranging from Inconclusive to Identification/Elimination. Finally, we asked them to give the certainty of their decision on a 20-point Likert-type scale ranging from 1 (not at all certain) to 20 (extremely certain). The scale levels were unmarked, and Decision Certainty was recorded by mouse click as the experimenter scrolled the mouse over the scale positions until the participant indicated that the cursor had reached their level of certainty. Participants were free to take rest breaks between each of the five trials if they chose.
All 20 comparisons were presented in the Questioned Signature Position format where the position of the questioned signature varied from left to right, as seen in Figure 1 above. Questioned Signature Position stimuli were counterbalanced as described above. Within these 20 comparisons, 10 were presented in the questioned-before-known sequence, and the other 10 comparisons were presented in the known-before-questioned sequence, per the Presentation Sequence format demonstrated in Figure 2 above.
Operationalization of Key Independent and Dependent Variables
Questioned Signature Position: Whether the questioned signature is presented to the left or the right of the known signatures.
Presentation Sequence: Whether the comparison was conducted in the questioned-before-known or the known- before-questioned presentation format.
Ground Truth: The known truth about whether the questioned signature is genuine (written by one person) or simulated (written by more than one person).
Accuracy: Whether the examiner’s opinion matches the ground truth (accurate) or does not (misleading).
Signature Type: Text-based (most allographs are legible) or stylized (few or no allographs are legible).
Signature Complexity: High (many turning points, retraces, and line intersections) or low (few turning points, retraces, and line intersections).
Fixation Count (including zeros): The number of times the participant fixates on an AOI. If the participant has not fixated on the AOI during the data recording, then zero will be recorded and the recording will be included in the calculation of descriptive statistics for that AOI.
Results and Discussion
Overall decision accuracy. These analyses are based on 1,698 independent observations of the 20 signatures described above. Of these observations, 763 (44.9%) were based on genuine signatures, while 935 (55.1%) were based on freehand simulated signatures.
Overall Decision Accuracy for these signature comparisons was 87.9%. We conducted an initial chi-square analysis to determine whether significant differences in FDE Decision Accuracy occurred for genuine versus simulated signatures (Ground Truth). A greater number of accurate calls were made for simulated signatures (865 of 935, or 92.5%) than for genuine signatures (638 of 763, or 83.6%). This difference was statistically significant, x2 (1, N = 1,698) = 41.23, p < .001, indicating that the participants were reliably able to produce accurate decisions, although accuracy was greater for the signatures produced by freehand simulation than for genuine signatures.
We conducted a second chi-square analysis to investigate whether FDE Decision Accuracy varied according to Signature Type. Of the 934 decisions for text-based signatures, 783 (83.8%) were accurate, while of the 764 stylized signature decisions, 710 (92.9%) were accurate. This difference was statistically significant, x2(1, N = 1,698) = 32.78, p < .001. This suggests again that the participants were able to reliably reach accurate decisions for both signature types, although it is possible that some freehand simulations were easier to identify as such due to the skill level of the simulators.
We conducted a third chi-square analysis to determine whether FDE Decision Accuracy varied according to Signature Complexity. Of the 849 decisions on high-complexity signatures, 808 (95.2%) were accurate. Of the 849 decisions on low-complexity signatures, 685 (80.7%) were accurate. This difference was statistically significant, x2 (1, N = 1,698) = 83.93, p < .001. Accuracy rates for both levels of signature complexity were high, but the lower decision accuracy for low complexity signatures highlights the importance of the amount of detail present in the writing samples.
We conducted a fourth chi-square analysis to determine whether FDE Decision Accuracy varied according to Questioned Signature Position. Of the 849 comparisons when the questioned signature appeared at the left, 747 (88.0%) of FDE decisions were accurate. Of the 849 comparisons when the questioned signature appeared at the right, 746 (87.9%) of FDE decisions were accurately called. This difference was not statistically significant (p = .941). This suggests that alternating the visual flow of the examination from the left-to-right (questioned to known) reading pattern typical of U.S., Canadian, and Australian readers to a right-to-left (known to questioned) visual flow does not impact the accuracy of the examination outcome.
We conducted a final chi-square analysis to determine whether FDE Decision Accuracy in these 20 comparisons varied according to whether the questioned or the known signature was presented first (Presentation Sequence). Of the 849 comparisons in which the questioned signature was presented before the questioned/known comparison, 688 (81.0%) of FDE decisions were accurate. Of the 849 comparisons in which the known signatures were presented before the questioned/known comparison, 805 decisions (94.8%) were accurate. This difference was statistically significant, x2 (1, N = 1,698) = 75.94, p < .001. This finding is particularly interesting because it appears contrary to current training and practice standards recommending that examiners study the questioned writing before the known exemplars. Recall, however, that the presentation sequence was counterbalanced such that all signatures were presented in both the known-before-comparison and the questioned-before-comparison format; thus, this difference indicates that the order of presentation did affect Decision Accuracy.
Utilization of known signatures. We conducted independent groups t-tests to compare the mean number of fixations in the each of the six known signatures of the comparisons. We were interested in learning whether there was a difference in FDE utilization of the known signatures related to characteristics of the signatures (Signature Type, Signature Complexity, Ground Truth, Decision Accuracy) or the context of the presentation of the questioned and known signatures (questioned-before-known vs. known- before-questioned presentation, and questioned signature position).
We also performed a series of binomial logistic regression analyses to identify whether differences in mean fixation counts in each of the six known signature areas of interest predicted Signature Type (text-based or stylized), Signature Complexity (high or low), Ground Truth (genuine or freehand simulation), Decision Accuracy (accurate or misleading), Signature Presentation Sequence (questioned-before-known or known-before-questioned), or Questioned Signature Position (questioned at the left or questioned at the right).
Ground Truth and Decision Accuracy analyses. Section A of Table 1 presents the results for the six independent groups t-tests comparing the mean number of fixations on each known signature, to investigate whether the average number of fixations was different for genuine and simulated signatures.
Table 1
Known Signature Fixation Count by Ground Truth and Decision Accuracy.
| Known Signature Fixation Count and Ground Truth | |||||||||
|---|---|---|---|---|---|---|---|---|---|
| 95% Confidence Interval | |||||||||
| Ground Truth | N | M | SD | t | df | p | Lower CI | Upper CI | |
| FC Known 1 | Genuine | 763 | 17.68 | 25.58 | 9.36 | 962 | < .001 | 7.28 | 11.15 |
| Simulated | 935 | 8.47 | 10.28 | ||||||
| FC Known 2 | Genuine | 763 | 16.12 | 20.43 | 9.37 | 1032 | < .001 | 5.95 | 9.10 |
| Simulated | 935 | 8.59 | 9.57 | ||||||
| FC Known 3 | Genuine | 763 | 18.84 | 23.18 | 9.71 | 1145 | < .001 | 7.29 | 10.99 |
| Simulated | 935 | 9.70 | 13.06 | ||||||
| FC Known 4 | Genuine | 763 | 15.75 | 19.03 | 10.84 | 1026 | < .001 | 6.63 | 9.56 |
| Simulated | 935 | 7.66 | 8.81 | ||||||
| FC Known 5 | Genuine | 763 | 12.14 | 17.60 | 9.00 | 1059 | < .001 | 4.91 | 7.65 |
| Simulated | 935 | 5.86 | 8.66 | ||||||
| FC Known 6 | Genuine | 763 | 11.06 | 14.14 | 9.60 | 1118 | < .001 | 4.35 | 6.59 |
| Simulated | 935 | 5.59 | 7.66 | ||||||
| Known Signature Fixation Count and Decision Accuracy | |||||||||
| 95% Confidence Interval | |||||||||
| Decision Accuracy | N | M | SD | t | df | p | Lower CI | Upper CI | |
| FC Known 1 | Accurate | 1493 | 11.92 | 17.31 | -2.69 | 223 | .008 | -9.90 | –1.53 |
| Misleading | 205 | 17.63 | 29.72 | ||||||
| FC Known 2 | Accurate | 1493 | 11.39 | 14.79 | -3.07 | 230 | .002 | -7.91 | -1.73 |
| Misleading | 205 | 16.21 | 21.80 | ||||||
| FC Known 3 | Accurate | 1493 | 13.28 | 18.29 | -2.67 | 243 | .008 | -7.55 | -1.14 |
| Misleading | 205 | 17.63 | 22.31 | ||||||
| FC Known 4 | Accurate | 1493 | 10.77 | 14.19 | -3.19 | 237 | .002 | - 7.04 | -1.67 |
| Misleading | 205 | 15.12 | 18.81 | ||||||
| FC Known 5 | Accurate | 1493 | 8.22 | 12.51 | -2.57 | 225 | .011 | -6.70 | -0.89 |
| Misleading | 205 | 12.02 | 20.61 | ||||||
| FC Known 6 | Accurate | 1493 | 7.78 | 10.92 | -2.15 | 238 | .032 | -4.24 | -0.19 |
| Misleading | 205 | 9.99 | 14.17 | ||||||
The p values indicate that the mean fixation count for all known signatures was statistically significantly different depending on whether the questioned signature was genuine or simulated (Ground Truth). Section B of the table demonstrates that the mean fixation count for all known signatures was statistically significantly different depending on whether the FDE’s decision was accurate or misleading (Decision Accuracy). Fixation counts in the known signatures were higher when signatures were genuine, as well as when participants’ decisions were misleading. This suggests that participants may have referenced the knowns to a greater extent when the questioned and known signatures were more similar, possibly leading to over-interpretation of the writing features and misleading opinions.
Figure 6 presents the distribution of the mean fixation counts by known signature.
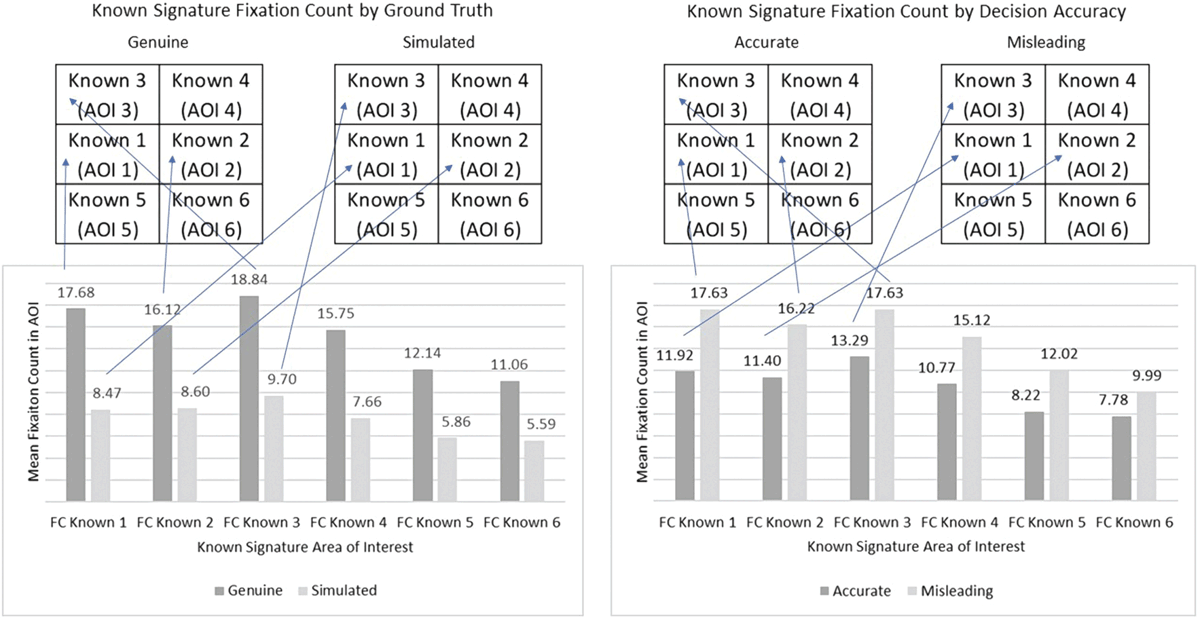
Figure 6
Mean fixation counts for the Ground Truth analyses are presented at the left. Mean fixation counts for Decision Accuracy analyses are presented at the right. Fixation counts in the Ground Truth analyses were significantly greater for genuine than for simulated signatures. Fixation counts were significantly greater for misleading opinions than for accurate decisions. The three highest mean fixation counts for genuine and simulated signatures are indicated by the arrows. This demonstrates that FDEs utilized known signatures 1, 2, and 3 to a greater extent overall than they did known signatures 4, 5, and 6. The same pattern is revealed in the known signature fixation counts in the Decision Accuracy analyses.
Significant predictors of Ground Truth and Decision Accuracy. We combined the variables Known Signature 1, Known Signature 2, Known Signature 3, Known Signature 4, Known Signature 5, and Known Signature 6 in a binomial logistic regression model to test how accurate the six factors together were in predicting whether the Ground Truth was genuine or simulated (the outcome variable). All logistic regression analyses were conducted using the enter method. Table 2 presents the regression coefficients for these analyses. This allowed us to investigate which of the known signatures in the comparisons may have been more influential.
Table 2
Regression Coefficients for Predictors of Ground Truth and Decision Accuracy.
| Ground Truth | |||||||
|---|---|---|---|---|---|---|---|
| 95% Confidence Interval | |||||||
| Areas of Interest All Knowns | B | Wald | df | p | Odds | Lower CI | Upper CI |
| FC Known 1 (center left) | -0.02 | 5.25 | 1 | .022 | 0.98 | 0.97 | 1.00 |
| FC Known 2 (center right) | 0.00 | 0.03 | 1 | .864 | 1.00 | 0.98 | 1.01 |
| FC Known 3 (top left) | 0.00 | 0.20 | 1 | .655 | 1.00 | 0.99 | 1.01 |
| FC Known 4 (top right) | -0.03 | 17.76 | 1 | <.001 | 0.97 | 0.95 | 0.98 |
| FC Known 5 (bottom left) | 0.00 | 0.13 | 1 | .723 | 1.00 | 0.99 | 1.02 |
| FC Known 6 (bottom right) | -0.01 | 0.67 | 1 | 0.413 | 0.99 | 0.97 | 1.01 |
| Decision Accuracy | |||||||
| 95% Confidence Interval | |||||||
| Areas of Interest All Knowns | B | Wald | df | p | Odds | Lower CI | Upper CI |
| FC Known 1 (center left) | 0.00 | 0.35 | 1 | .553 | 1.00 | 0.99 | 1.02 |
| FC Known 2 (center right) | 0.01 | 2.28 | 1 | .131 | 1.01 | 1.00 | 1.03 |
| FC Known 3 (top left) | -0.01 | 0.64 | 1 | .423 | 0.99 | 0.98 | 1.01 |
| FC Known 4 (top right) | 0.01 | 1.35 | 1 | .245 | 1.01 | 0.99 | 1.03 |
| FC Known 5 (bottom left) | 0.01 | 1.31 | 1 | .252 | 1.01 | 0.99 | 1.03 |
| FC Known 6 (bottom right) | -0.02 | 3.15 | 1 | .076 | 0.98 | 0.95 | 1.00 |
The overall regression model was statistically significant (x2 (6) = 18.66, p = .005). Although statistically significant, the variables in the model did not improve the amount of variability explained (Nagelkerke r2 = 2.1%). Results indicated that the overall model fit was poor (–2 Log Likelihood = 1232.35). The model was statistically reliable in classifying 63.4% of the observations. Wald statistics indicated that when the variables were combined, only Known Signatures, which received the highest number of fixations, and Known Signature 6, which received the lowest number of fixations, predicted the category of Ground Truth. Although the means for the number of fixations in each of the six signatures were significantly higher when the questioned signatures were genuine, those in Known Signature 1 and Known Signature 6 were high enough to suggest that participants were utilizing all available information to a greater extent when the signatures were genuine than when the questioned signatures were simulated.
We combined the same variables in a binomial logistic regression model to test how accurately the six factors together were in predicting whether the decision was accurate or misleading (the outcome variable).
The overall model was statistically significant (x2 (6) = 18.66, p = .005). Although statistically significant, the variables in the model did not improve the amount of variability explained (Nagelkerke r2 = 2.1%). Results indicated that the overall model fit was poor (-2 Log Likelihood = 1232.35), although the model was statistically reliable in classifying 87.8% of the observations. Wald statistics indicated that when the variables were combined, none predicted the category of Decision Accuracy. The number of fixations in each of the six signatures was significantly higher when the decision was misleading, but none of the known signatures appeared to have had more influential characteristics than the others.
Utilization of known signatures in Signature Type and Signature Complexity analyses. We conducted independent groups t-tests to compare the mean number of fixations in the each of the six known signatures of the comparisons. Here we were interested in learning whether there was a difference in FDE utilization of the known signatures related to Signature Type (text-based or stylized) or Signature Complexity (high or low). We also performed a series of binomial logistic regression analyses to identify whether differences in mean fixation counts in each of the six known signature areas of interest predicted Signature Type or Signature Complexity.
Section A of Table 3 presents the results for the six independent groups t-tests comparing the mean number of fixations on each known signature for text-based and stylized signatures.
Table 3
Known Signature Fixation Count by Signature Type and Signature Complexity.
| Known Signature Fixation Count by Signature Type | ||||||||
|---|---|---|---|---|---|---|---|---|
| 95% Confidence Interval | ||||||||
| Area of Interest | Type | N | SD | t | df | p | Lower CI | Upper CI |
| FC Known 1 | Text | 934 | 22.09 | 4.08 | 1643 | < .001 | 1.91 | 5.46 |
| Stylized | 764 | 15.01 | ||||||
| FC Known 2 | Text | 934 | 17.81 | 4.22 | 1672 | < .001 | 1.68 | 4.61 |
| Stylized | 764 | 12.90 | ||||||
| FC Known 3 | Text | 934 | 21.03 | 3.68 | 1682 | < .001 | 1.53 | 5.03 |
| Stylized | 764 | 15.65 | ||||||
| FC Known 4 | Text | 934 | 17.07 | 5.21 | 1632 | < .001 | 2.25 | 4.97 |
| Stylized | 764 | 11.37 | ||||||
| FC Known 5 | Text | 934 | 16.40 | 5.01 | 1532 | < .001 | 1.94 | 4.43 |
| Stylized | 764 | 9.41 | ||||||
| FC Known 6 | Text | 934 | 12.90 | 4.93 | 1655 | < .001 | 1.58 | 3.67 |
| Stylized | 764 | 8.97 | ||||||
| Known Signature Fixation Count by Signature Complexity | ||||||||
| 95% Confidence Interval | ||||||||
| Area of Interest | Complexity | N | SD | t | df | p | Lower CI | Upper CI |
| FC Known 1 | High | 849 | 18.62 | –1.54 | 1688 | .123 | -3.28 | 0.39 |
| Low | 849 | 19.96 | ||||||
| FC Known 2 | High | 849 | 16.37 | -0.83 | 1696 | .409 | -2.15 | 0.88 |
| Low | 849 | 15.35 | ||||||
| FC Known 3 | High | 849 | 20.14 | -1.08 | 1696 | .282 | -2.78 | 0.81 |
| Low | 849 | 17.49 | ||||||
| FC Known 4 | High | 849 | 16.22 | -0.30 | 1639 | .766 | -1.63 | 1.20 |
| Low | 849 | 13.43 | ||||||
| FC Known 5 | High | 849 | 14.67 | -0.20 | 1667 | .841 | - 1.45 | 1.18 |
| Low | 849 | 12.86 | ||||||
| FC Known 6 | High | 849 | 12.32 | -0.09 | 1647 | .929 | -1.13 | 1.03 |
| Low | 849 | 10.35 | ||||||
The p values indicate that the mean fixation counts for all known signature were statistically significantly different depending on whether the signatures were text-based or stylized (Signature Type). Higher means among the text-based signatures suggest that participants may have fixated on a greater number of legible allographic features than were available in the stylized signatures. Section B of the table demonstrates that there were no significant differences in fixation counts among the known signatures according to signature complexity (Signature Complexity).
We conducted a 2 (Signature Type) x 2 (Signature Complexity) factorial analysis of variance (ANOVA) to further investigate whether these combined factors provided additional information about these relationships. We found that fixation counts were indeed higher for both high and low complexity text-based signatures (p < .001). We also found that fixation counts were lowest among high complexity, stylized signatures (p < .001). This supports the idea that the number of legible allographs is related to the number of fixations. It also suggests that pictorial differences among high complexity stylized signatures may have been relatively more salient to the participants, requiring less attention to accurately discern. Figure 7 presents the distribution of the mean fixation counts by known signature.
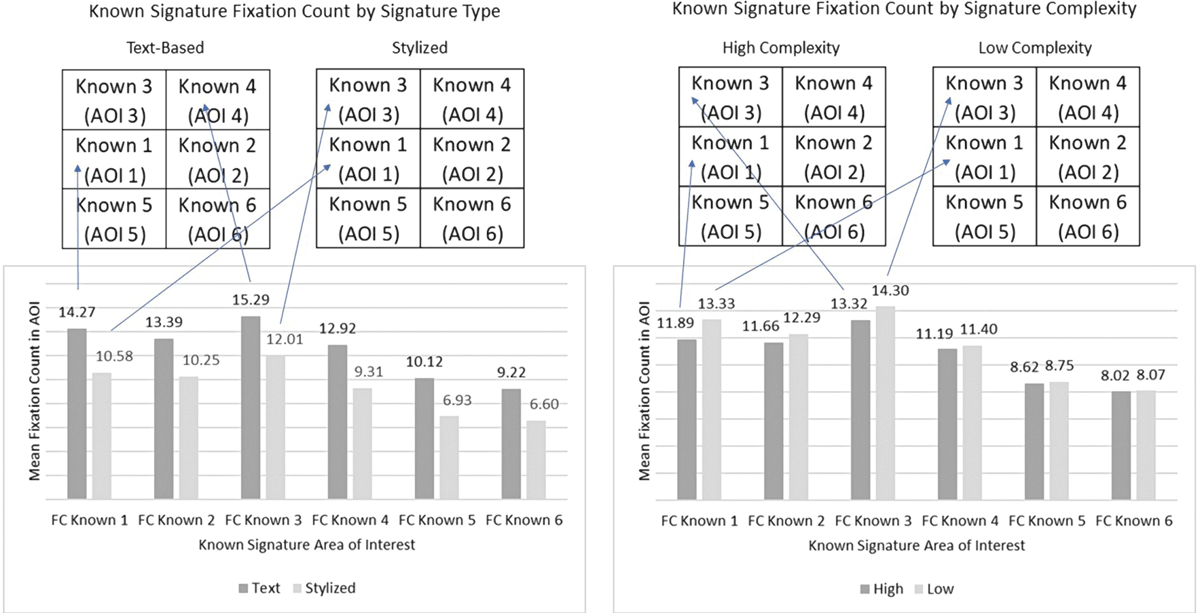
Figure 7
Mean fixation counts for the Signature Type analyses are presented at the left. Mean fixation counts for Signature Complexity analyses are presented at the right. Fixation counts in the Signature Type analyses were significantly greater for text-based than for stylized signatures. Fixation counts were not significantly greater for low complexity than for high complexity signatures. The two highest mean fixation counts for text- based and for stylized signatures are indicated by the arrows. This demonstrates that FDEs utilized known signatures 1 and 3 to a greater extent than the other knowns in both the text-based and the stylized signatures. Similarly, at the right, the two highest mean fixation counts for high and low complexity signatures, known signatures 1 and 3, are indicated by the arrows, although these differences were not statistically significant.
Significant predictors of Signature Type and Signature Complexity. We combined the fixation count variables (Known Signatures 1-6) in a binomial logistic regression model to test how accurate the six factors together were in predicting whether the Signature Type was text-based or stylized (the outcome variable). Table 4 presents the regression coefficients for these analyses.
Table 4
Regression Coefficients for Predictors of Signature Type and Signature Complexity.
| Signature Type | 95% Confidence Interval | ||||||
|---|---|---|---|---|---|---|---|
| Areas of Interest All Knowns | B | Wald | df | P | Odds | Lower CI | Upper CI |
| FC Known 1 (center left) | 0.00 | 0.02 | 1 | .893 | 1.00 | 0.99 | 1.01 |
| FC Known 2 (center right) | 0.01 | 0.84 | 1 | .360 | 1.01 | 0.99 | 1.02 |
| FC Known 3 (top left) | 0.01 | 1.48 | 1 | .225 | 1.01 | 1.00 | 1.02 |
| FC Known 4 (top right) | -0.02 | 6.35 | 1 | .012 | 0.98 | 0.97 | 1.00 |
| FC Known 5 (bottom left) | -0.01 | 2.66 | 1 | .103 | 0.99 | 0.97 | 1.00 |
| FC Known 6 (bottom right) | -0.01 | 0.81 | 1 | .368 | 0.99 | 0.97 | 1.01 |
| Signature Complexity | 95% Confidence Interval | ||||||
| Areas of Interest All Knowns | B | Wald | df | P | Odds | Lower CI | Upper CI |
| FC Known 1 (center left) | 0.01 | 3.78 | 1 | .052 | 1.01 | 1.00 | 1.02 |
| FC Known 2 (center right) | 0.01 | 0.65 | 1 | .419 | 1.01 | 0.99 | 1.02 |
| FC Known 3 (top left) | 0.00 | 0.24 | 1 | .624 | 1.00 | 0.99 | 1.01 |
| FC Known 4 (top right) | -0.01 | 0.96 | 1 | .328 | 0.99 | 0.98 | 1.01 |
| FC Known 5 (bottom left) | -0.01 | 1.97 | 1 | .161 | 0.99 | 0.97 | 1.00 |
| FC Known 6 (bottom right) | -0.01 | 0.44 | 1 | .509 | 0.99 | 0.98 | 1.01 |
The overall model was statistically significant (x2 (6) = 34.33, p < .001), indicating that the variables improved the amount of variability explained (Nagelkerke r2 = 2.7%). Results indicated that the overall model fit was poor (-2 Log Likelihood = 2302.55). The model correctly classified 53.1% of cases. Wald statistics indicated that when the variables were combined, the only predictor variable to reach significance was Known Signature 4. The odds ratio for Known Signature 4 was small, indicating low impact on the outcome.
We combined the same variables in a binomial logistic regression model to test how accurately the six factors together predicted Signature Complexity (the outcome variable). The overall model was not statistically significant (x2 (6) = 8.02, p = .237), indicating that the variables did not improve the amount of variability explained (Nagelkerke r2 = 0.06%). The model correctly classified only 51.61% of cases. Wald statistics indicated that when the variables were combined, none predicted whether the signatures were high or low complexity.
Utilization of known signatures in Signature Presentation Sequence and Questioned Signature Position analyses. We conducted independent groups t-tests to compare the mean number of fixations in the each of the six known signatures of the comparisons. Here we were interested in learning whether there was a difference in FDE utilization of the known signatures related to Signature Presentation Sequence (questioned- before-known or known-before-questioned) or Questioned Signature Position (questioned at the left or questioned at the right). We also performed binomial logistic regression analyses to identify whether differences in mean fixation counts in each of the six known signature areas of interest predicted Signature Presentation Sequence or Questioned Signature Position. Section A of Table 5 presents the results for the six independent groups t-tests comparing the mean number of fixations on each known signature for questioned-before-known or known-before-questioned sequences.
Table 5
Known Signature Fixation Count by Signature Presentation Sequence and Questioned Signature Position.
| Known Signature Fixation Count and Signature Presentation Sequence | |||||||||
|---|---|---|---|---|---|---|---|---|---|
| 95% Confidence Interval | |||||||||
| Sequence | N | M | SD | t | df | P | Lower CI | Upper CI | |
| FC Known 1 | Questioned First | 849 | 16.22 | 22.84 | 7.83 | 1412 | < .001 | 5.41 | 9.02 |
| Known First | 849 | 9.00 | 14.09 | ||||||
| FC Known 2 | Questioned First | 849 | 14.82 | 17.98 | 7.52 | 1533 | < .001 | 4.21 | 7.18 |
| Known First | 849 | 9.13 | 12.82 | ||||||
| FC Known 3 | Questioned First | 849 | 17.29 | 21.40 | 7.74 | 1528 | < .001 | 5.21 | 8.74 |
| Known First | 849 | 10.32 | 15.16 | ||||||
| FC Known 4 | Questioned First | 849 | 14.55 | 17.67 | 9.24 | 1380 | < .001 | 5.13 | 7.90 |
| Known First | 849 | 8.04 | 10.49 | ||||||
| FC Known 5 | Questioned First | 849 | 11.39 | 16.82 | 8.25 | 1306 | < .001 | 4.13 | 6.71 |
| Known First | 849 | 5.97 | 9.11 | ||||||
| FC Known 6 | Questioned First | 849 | 10.33 | 13.35 | 8.43 | 1427 | < .001 | 3.50 | 5.62 |
| Known First | 849 | 5.76 | 8.39 | ||||||
| Known Signature Fixation Count and Questioned Signature Position | |||||||||
| 95% Confidence Interval | |||||||||
| Q Position | N | M | SD | t | df | p | Lower CI | Upper CI | |
| FC Known 1 | Q Right | 849 | 9.48 | 15.92 | -6.76 | 1554 | < .001 | -8.07 | -4.44 |
| Q Left | 849 | 15.74 | 21.76 | ||||||
| FC Known 2 | Q Right | 849 | 14.44 | 16.51 | 6.49 | 1676 | < .001 | 3.44 | 6.43 |
| Q Left | 849 | 9.51 | 14.80 | ||||||
| FC Known 3 | Q Right | 849 | 10.98 | 16.45 | -6.24 | 1616 | < .001 | -7.43 | -3.88 |
| Q Left | 849 | 16.64 | 20.63 | ||||||
| FC Known 4 | Q Right | 849 | 12.41 | 15.82 | 3.09 | 1665 | 0.002 | 0.81 | 3.64 |
| Q Left | 849 | 10.18 | 13.81 | ||||||
| FC Known 5 | Q Right | 849 | 7.19 | 11.52 | -4.47 | 1560 | < .001 | -4.28 | -1.67 |
| Q Left | 849 | 10.17 | 15.61 | ||||||
| FC Known 6 | Q Right | 849 | 8.26 | 11.46 | 0.79 | 1696 | 0.428 | -0.65 | 1.52 |
| Q Left | 849 | 7.82 | 11.30 | ||||||
The p values indicated that the mean fixation count for every known signature was statistically significantly different depending on whether the presentation sequence was questioned-before- known or known-before-questioned (Presentation Sequence).
We followed this analysis with a paired groups t-test to investigate whether the total number of fixations on the known signatures was related to the lower number of known signature fixations on the comparison stimulus (known-before-questioned sequence). We found that the mean total fixation count for the knowns (11.89) was significantly lower than that for the questioned/known comparisons (51.74), t (843) = -19.29, p < .001, (95% CI = -43.91, -35.80). A bivariate Pearson’s Product Moment correlation showed that the total fixation count for the known signatures that were viewed alone was significantly positively correlated to the number of fixations on the comparison stimulus (r2 = .212, p < .001). This indicates that if the number of fixations on the knowns alone was high, the number of fixations on the questioned/known comparison was also high, suggesting that differences were related to the participants’ individual examination habits.
We did a similar analysis to investigate whether this pattern was also present when the questioned signature was presented first, followed by the questioned/known comparison stimulus. The mean fixation counts for the questioned signature alone and the questioned signature on the comparison stimulus were not statistically significantly different (p = .175). Here, too, we found a significant positive correlation between the total number of fixations on both stimuli in this comparison (r2 = .228, p < .001), suggesting a pattern of individual examination habits similar to that in the known-before-questioned sequence.
Section B of the table demonstrates that all mean fixation counts except known signature 6 were significantly different depending on whether the questioned signature was presented at the left or the right of the known signatures (Questioned Signature Position). Figure 8 presents the distribution of the mean fixation counts by known signature.
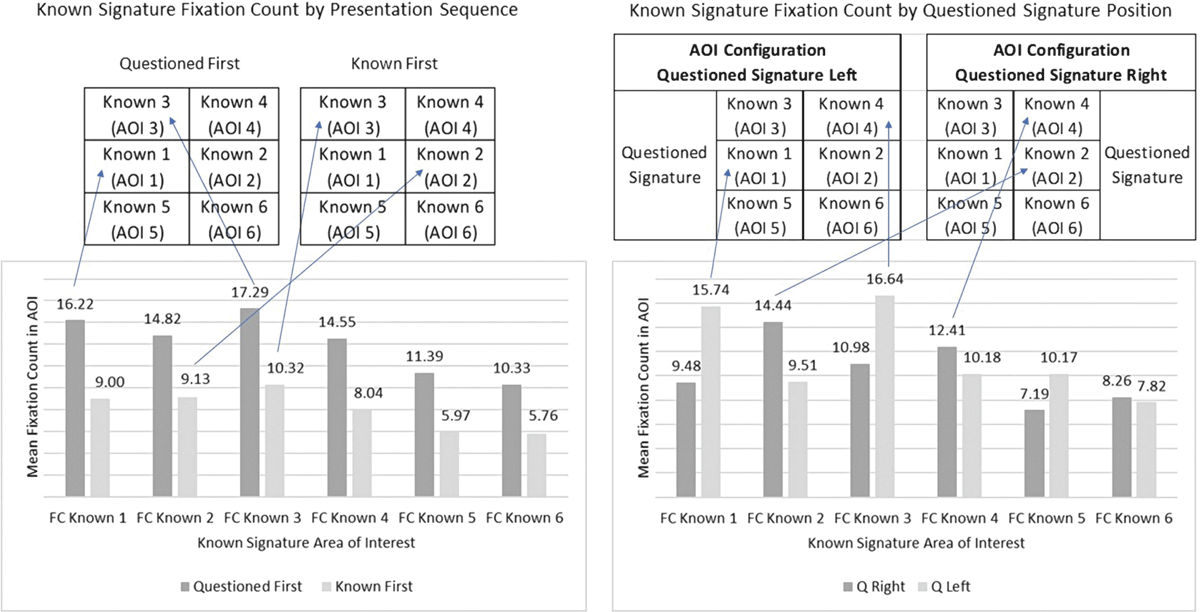
Figure 8
Mean fixation counts for the Signature Presentation Sequence analyses are presented at the left. Mean fixation counts for Questioned Signature Position analyses are presented at the right. Fixation counts in the Signature Presentation Sequence analyses were significantly greater for questioned-before known than for the known-before-questioned sequence. Fixation counts were significantly greater when the questioned signature was presented on the left than when the questioned signature was on the right. The three highest mean fixation counts for each condition are indicated by the arrows. This demonstrates that participants utilized known signatures 1, 2, and 3 to a greater extent overall than they did known signatures 4, 5, and 6 in the Presentation Sequence protocol. A slightly different pattern is demonstrated in the Questioned Signature Position protocol, where the participants fixated more on signatures 3, 1, and 4 when questioned signatures were presented on the left, and signatures 2, 4, and 3 when the questioned signature was on the right.
Significant predictors of Presentation Sequence and Questioned Signature Position. The results of these analyses are presented in Table 6. We combined the variables Known Signature 1, Known Signature 2, Known Signature 3, Known Signature 4, Known Signature 5, and Known Signature 6 in a binomial logistic regression model to test how accurately the six factors together predicted whether the presentation sequence was questioned-before-known or known-before-questioned (the outcome variable). The overall model was statistically significant (x2 (6) = 111.42, p < .001). The variables in the model improved the amount of variability explained (Nagelkerke r2 = 8.5%). Results indicated that the overall model fit was poor (-2 Log Likelihood 2242.51). The model correctly classified 59.4% of cases. Wald statistics indicated that the only significant fixation count predictor of Questioned/Known Presentation Sequence was Known Signature 4, but the odds ratio was small, indicating low impact on the outcome.
Table 6
Regression Coefficients for Predictors of Presentation Sequence and Questioned Signature Position.
| Presentation Sequence | 95% Confidence Interval | ||||||
|---|---|---|---|---|---|---|---|
| Areas of Interest All Knowns | B | Wald | df | P | Odds | Lower CI | Upper CI |
| FC Known 1 (center left) | -0.01 | 1.18 | 1 | 0.278 | 0.99 | 0.98 | 1.01 |
| FC Known 2 (center right) | 0.01 | 1.79 | 1 | 0.181 | 1.01 | 1.00 | 1.03 |
| FC Known 3 (top left) | 0 | 0.26 | 1 | 0.608 | 0.99 | 0.99 | 1.01 |
| FC Known 4 (top right) | -0.03 | 16.44 | 1 | < .001 | 0.97 | 0.95 | 0.98 |
| FC Known 5 (bottom left) | -0.01 | 1.45 | 1 | 0.228 | 0.99 | 0.97 | 1.01 |
| FC Known 6 (bottom right) | -0.01 | 1.63 | 1 | 0.201 | 0.99 | 0.97 | 1.01 |
| Questioned Signature Position | 95% Confidence Interval | ||||||
| Areas of Interest All Knowns | B | Wald | df | p | Odds | Lower CI | Upper CI |
| FC Known 1 (center left) | 0.12 | 98.22 | 1 | < .001 | 1.12 | 1.10 | 1.15 |
| FC Known 2 (center right) | -0.17 | 173.14 | 1 | < .001 | 0.84 | 0.82 | 0.86 |
| FC Known 3 (top left) | 0.06 | 48.84 | 1 | < .001 | 1.07 | 1.05 | 1.09 |
| FC Known 4 (top right) | -0.06 | 31.19 | 1 | < .001 | 0.94 | 0.92 | 0.96 |
| FC Known 5 (bottom left) | 0.02 | 2.97 | 1 | 0.085 | 1.02 | 1.00 | 1.05 |
| FC Known 6 (bottom right) | 0.02 | 2.77 | 1 | 0.096 | 1.02 | 1.00 | 1.05 |
We performed a second binary logistic regression to investigate whether the observed differences in fixation count among the known signatures were related to whether the questioned signature was located on the left or on the right (the outcome variable). The overall model was statistically significant (x2 (6) 615.13, p < .001). The variables in the model improved the amount of variability explained (Nagelkerke r2 40.5%). Results indicated that the overall model fit was poor (-2 Log Likelihood 1739.79). The model was statistically reliable, correctly classifying 79.3% of cases. Wald statistics indicated that four of the six variables in the model (Known Signature 1, Known Signature 2, Known Signature 3, and Known Signature 4) were significant predictors of questioned signature location, but the odds ratios for all were small, indicating low impact on the outcome.
Predictors of Decision Accuracy: Combined Signature Characteristic and Fixation Count Analyses. Finally, we combined all the predictor variables (Signature Type, Signature Complexity, Presentation Sequence, Questioned Signature Position, and all Known Signature fixation count variables) in a binomial logistic regression model to investigate which factors together predicted whether the participant decisions were accurate or misleading (the outcome variable). The results of this analysis are presented in Table 7.
Table 7
Regression Coefficients for Decision Accuracy Predictors.
| 95% Confidence Interval | |||||||
|---|---|---|---|---|---|---|---|
| Predictor Variables | B | Wald | df | p | Odds | Lower CI | Upper CI |
| FC Known 1 | -0.01 | 0.38 | 1 | .537 | 0.99 | 0.98 | 1.01 |
| FC Known 2 | 0.02 | 3.67 | 1 | .055 | 1.02 | 1.00 | 1.04 |
| FC Known 3 | -0.01 | 0.42 | 1 | .515 | 0.99 | 0.98 | 1.01 |
| FC Known 4 | 0.01 | 0.65 | 1 | .422 | 1.01 | 0.99 | 1.03 |
| FC Known 5 | 0.02 | 2.45 | 1 | .118 | 1.02 | 1.00 | 1.04 |
| FC Known 6 | - 0.03 | 4.01 | 1 | .045 | 0.97 | 0.94 | 1.00 |
| Signature Type | 1.30 | 25.76 | 1 | <.001 | 3.65 | 2.21 | 6.02 |
| Signature Complexity | -2.32 | 126.30 | 1 | <.001 | 0.10 | 0.07 | 0.15 |
| Presentation Sequence | 1.00 | 15.38 | 1 | <.001 | 2.73 | 1.65 | 4.50 |
| Questioned Signature Position | -0.12 | 0.38 | 1 | .536 | 0.89 | 0.61 | 1.29 |
The overall model was statistically significant (x2 (10) = 255.79, p < .001), indicating that the variables improved the amount of variability explained (Nagelkerke r2 = 26.8%). Results indicated that the overall model fit was poor (–2 Log Likelihood = 995.22). The model correctly classified 87.8% of cases. Wald statistics indicated that when the variables were combined, only Known Signature 6 significantly predicted Decision Accuracy. Among the remaining variables, Signature Type, Signature Complexity, and Presentation Sequence were also significant predictors of the outcome. The large odds ratios for Signature Type (3.65) and Presentation Sequence (2.73) indicated substantial change in the likelihood of Decision Accuracy. Odds ratios near 1.00 indicated that Signature Complexity and the number of fixations in Known Signature 6 had little impact on the outcome, even though both reached statistical significance in the model.
In Summary
Ground truth. Our participants were reliably able to produce accurate decisions, although accuracy was greater for freehand simulation signatures than for genuine signatures. Genuine signatures attracted a greater number of fixations among the known signatures, and fixations were greater among the knowns when the decisions were misleading than when they were accurate. Participants may have referenced the knowns to a greater extent when the questioned and known signatures were more similar, leading them to over-interpret the writing features and contributing to the number of misleading opinions.
Decision accuracy. When the Known Signature fixation count variables were combined, none predicted Decision Accuracy. Although the means for the number of fixations in each of the six signatures were significantly higher when the decision was misleading, none of the characteristics of the known signatures appear to have been more influential than the others.
The mean number of fixations in each of the six known signatures was significantly higher when the questioned signatures were genuine. Fixation counts in Known Signatures 1 and 6 were high enough to suggest that participants were utilizing all available information in the known signatures to a greater extent when the questioned signatures were genuine than when they were simulated.
Signature type. Participants reliably reached accurate decisions for both signature types, although it is possible that some freehand simulations were easier to identify as such due to the skill level of the simulators. Higher mean fixation counts among the text-based signatures suggested that participants may have accessed a greater number of legible allographic features than there were available in the stylized signatures.
Signature complexity. Accuracy rates for high and low signature complexity were high, but the lower decision accuracy for low complexity signatures highlighted the importance of the amount of detail present in the writing samples. Fixation counts were lowest among high complexity simulated signatures. In this case, pictorial differences among high complexity stylized signatures may have been relatively more salient to the participants, requiring less attention to accurately discern.
Questioned signature position. Alternating the visual flow of the examination from the left- to-right (questioned-to-known) reading pattern typical of U.S., Canadian, and Australian readers, to a right-to-left (known-to-questioned) visual flow did not impact the accuracy of the examination outcome.
Presentation sequence. Current training and practice standards recommend that examiners should study the questioned writings prior to examining the known exemplars. Here we found that the questioned-before-known presentation sequence attracted a higher number of misleading decisions than did the known-before-questioned sequence. We can reasonably conclude in this case that the order of presentation did affect Decision Accuracy because of the counterbalanced experimental protocols. Presentation sequence was counterbalanced such that all 20 signature comparisons were presented in both the known- before-comparison and the questioned-before- comparison format.
The known-before-questioned presentation is contrary not only to current document examination practice recommendations, but also to the recommendations of several highly respected statisticians, who cite statistical models that predict a greater likelihood for cognitive bias if the known signatures are viewed first. Although our results are informative, no single study should be considered dispositive. Training and practice in any field should be informed by a body of methodologically sound research, leading to reliable and evidence-based best practices.
Study Limitations and Future Research Directions
Good experimental research is conducted in a carefully controlled environment, under standardized conditions that allow the researchers to isolate the effects of the factors that they are studying. The experimental environment necessary to ensure the quality of the data provided by the X2-60 eye-tracking units did not, and cannot, approximate the laboratory environment in which most handwriting examinations occur. We anticipate that the results of the comparisons performed on the eye-tracking systems would be somewhat different if our participants had access to the tools and techniques available to them in a document examination laboratory.
The experimental nature of this study may also have an impact on the opinion strength expressed by our participants. Although we have data about opinion certainty and confidence for these comparisons, we have chosen not to include them here for space considerations. We will report them more fully in the future.
It is important that readers recognize the difference between experimental protocols and live casework. We must note that forensic document examiner decisions in practice are not forced- choice decisions. As part of our efforts to study various aspects of “sufficiency,” examiners were also asked to make several decisions about writing samples that contained minimal information on which to base an opinion. In practice, it is unlikely that examiners would form opinions based on such minimal information. Our ground truth study should therefore not be considered a proficiency test of any kind. Future studies should take place in conditions that more closely approximate the working environment of a laboratory.
Conclusion
Avoiding the grave consequences of erroneous conclusions in live casework requires effort, resources, and commitment by all parties in the legal process. Although the experimental nature of this research limits to an extent the generalizability of the results, experimental studies such as this inform the field in many useful and important ways. Research provides the empirical support to assert that proposed practices are the best practices. Research forms the basis for developing empirically validated and rigorous document examination protocols, measures, and education and training programs that consistently and comprehensively address the knowledge and skills required to establish expertise in forensic fields.
Eye-tracking methodology, physiological data, information about how examiners use the evidential features in handwriting examinations, knowledge about the decision making process all help to achieve these goals by increasing the transparency of the examination process, and improving the quality of performance of attorneys, judges, and experts.
Notes
Acknowledgements
Bryan J. Found, Victoria Police Forensic Services Department; Adrian Dyer, Royal Melbourne Institute of Technology; Kentucky State University: La’Quida Smith, Piarre Easley, Robert Olson; University of Nevada, Reno: Mauricio Alvarez, J. Guillermo Villalobos, Emily Wood, Peter Rerick, Sarah Moody, Katie Snider, Christopher Swinger, Christopher Sanchez, Katelyn Caufield.
We would also like to thank our ASQDE Journal reviewers for their careful review of this manuscript, and for their helpful comments and suggestions.