
Introduction
Analytical techniques for the examination of documents produced using electrophotography have been reported in the literature for nearly two decades with the proliferation of personal printing devices (1, 2). The incidence of cases involving printed documents has been steadily increasing as exemplified in a study by Szafarska et al. (3) that found that up to 59% of a modern caseload consists of printed documents. Techniques currently applied to toner analysis include Fourier transform infrared (FTIR) spectroscopy, especially the application of attenuated total reflectance (ATR), scanning electron microscopy with energy dispersive X-ray analysis (SEM-EDX), laser ablation inductively coupled plasma mass spectrometry (LA-ICP-MS), and pyrolysis gas chromatography mass spectrometry (Py-GC-MS). Though these techniques are common in the forensic setting, they typically require costly instrumentation, extensive sample preparation, time consuming examination, and most are minimally destructive or destructive.
FTIR spectroscopy is the most commonly implemented technique because of its high precision and reproducibility (4, 5). However, FTIR mainly provides information about the resin composition, which does not provide a high power of discrimination in most cases. Polystyrene and Acrylic resins are predominantly used, and only when a rare resin type is encountered are the results highly informative and discriminatory. This has necessitated that FTIR be employed primarily as a complementary technique in combination with other analytical methods (6, 7, 8). Similarly, though SEM-EDX provides reproducible results, it is recommended to be paired with other analytical methods to increase discriminating power. In a study involving 166 toner samples, the results clustered into only 13 different subgroupings (9). A subsequent study which examined 27 toner samples, all from different manufacturers, found that SEM-EDX provided a discrimination rate of 70.7% with a 29.3% type II error rate (10). Among those techniques currently employed, LA-ICP-MS provides the greatest potential for discrimination, with a 100% discrimination rate on the same 27 samples that SEM-EDX failed to discriminate (10). However, LA-ICP-MS instrumentation is costly, and the analysis of results is often complicated by matrix effects from the paper and other types of interferences (11). Although Py-GC-MS has been investigated for the analysis of toner printed documents, the results are neither reliable nor reproducible. Objective analysis of the interferograms produced is time consuming and difficult, and may only yield group characteristics (9, 12).
Toners have magnetic properties that can provide the potential to be discriminated. These properties are present in toners because of their use in the electrophotographic process. During the electrophotographic process, a corona discharge is used to apply a charge to a photoconductive drum, then light is used to discharge excess current and form a latent image on this drum. Toner particles are then directed across the surface of the drum and adhere to the charged areas forming a real image, which is transferred to a document via the application of a secondary corona charge. The image is then fused to the paper using heat and pressure, and the photoconductive drum is cleaned (13). The toner systems used in this process can be either single component (monocomponent) or dual-component (bicomponent) systems. In monocomponent toners, a magnetic component is included in the toner particle – most commonly in the form of pigments. In bicomponent systems, the toner does not contain magnetic compounds and a magnetic conductor, encapsulated in glass beads, is added as a separate component that is recovered after the toner is deposited onto the paper before the toner is fused to the surface. The toner components that can be detected via magnetic flux measurement are the magnetic pigments used in the monocomponent toner systems, which include magnetite, ferrite, and maghemite (14). Magnetic flux can be measured whenever a magnetic field is present, and it also provides a measure of the response of a substance of interest to electric current (15). The compounds used in toner systems are all soft ferromagnetic compounds, which exhibit a magnetic flux value near zero in their native states but are capable of reproducibly conducting magnetic energy (16). Soft ferromagnetic compounds reach saturation magnetization in the presence of a very weak external source of induction. This magnetization is produced by the magnetic moment from the electron spin of the component molecules. The saturation magnetization for a compound with a known composition and mass can be accurately estimated via stoichiometry since the number of electron spins contributed to the magnetic field by each molecule is known. The instrument used for this study combines an internal conductor system with a magneto-optical sensor, which allows for the visualization of the magnetic properties of the toner without displaying the paper or other components of the toner system. This is because the induction system applies a small current in the horizontal image plane to ensure that the magnetic flux field produced as a result will be normal to the vertical image plane (17). Measurements are conducted with this system by introducing a controlled source of weak induction then measuring the resultant magnetic flux field. The induction normal to the surface of the sensor is measured for every pixel of the image in the sensor area of 512 x 640 pixels. This data is then converted to the magnetic flux via the equation |Φ| 5 ʃ|Bn|dA. The sensor does not detect the contribution to the flux field contributed by the external biasing system, as it is in-plane; it detects only the signal being produced by the ferromagnetic particles in the sample. Since the flux field is stabilized at the saturation magnetization during all measurements by the biasing unit then all particles in the sensor area are detected. However, the use of a biasing system can contribute to sample variance via hysteresis (17). Hysteresis is caused by the induced magnetic flux opposing or supporting the external magnetic flux of the sample. This can cause suppression or enhancement of the flux measurement depending on how the biasing system is oriented in relation to the sample and the sample’s native external magnetic field orientation. If the native external magnetic field of the sample is oriented in the same direction as that of the induction current introduced by the in-plane biasing system when it is placed on the sample, then there will be additive effects and enhancement may be observed. However, if the native external magnetic field of the sample is oriented opposite that of the induction current introduced by the in-plane biasing system when it is placed on the sample, then suppression may be observed.
Magnetic flux has been used as a qualitative property to aid in discrimination between electrophotographic documents printed with monocomponent or bicomponent toner systems, but the ability to quantitate the magnetic flux of these samples was not possible until very recently (18). With the development of more sensitive measurement instruments it is possible to quantitate the magnetic flux field of documents. Preliminary investigations into the utility of the application of a magnetic flux measuring device for questioned documents have been conducted by Herlaar et al. (19). They examined 72 samples from 19 different devices and assessed the repeatability of the measurements. The samples were designed to contain the same text in the same font and font size in all the documents and comparisons were performed on measurements which were collected from the same area of text in the test samples. This type of sample site, where the printing and text features being measured are controlled to allow for direct comparison of the measurements, are referenced herein as ‘conserved areas’ of text. Herlaar et al. compared conserved areas of text only and determined that magnetism did provide the potential to discriminate sample origin without causing damage or interfering with further sample processing.
Biedermann et al. (20) expanded upon this initial investigation, analyzing 61 samples from 61 different devices with both magnetic flux measurements and ATR-FTIR spectroscopy. Conserved text areas were used in their study also; however, they investigated inter-operator variability. Their study assessed the repeatability and reproducibility of magnetic flux measurements and concluded that magnetism was complementary to other currently employed techniques. Magnetism aided in discrimination of documents produced using the same device model and the same toner type, where the FTIR resin type did not exhibit significant variation. They determined that magnetism would be most useful when applied to cases where the potential sources of a questioned document were known, and exemplars could be produced and compared to the questioned document.
Although the aforementioned studies showed that the new sensor technology was sensitive enough to allow for quantitation of the flux field of toner samples, these studies primarily assessed only the sensitivity and stability of the instrument. Our study focuses on evaluating factors that may affect the reliability of results. The experimental process was broken down into 3 phases corresponding to 3 declared objectives to facilitate testing of variables in a controlled manner. In phase 1, the stability of the flux fields of toner printed documents over time was assessed. In phase 2, the relationship between toner area and magnetic flux was evaluated. And, in phase 3, the flux measurements of a representative population sample were analyzed to determine the repeatability of measurements and the variation. For the purposes of this study, repeatability refers to the consistency of measurement results produced under the same testing conditions by the same operator.
Methods and Materials
Instrumentation
A Regula® Magmouse 4197 (Regula Forensics Inc., Reston, VA) visualizer for magnetic properties was used to conduct all magnetic flux measurements. All measurements were carried out on a wooden table with a glass plate surface. The sensor area for all image collections and measurements was set to 512 x 640 pixels. A negative quality control (QC) sample was used at instrument startup and between each sample. The negative QC consisted of a blank 8.5 inch by 11 inch piece of plain white paper. A sample document with an established flux value was used as a positive quality control sample. The flux value for the positive QC sample was established 1 year prior via concordance of measurements of 3 operators as 15 nano Webers (nWb) +/-2 nWb for the standard area of 10 point text. The positive QC was sampled using this standard area at instrument startup and at regular intervals afterwards.
Sample sets
All measurements were performed on toner samples from the School of Criminal Sciences, University of Lausanne, Switzerland. This included 5 samples of known origin collected in 2009 which were previously measured by multiple operators and had an established magnetic flux value. The sample properties for the known origin samples are summarized in Table 1 below. Also, 150 monocomponent toner printed samples were obtained from a representative population sample of 212 total pieces of toner printed mail collected between 2007 and 2016. These samples were collected from mail that the university received during the time period indicated which were microscopically analyzed to determine the media used for document production.
Table 1.
Summary of the sample designation, device, and toner type information for the known origin samples analyzed.
| Sample Number | Brand and Model | Toner Type |
|---|---|---|
| 1 | Canon iR 2230 | Canon Toner C - EXV 11 |
| 56 | Canon iR 3300 | Canon Toner C - EXV 3 |
| 66 | Canon iR 2200 | Canon Toner C - EXV 3 |
| 144 | Canon iR 3025N | Canon Toner C - EXV 11 |
| 161 | Canon iR 3035N | Canon Toner C - EXV 12 |
Sampling Methods
In phase 1, trials were conducted on the 5 samples with previously established magnetic flux values to determine if the magnetic flux of toners was stable over time. The positive QC was sampled at instrument startup and once every 5 samples thereafter during this phase of testing. Measurements were conducted at 3 different sites per sample, on conserved areas of text printed in 3 different font sizes (Figure 1). A series of 10 replicate trials was conducted over the course of 1 week, to total 150 measurements. The flux values resulting from these trials were compared to measurements obtained 1 year prior by 3 different individual operators to assess the stability over time. The values for the magnetic flux at T0 and T1 year were compared using Bland-Altmann mean difference tests performed by Biedermann et al. (19) to establish a baseline for the expected variation due to inter-operator variability.
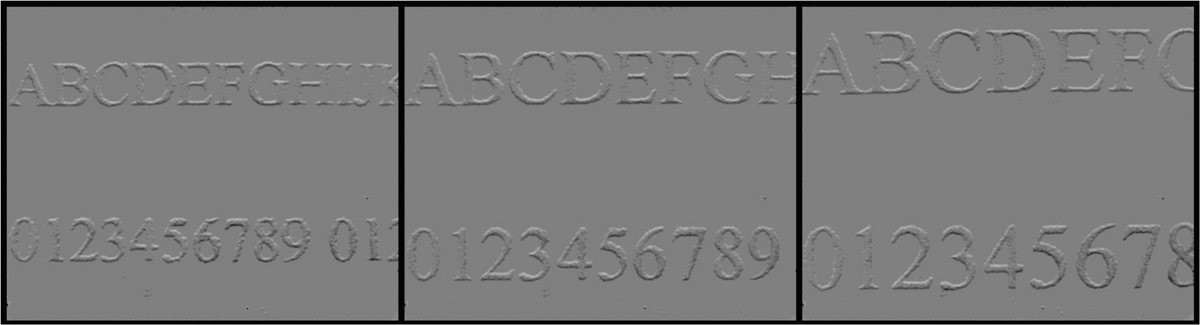
Figure 1.
Standard text on which magnetic flux was measured for all phase 1 samples. 8 pt, 10 pt, and 12 pt font respectively.
In phase 2, the area of each measurement from phase 1 was determined using Adobe® Photoshop® CC 2015 (Adobe Systems Inc., San Jose, CA). The flux was checked for correlation to area of toner measured by plotting the mean magnetic flux for the 10 replicates of each sample site as a function of the mean area in mm2 for the 10 replicates of each sample site in Microsoft® Excel™ 2016 (Microsoft Corp., Redmond, WA). Linear trend lines were added and the fit of the lines were assessed based on their R2 values.
Conditions for ANOVA were tested, including testing for outliers, checking the normality of the distributions, and checking the homogeneity of variances. The Dixon Q-test was used to test for outliers by calculating Q as the gap between the questioned value and the closest value divided by the total range of the values for the distribution. The Ryan-Joiner test was used to check the normality of the distributions, calculated in MiniTab® 17 Statistical Software (MiniTab Inc., State College, PA). The Ryan-Joiner test was selected due to its similarities to the Shapiro-Wilkes test for normality, and its efficacy in detecting nonnormality in sample sets which are small and may contain outliers. Levene’s test was then applied to check for homogeneity of variances. The data were further processed using R statistical analysis software (21). A box plot was used to check for visual trends. ANOVA was then used to check for variance within groups. The ANOVA findings were further explored using the Welch t-test.
In phase 3, trials were conducted on the 150 monocomponent samples from the mail population. The positive QC sample was tested at instrument startup and every 10 samples thereafter during this phase of testing. Measurements were conducted in a series of 3 replicate trials over the span of 1 week. The resultant measurements were normalized after collection by determining the toner area for each measurement individually using image processing software and then calculating the flux as a function of toner area. The data were then plotted to assist appreciation of the variation within the population and to visually assess the repeatability of the method.
Area Determinations
All documents were scanned at a resolution of 1200 pixels per inch (ppi) in A4 size in greyscale mode. The data were saved in a Tagged Image File Format (TIFF). Scans were performed using the CanoScan® LiDE 50 (Canon Inc., Tokyo, Japan) and the accompanying CanoScan® Toolbox 4.1 version software. The area calculations were performed using Adobe® Photoshop® CC 2015. The scanned original image was overlaid with the image from the Regula® Magmouse 4197. The images were normalized and aligned and then the original image was cropped to the dimensions of the instrument image. Pixel values representative of the toner were selected and measured. The toner area in pixels was then converted to the toner area in mm2 using the formula [TeX:] \documentclass[10pt]{article} \usepackage{wasysym} \usepackage[substack]{amsmath} \usepackage{amsfonts} \usepackage{amssymb} \usepackage{amsbsy} \usepackage[mathscr]{eucal} \usepackage{mathrsfs} \usepackage{pmc} \usepackage[Euler]{upgreek} \pagestyle{empty} \oddsidemargin -1.0in \begin{document} \[ {(Area\ in\ Pixels \times 645.16\ mm^{2}) \over 1,440,000\ pixels^{2}} \] \end{document} which was calculated on the basis of the 1200 ppi scanning resolution. It is important to note that 2 of the 150 population samples were discarded during image processing due to issues with scan collection and conversion which resulted in poor quality images which could not be used for the area determination process. As the original documents were no longer accessible for further scan collection, those 2 samples were excluded, leaving 148 samples which were further analyzed in the population trial.
Results
Phase 1
The area of the 10 point font samples was conserved across all trials. The results of the measurements taken at the site of the 10 point font were compared for the T0 and T1 year samples. The means of the T1 year measurements were compared to the overall means for the 3 operators at T0 and found to be within the intervals defined by the Bland-Altmann mean difference plots in the Biedermann et al. study (20).
Phase 2
After determining the area, the magnetic flux as a function of toner area was plotted for each sample. Linear and quadratic trend lines were added to assess fit, and the linear model was determined to be the best fit. R2 coefficients were found to range from 0.92-0.99 using the linear model (Figure 2). The data were then plotted in a box plot to check for visually observable trends (Figure 3).
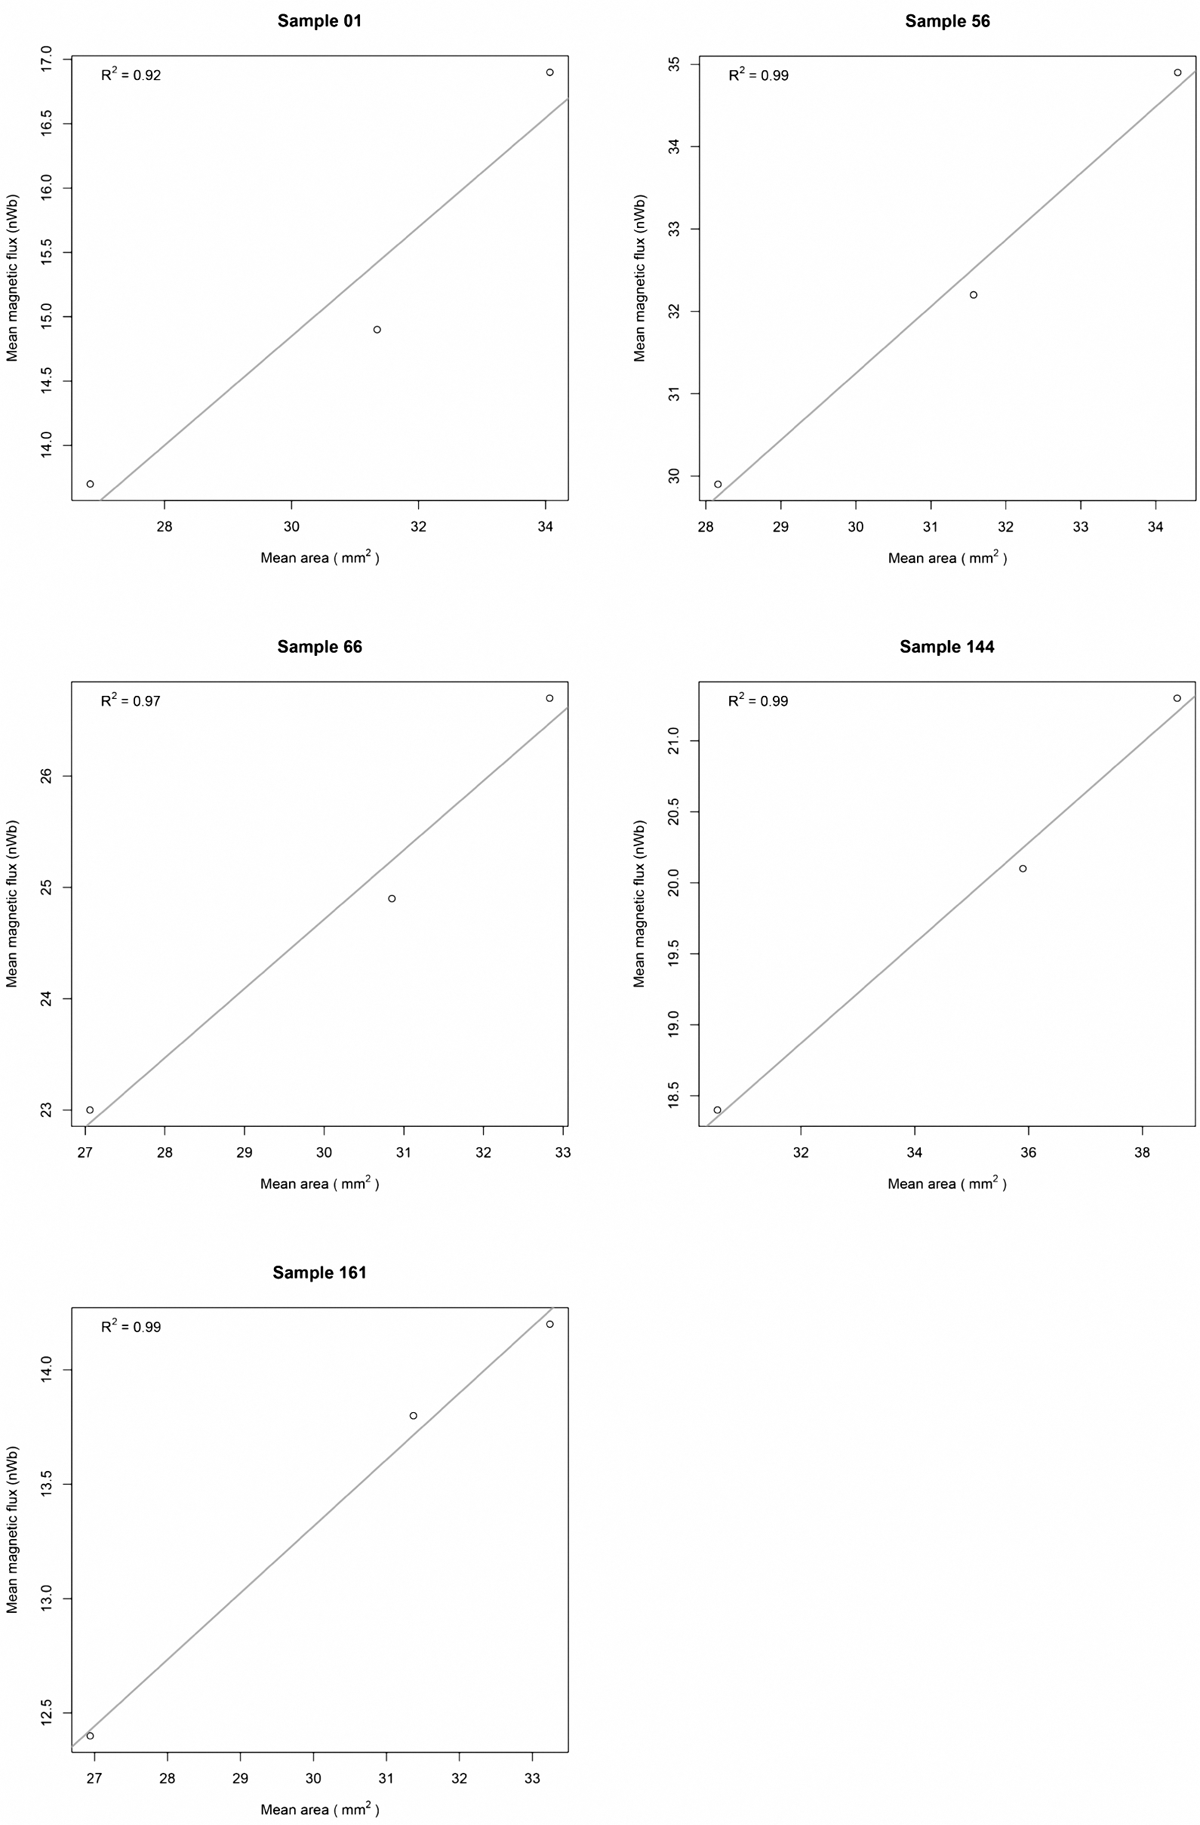
Figure 2.
Plots of magnetic flux a function of toner area for all phase 2 samples with linear trend lines showcasing the range in R2 coefficients. Although the linear model was found to effectively model the relationship between toner area and magnetic flux, there were some limitations to the linear model which could contribute to the observed variation in R2 coefficients.
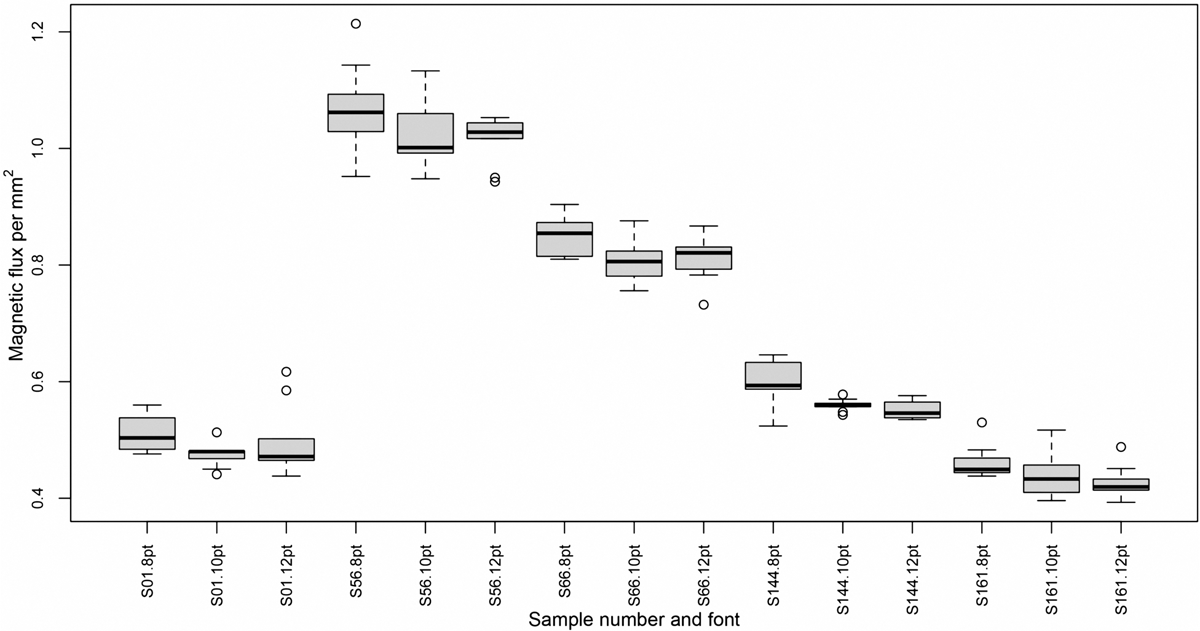
Figure 3.
Box plot of all phase 2 data. Note the visual differences between groups. ANOVA was used to check for significant variance within groups as well as between the groups that appear to overlap (samples 1 and 161).
Though there were differences between groups, conditions for ANOVA were assessed and ANOVA was used to check for variance within and between groups. The data were checked for outliers using the Dixon Q-test. An aberrant value was identified from the size 12 font measurements of the sample 1 data set, significant at the 99% confidence level, and was rejected. Another potential outlier was identified in the same sample group, significant at the 95% confidence level but not the 99% confidence level, however this data point was included for further testing. The normality of the distributions was assessed using the RyanJoiner test. The sample sets contained less than 20 samples so conditions were not ideal, however the lowest result was 85% (for the group with 1 data point removed) and the rest ranged between 90%-97%. These results were considered acceptable for the sample size. Last, the homogeneity of variances was assessed using Levene’s test. The hypothesis that the group variances are equal was tested with a DOF = 9, α = 0.05, and an Fcrit of 1.9855. The calculated statistic W of 1.8957 indicated there was not sufficient evidence to conclude the variances were unequal. The hypothesis for our ANOVA was as follows: H0 “There is no significant mean difference between measurements collected from different fonts on the same sample”, and HA “At least one font size has a significantly different mean value”. A summary of results with the F-statistics and p-values is presented in Table 2. The ANOVA results indicated that there were some groups which showed a significant mean difference. Samples 56 and 144 had p-values of <.001 and .012, respectively.
Table 2.
Summary of results of within-group ANOVA testing of phase 2 data (a=0.05, pcrit=0.05)
| ANOVA Within Groups | F-stat | p-value |
|---|---|---|
| Sample 1 - 8 pt, 10 pt, and 12 pt | 1.43 | .271 |
| Sample 56 - 8 pt, 10 pt, and 12 pt | 134 | <.001 |
| Sample 66 - 8 pt, 10 pt, and 12 pt | .220 | .653 |
| Sample 144 - 8 pt, 10 pt, and 12 pt | 11.4 | .012 |
| Sample 161 - 8 pt, 10 pt, and 12 pt | 3.20 | .117 |
These differences were further explored using the Welch t-test. The hypotheses for the Welch t-test were: H0 “There is no significant mean difference between measurements collected from different fonts on the same sample” and HA “There is a significant mean difference between measurements collected from different fonts on the same sample”. The Welch test results, summarized in Table 3, indicated that samples that were known to have come from the same source could not be differentiated when normalized to units of flux per mm2 of toner. However, there were some exceptions with the size 8 font samples. In 6 of the 10 pairings where the size 8 font was compared to another font from the same sample, there was a significant mean difference. Although the normalization did allow for useful comparison of size 8 font samples in some cases, the normalization did not appear to be as effective on the size 8 font, particularly for samples 66 and 144, where the size 8 font was differentiated from the other fonts but the size 10 and 12 fonts were not differentiated from one another.
Table 3.
Results of within-group Welch 2-sample t-tests (α=0.05, pcrit=0.05).
| Welch 2 Sample t-test Within Groups | p-value |
| Sample 1 font 8 and Sample 1 font 10 | .010 |
| Sample 1 font 8 and Sample 1 font 12 | .507 |
| Sample 1 font 10 and Sample 1 font 12 | .317 |
| Sample 56 font 8 and Sample 56 font 10 | .168 |
| Sample 56 font 8 and Sample 56 font 12 | .112 |
| Sample 56 font 10 and Sample 56 font 12 | .897 |
| Sample 66 font 8 and Sample 66 font 10 | .007 |
| Sample 66 font 8 and Sample 66 font 12 | .033 |
| Sample 66 font 10 and Sample 66 font 12 | .055 |
| Sample 144 font 8 and Sample 144 font 10 | .005 |
| Sample 144 font 8 and Sample 144 font 12 | .009 |
| Sample 144 font 10 and Sample 144 font 12 | .656 |
| Sample 161 font 8 and Sample 161 font 10 | .207 |
| Sample 161 font 8 and Sample 161 font 12 | .014 |
| Sample 161 font 10 and Sample 161 font 12 | .391 |
Additional testing was also done with samples 1 and 161, which appeared to overlap in the box plot. The hypotheses proposed for analysis using the Welch t-test were H0 “There is a significant mean difference between measurements collected from different samples” and HA “There is no significant mean difference between measurements collected from the two different samples”. Most of the pairings could be differentiated; however, the 8 point font for sample 161 could not be differentiated from sample 1 in two pairings where the p-values were 0.188 and 0.111 respectively. The 8 point font for all other sample pairings could be differentiated. The Welch test results are summarized in Table 4.
Table 4.
Results of between group 2 sample Welch t-tests (a=0.05, pcrit=0.05).
| Welch 2 Sample t-test Between Groups | p-value |
| Sample 1 font 8 and Sample 161 font 8 | .002 |
| Sample 1 font 10 and Sample 161 font 10 | .025 |
| Sample 1 font 12 and Sample 161 font 12 | .006 |
| Sample 1 font 8 and Sample 161 font 10 | <.001 |
| Sample 1 font 8 and Sample 161 font 12 | <.001 |
| Sample 1 font 10 and Sample 161 font 8 | .188 |
| Sample 1 font 10 and Sample 161 font 12 | <.001 |
| Sample 1 font 12 and Sample 161 font 8 | .111 |
| Sample 1 font 12 and Sample 161 font 10 | .026 |
Phase 3
Since the primary hypotheses in phases 1 and 2 could not be rejected, the variation in a representative population was then assessed using the flux in nWb per mm2 of toner as a normalizing unit. The population data are presented in Figure 4 by means of a stripchart. In this visualization, the intra-sample variation can be appreciated; most of the measured values are close or overlapped within a sample with very few samples exhibiting large dispersions. Another notable feature is the presence of some zero values. These were recorded for samples that could be visualized using the Regula® Magmouse 4197, indicating the presence of ferromagnetic compounds, but which had a sparse dispersion of particulates over the measured area leading to an inability for the instrument to quantitate the flux. The instrument is reported by the manufacturer to have a sensitivity of around 1-2 nWb within the sensor area, meaning that if there is a total of 1 nWb of magnetic flux or greater within the sensor area it should be detectable.
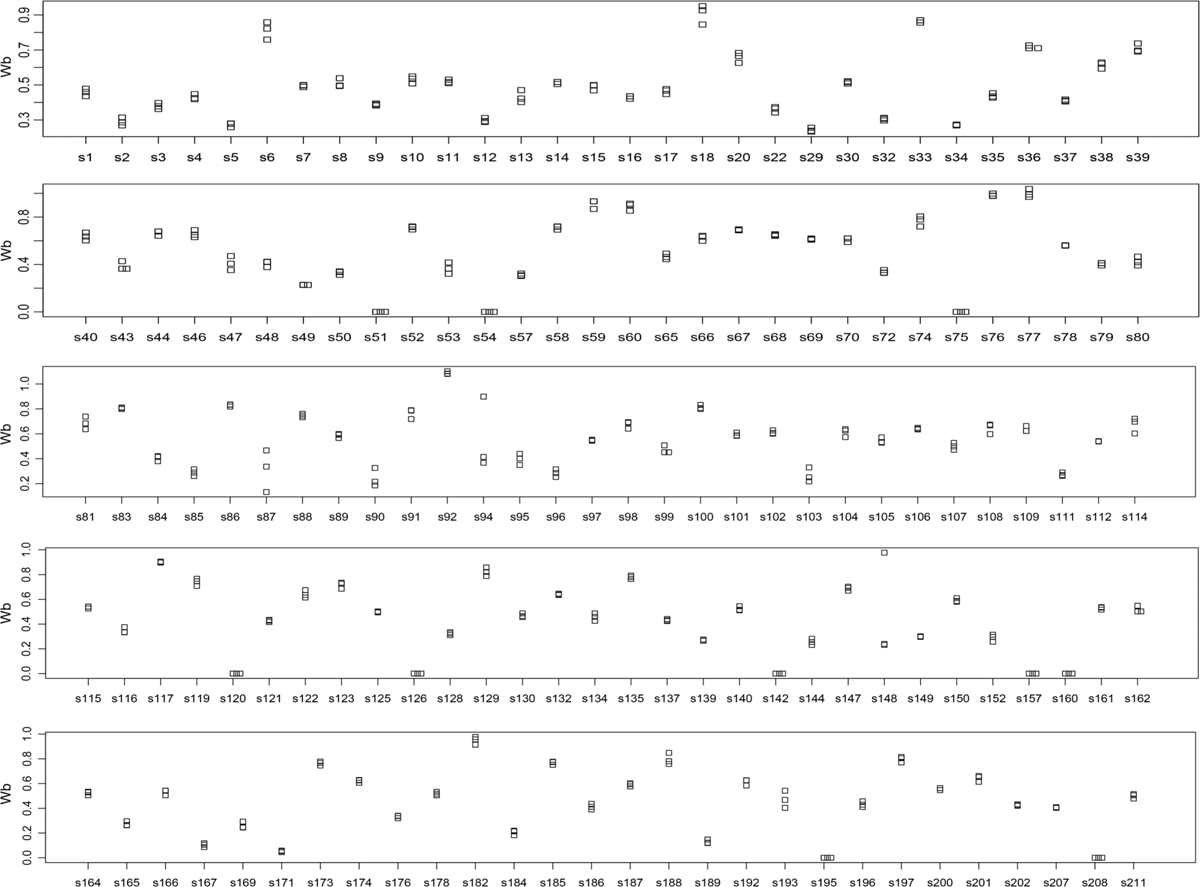
Figure 4.
Strip charts of the population data from phase 3. The strip charts highlight the repeatability of the method based on three replicate measurements. Most of the values are close or overlapped within a sample, with very few samples exhibiting large dispersions. Zero values were also recorded for some samples.
The population distribution was further assessed by plotting a histogram. The bin resolution was optimized by basing the bin width off the maximum difference between the histogram and the true distribution. A kernel density estimate was then added to the histogram to improve the appreciation of the distributional shape and to estimate the probability density function of the collected magnetic flux measurements (Figure 5). The histogram depicts the distribution of the 444 magnetic flux values measured for the 148 population samples showing the relative rarity or commonness of the measured feature in the sampled population.
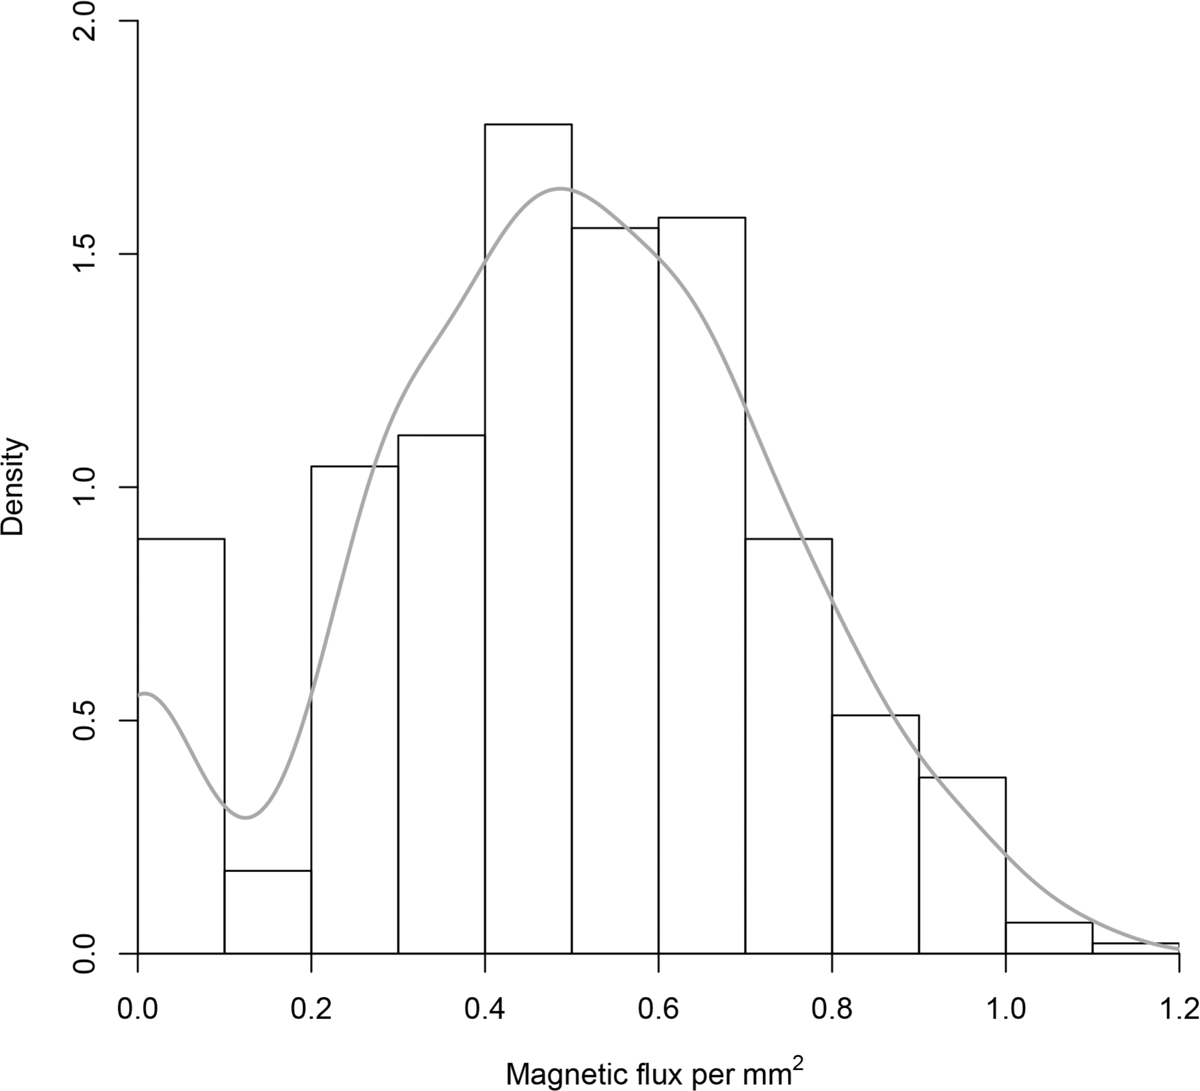
Figure 5.
Histogram of the population distribution with a kernel density estimation added to estimate the probability density function of the collected magnetic flux measurements. This aids in the assessment of the rarity or commonness of the measured features that may be useful for addressing questions about inferences of source.
Discussion
During this study, it was found that the instrument was highly pressure-sensitive. If any pressure was applied to the instrument while placing it, the sensor registered the magnetic flux values as higher than the true values. Therefore, the negative QC sample was tested between every sample to check for any aberrant increase in measurement values that may have been caused during the measurement of the previous sample and provide a method to control for this. However, a potentially aberrant value was still identified in the phase 2 data using the Dixon Q test, and because of the potential for this value to have been influenced by poor instrument handling and the application of pressure to the sensor during the placement of the instrument in the initial stages of the study, this value was discarded.
The results from phase 1 were found to be within the intervals defined by the Bland-Altmann mean difference plots (+/-2 nWb from the overall group mean for all operators) indicating that the mean variance was due to inter-operator variability and was not due to a change in flux values over time. This supported the hypothesis that the magnetic flux of toner is stable over time.
The relationship between toner area and magnetic flux could be effectively modeled via a linear model with R2 coefficients ranging between 0.92-0.99. Though the linear model was highly effective for describing most of the sample systems, the R2 value of 0.92 for sample 1 does indicate that the linear model was not as effective for describing this sample. This may be because of low representativeness of the data or dispersion since only 3 points were used to form the line. Also, the low R2 value could be due to factors that were not controlled in the sample such as inhomogeneity in the distribution of ferromagnetic particles or hysteresis effects from the biasing system. The linear model also does not account for factors such as the depth of deposition of toner, which could contribute to the differing levels of intra-source variation exhibited by different printing devices studied. Despite the issue with sample 1, the linear model was found to be adequate to describe the relationship between the area of toner sampled and the magnetic flux measurements.
The results of the Welch statistical test both within and between sample groups illustrated that the 8 point font did appear to have some differences in characteristics compared to the other fonts which made the normalization less effective. The effects of the depth of deposition of toner and other printing factors have not yet been assessed, which may be why the normalization was not as effective on the 8 point font as it was on the 10 and 12 point fonts. Although the relationship between toner area and flux measurement is useful since it allows for normalization of data and comparison of samples with variable text and print features, further study is necessary to determine what factors affect the analysis and how these may be controlled. The toner area normalization was used on the phase 3 data. Although no standard text was available for this sample set at this time, toner area normalization was found to be an effective model in most cases.
The assessment of a representative population revealed that there is enough variation present in toner populations to allow for discrimination based on flux measurement. The presence of zero values indicates that there were samples which reached the threshold for the limit of detection [LOD], but not the limit of quantitation [LOQ] for the device. These results could provide data useful for analysis in a categorical ordinal system, which may reach the threshold for the LOQ in the future if the sensor technology is updated. For now though, the classification of non-magnetic, low-magnetic (for those samples that reach the LOD but not the LOQ), and magnetic (which can be further elucidated via quantitation) is feasible.
Although previous studies have found that both the toner cartridge and device can have an impact on the magnetic flux of a sample, samples produced by different versions of the same device model may exhibit significantly different magnetic flux values, which should be noted. If both devices have the same features, including the same type and lot of toner cartridge and the same version of a photoconductive drum, the variation in the sample will result from how the photoconductive drum disperses the toner particles onto the paper, which is also related to the charge dispersion of the individual photoconductive drum. The toner particles themselves are not physically changed by their interactions with the photoconductive drum and maintain the same values for their saturation magnetization. That is, the only way the values could differ is by differing the dispersion of the particles.
Preliminary tests conducted at the Ecole des Sciences Criminelles (ESC) were able to show that the magnetic flux is not homogeneous across an entire A4 printed page; however, the magnetic flux distribution is similar from page to page within the same printing system. The factors hypothesized to contribute to the heterogeneity include the distribution of ferromagnetic material in the toner cartridge, the distribution of charge on the Organic Photoconductor (OPC) drum, and the uniformity of the depth of the organic coating of the OPC drum. The heterogeneity of the magnetic flux distribution may be caused by one or a combination of these factors, so further investigation is necessary to determine what factors contribute significantly to the heterogeneous sample distribution. To control for this heterogeneity during analysis, it is critical to ensure that the areas of text that are compared are located in the same relative positions of the documents analyzed to ensure the compared areas are from sections with consistent toner density and magnetic flux.
Additionally, although there is the potential for hysteresis effects to add to the variance in the magnetic flux measurement of toners since the native magnetic flux of ferromagnetic compounds is small, this effect is expected to be not significant. Further studies need to assess the extent and impacts of the dispersion caused by the photoconductive drum, as well as present a method proposed to control for any hysteresis effects. The technique used for area determinations also warrants further research and method development. The methodology used in this study requires refinement to investigate method robustness as well as device error and uncertainties that contribute to variance. For example, it was determined during the phase 2 sample analysis process that limiting the mean pixel value for the replicates of a sample appeared to decrease the variance for that sample set. Therefore, the mean pixel value for the remaining replicates and all phase 3 samples was limited to +/- 1. Magnetism is promising as an efficient, non-destructive tool to aid in discrimination of toner printed documents, but more investigation is necessary before validation and casework application is possible.
Conclusion
Quantitative measurement of the magnetic flux of toners provides the potential to serve as an efficient and non-destructive screening tool for casework application in the field of questioned document examination. The instrument provides reliable and repeatable results, and the magnetic flux of toner is stable over time. Magnetic flux could be correlated to toner area, which allows for normalization of results and comparison of documents with different properties. There is enough variation in toner populations to allow for discrimination; however, additional research is necessary before this methodology can be validated and applied to casework. More research is needed to understand the optimal number of replicate measurements, how to reduce instrumental and method induced variance, and to determine the utility and limitations of the flux per mm2 as a normalizing unit.